
Abstract
Objective:
The objective of this study was to evaluate the characteristics of high body mass index (BMI) and normal weight people living with HIV after antiretroviral therapy (ART) and establish a model.
Methods:
A total of 290 people living with HIV after 1 year of ART treatment were enrolled and divided into two groups based on whether their BMI index was <24 or ⩾24 at week 48. The demographic, clinical data were collected and analyzed. Multivariable logistic regression analysis was performed. A model was established and use to predict the occurrence of certain diseases.
Results:
A total of 290 people living with HIV were included in this study; 200 had a normal BMI (BMI < 24) and 90 were high BMI (BMI ⩾ 24) after 1-year ART. Their baseline characteristics were significantly different in relation to age (p = 0.007), sex distribution (p = 0.040), ART regimen (p = 0.040), alanine aminotransferase levels (p < 0.001), and three major serum lipid levels: triglycerides (p < 0.001), cholesterol (p = 0.011), and low-density lipoprotein (p = 0.005). A multivariate logistic regression analysis resulted in the development of a model for the diagnosis of high BMI and hyperlipidemia. The model score is an independent risk factor for hyperlipidemia (odds ratio = 2.674, p = 0.001) and high BMI (p < 0.001). The model score is significantly correlated with the controlled attenuation parameter (CAP) value (r = 0.230, p < 0.001) and can be used to divide the severity of liver steatosis based on CAP value.
Conclusions:
This study demonstrated a easy-to-use model to detect high BMI, hyperlipidemia, and liver steatosis in people living with HIV without risk factors for BMI changing at baseline after 1 year of ART treatment.
Keywords
Introduction
Since the discovery of human immunodeficiency virus (HIV) in the 1980s, AIDS (acquired immunodeficiency syndrome) has become one of the major causes of death worldwide. 1 From 2004 to 2016, there were reported to be totally 318,895 cases of people living with HIV in China. 2 However, with the introduction of antiretroviral therapy (ART), the morbidity and mortality of people living with HIV decreased significantly.3,4 From 2000 to 2019, there was an approximate 45% reduction in AIDS-related mortality rate. 5 Although ART has significantly reduced the death rate among people living with HIV, improving the long-term prognosis of people living with HIV remains a challenge.1,6,7 In particular, the morbidity of HIV-related metabolic syndrome, fatty liver, hyperlipidemia, and high body mass index (BMI) has increased.7,8
Weight changes in people living with HIV after initiation of ART is very common. 8 BMI is a widely applied indicator for assessing the degree of obesity. While studies have shown that BMI is related to the mortality of people living with HIV, the conclusions of which are contradictory. Studies have found that high BMI is negatively correlated with the disease progression and mortality in people living with HIV.9,10 High BMI is closely related to fatty liver, metabolic syndrome, cardiovascular events, and other diseases.11–13 Therefore, maintaining a healthy BMI is essential for long-term prognosis of people living with HIV. However, it is still unclear how to assess the risk of BMI change in people living with HIV after receiving ART.
Thus, we conducted a retrospective study. We enrolled people living with HIV with and without high BMI after 48 weeks of ART. By analyzing the differences in baseline clinical data, we constructed a model that helps to group people living with HIV at baseline to assess their prognosis.
Subjects and methods
People living with HIV studied and study design
This is a retrospective study. According to the sample size estimation formula, a total of 290 people living with HIV were enrolled in our study. All the people living with HIV were Asians. All the people living with HIV enrolled were regularly followed up at Nanfang Hospital. People living with HIV were excluded (1) if there was a lack of vital medical information or (2) if the people living with HIV had an underlying disease(s) or medical conditions that influence BMI index: cancers, T2DM, hyperthyroidism, tuberculosis (TB), eating disorders, and not taking menopausal hormone therapy for the past 3 months. Moreover, to avoid the influence on measurement of CAP value, viral hepatitis including HBV infection and HCV infection were also excluded. The medical records of complete blood count (CBC), biochemical tests, and HIV virological parameters were documented. The ethics committee of Nanfang Hospital approved this study, and each enrolled people living with HIV provided informed consent.
Laboratory testing
CBC tests were performed after an overnight fast and analyzed using a Sysmex SE9000 automated blood cell analyzer. Serum alanine aminotransferase (ALT), albumin, and other serum biochemical parameters were measured using an Olympus AU5400 automated biochemical analyzer. Lymphocyte detection was performed with a flow cytometer. HIV RNA was detected using a polymerase chain reaction machine. Plasma levels of cholesterol and triglycerides (TG) were determined using enzymatic methods. Low-density lipoprotein (LDL)-cholesterol levels were calculated using the Friedewald’s equation. All the detections and evaluations were performed in a central laboratory in the Department of Clinical Laboratory in Nanfang Hospital.
Clinical parameters
Information was collected including people living with HIV’s demographic data, ART regimen, CBC, serum lipids profile, HIV RNA viral load, CD4+ T cell count, and CD8+ T cell count. People living with HIV are staged according to their clinical presentation and peripheral CD4+ T cell count. 14 Education level was defined as follows: primary if people living with HIV had received <12 years of education and senior if people living with HIV had received >12 years of education. Hyperlipidemia was defined in this study as total cholesterol (T-CHOL) and/or TG levels exceeding the upper limit of normal (1*ULN).
Controlled attenuation parameter (CAP) measured by transient elastography
The CAP value was assessed using transient elastography by a professionally trained technician according to the manufacturer’s instructions. Briefly, the operation was performed on the right lobe of the liver through the intercostal spaces while they were lying in the decubitus position with the right arm abducted. Ultrasonic attenuation was measured at 3.5 MHz using signals assessed by transient elastography. The median CAP value was expressed in decibels per meter (dB/m). A CAP value was considered reliable with both interrogative range/median <0.3 and a success rate of >60%. We considered a CAP value of >248, 268, and 280 dB/m for >S0, >S1, and >S2 to indicate liver steatosis. 15
Statistical analysis
The measurement units were expressed as mean ± SD for normally distributed data and median (range) for data showing non-normal distribution. Categorical data were expressed as a percentage. Paired t test and Pearson correlation analysis were used to compare the differences, when appropriate. The area under the receiver operating characteristic (AUROC) curve and logistic regression were calculated. Sensitivity, specificity, and odds ratio (OR) values were applied. All analyses were performed using SPSS (version 26.0) software with an alpha level of 0.05.
Results
Baseline demographics and clinical characteristics
A total of 290 people living with HIV were included and divided into two groups based on whether their BMI was <24 or ⩾24 after 48 weeks’ ART (control group and high BMI group). Age in the high BMI group was significantly higher than in the control group (37.94 ± 10.85 versus 34.07 ± 12.17 years, respectively; p = 0.007) (Table 1).
Baseline characteristics of the high BMI and normal BMI people living with HIV after ART treatment.

ALB, albumin; ALT, alanine aminotransferase; ART, antiretroviral therapy; BMI, body mass index; CHOL, cholesterol; HGB, hemoglobin; INSTI, integrase strand transfer inhibitor; LDL, low-density lipoprotein; PLT, platelet; TG, triglycerides; WBC, white blood cell.
Analysis of baseline characteristics as a predictor of BMI ⩾ 24 after ART
A multivariate analysis was conducted to evaluate the risk factors associated with BMI ⩾ 24 after 48 weeks’ ART. The results showed that gender (OR = 0.261, p = 0.042), age (OR = 1.030, p < 0.012), baseline ALT level (OR = 1.032, p < 0.001), baseline TG level (OR = 1.825, p = 0.001), and baseline LDL-C level (OR = 1.592, p = 0.033) were independent risk factors associated with high BMI after ART (Table 2).
Univariate and multivariate analysis for high BMI after 48 weeks’ ART.
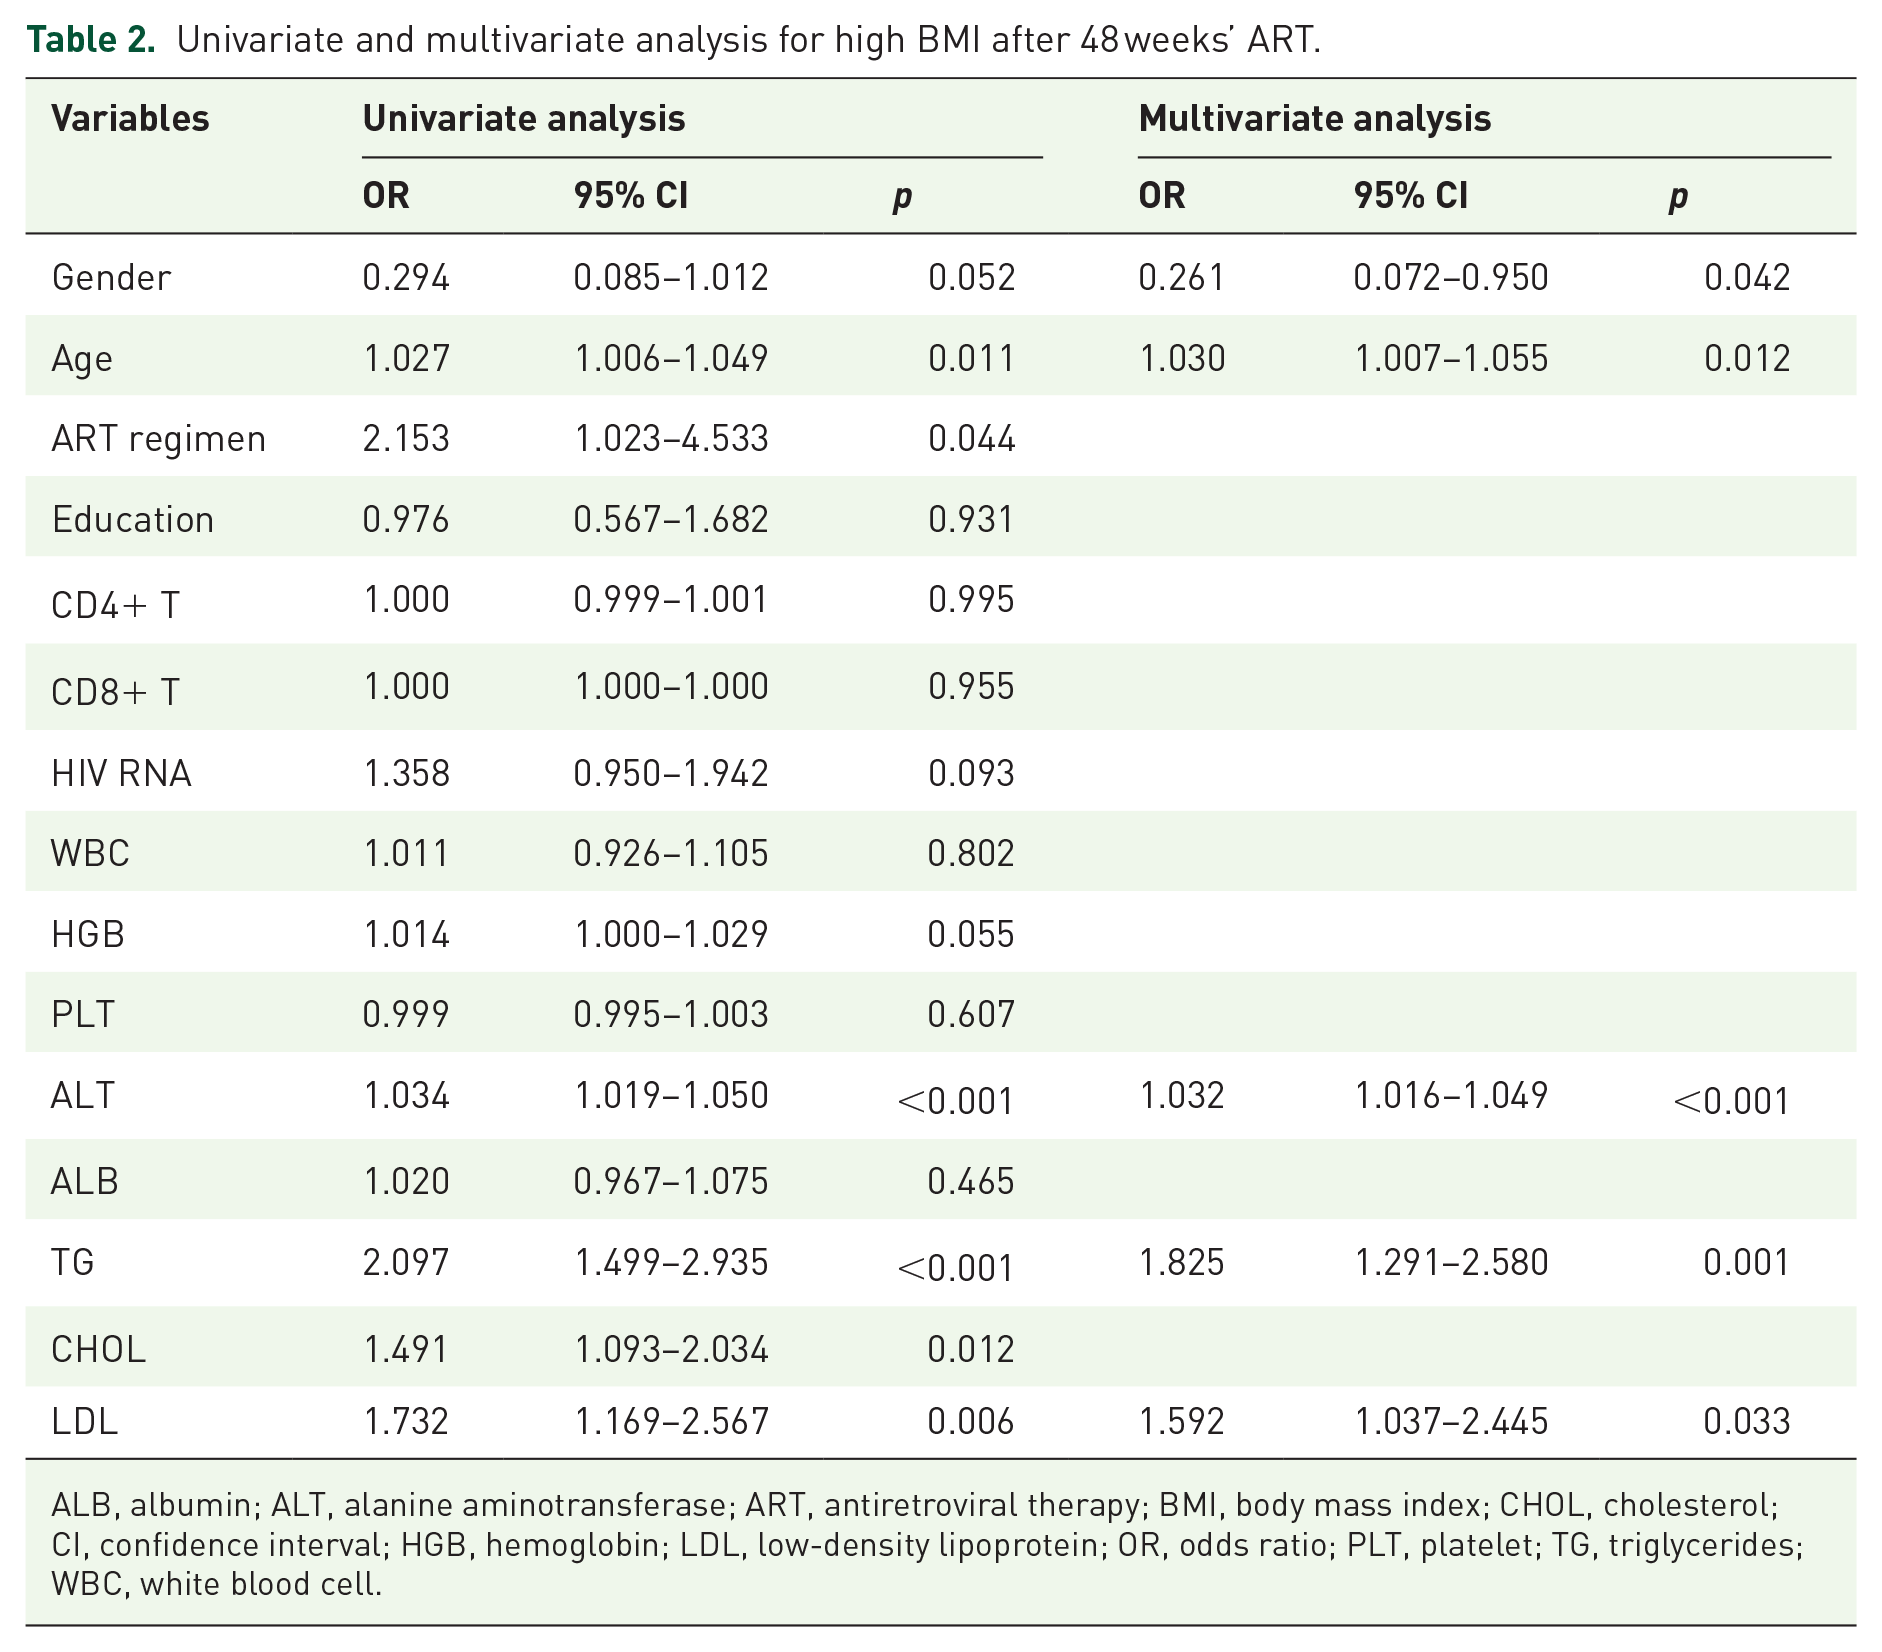
ALB, albumin; ALT, alanine aminotransferase; ART, antiretroviral therapy; BMI, body mass index; CHOL, cholesterol; CI, confidence interval; HGB, hemoglobin; LDL, low-density lipoprotein; OR, odds ratio; PLT, platelet; TG, triglycerides; WBC, white blood cell.
Therefore, the following model was constructed: model = −4.686 − 1.345 × gender (1 if male and 0 if female) + 0.030 × age + 0.031 × ALT + 0.602 × TG + 0.465 × LDL-C.
Validation of model score as a predictor of BMI ⩾ 24 after 48 weeks’ ART
People living with HIV were grouped into a low-risk group and a high-risk group based on the mean value of model scores (−2.0). As shown in Figure 1(a), BMI was significantly higher in the high-risk group than in the low-risk group (23.88 ± 3.64 versus 21.39 ± 3.06, respectively; p < 0.001). Likewise, the proportion of high BMI people living with HIV were higher in the high-risk group than that in the low-risk group (47.9% versus 19.8%, respectively; p < 0.001, Figure 1(b)). AUROC curve was then constructed showing our model variables performed better than other variables in predicting progression into high BMI after 48 weeks’ ART (Figure 1(c)). When the model was used to predict high BMI with a cutoff value of −2.90, its sensitivity and specificity were 94.4% and 32.7%, respectively. When the model was used to predict high BMI with a cutoff value of −1.35, its sensitivity and specificity were 41.1% and 81.9%, respectively.
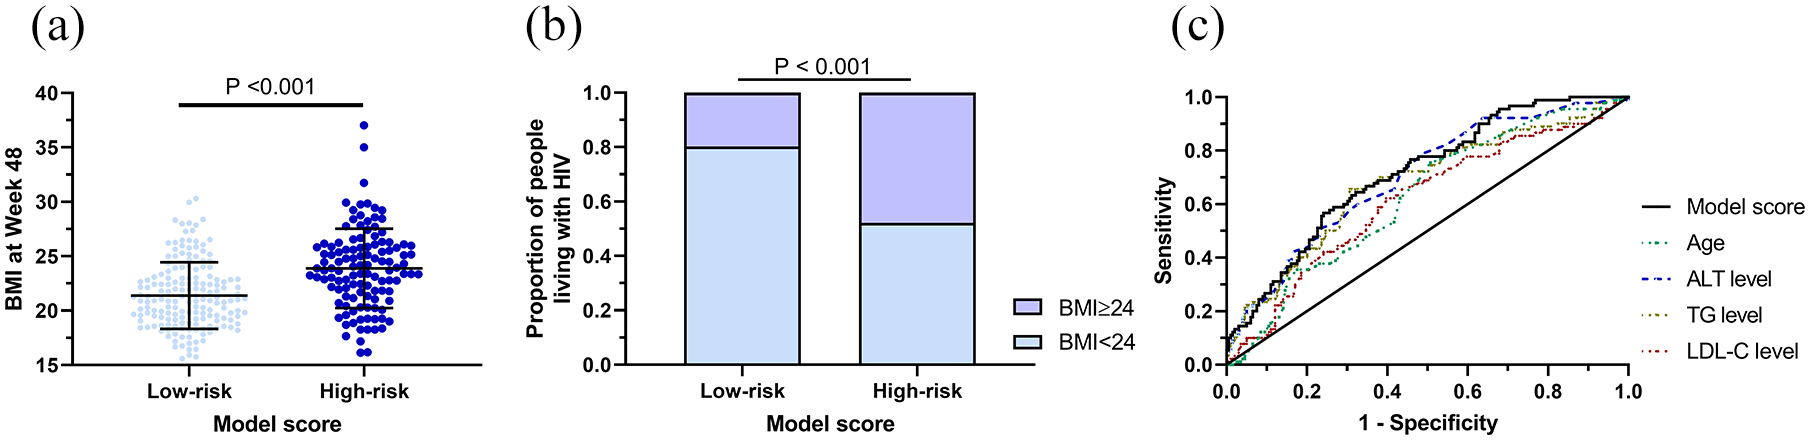
(a) High BMI people living with HIV are divided into a low-risk and high-risk group according to model score (p < 0.001). (b) Proportions of people living with HIV who are high BMI or not in the low-risk and high-risk groups (p < 0.001). (c) The AUROC curve relating to model score and age, ALT level, TG level, and LDL-C level.
High model score as an independent risk factor associated with high BMI after 48 weeks’ ART
To further validate the efficacy of our model in predicting high BMI after 48 weeks’ ART, univariate and multivariate analyses were conducted. In multivariate analysis, we employed three methods to establish different models. In the enter analysis, model score (p = 0.001) and gender (p = 0.005) were independent risk factors associated with high BMI after 48 weeks’ ART treatment among people living with HIV. In the forward analysis, model score (p < 0.001), gender (p < 0.001), and platelet (PLT) counts (p = 0.017) were independent risk factors. In the backward analysis, CHOL levels (p = 0.031) rather than PLT counts were used as a risk factor, while model score (p < 0.001) and gender (p < 0.001) remained independent risk factors. All the results are shown in Supplementary Table 1.
Performance of model to predict hyperlipidemia after 48 weeks’ ART
We found a positive correlation between model score and serum TG level at week 48 (r = 0.351, p < 0.001). Similar trends were observed in CHOL level (r = 0.398, p < 0.001) and LDL-C level (r = 0.345, p < 0.001). In addition, the model scores showed that the model was able to distinguish the serum lipid profile at week 48. TG levels at week 48 in people living with HIV were significantly higher in the high-risk group than in the low-risk group (1.96 ± 1.49 versus 1.34 ± 0.96, respectively; p < 0.001)—likewise, in the values observed for CHOL level at week 48 (4.80 ± 0.89 versus 4.24 ± 0.79, respectively; p < 0.001) and LDL-C level at week 48 (2.98 ± 0.81 versus 2.60 ± 0.62, respectively; p < 0.001) (Figure 2).

(a) Scatter plot of TG level and model score (r = 0.351, p < 0.001). (b) Scatter plot of CHOL level and model score (r = 0.398, p < 0.001). (c) Scatter plot of LDL-C level and model score (r = 0.345, p < 0.001). (d) TG level (mmol/L) are divided into the low-risk or high-risk group according to model score (p < 0.001). (e) CHOL levels (mmol/L) are divided into the low-risk or high-risk group according to model score (p < 0.001). (f) LDL-C levels (mmol/L) are divided into the low-risk or high-risk group according to model score (p < 0.001).
A multivariable analysis was conducted and the results showed that age (OR = 0.934, p = 0.038) and model score (OR = 2.674, p = 0.001) were the only two independent risk factors associated with hyperlipidemia after 48 weeks’ ART (Table 3). When the model was used to predict hyperlipidemia with a cutoff value of −2.90, its sensitivity and specificity were 86.7% and 24.8%, respectively. When the model was used to predict hyperlipidemia with a cutoff value of -1.35, its sensitivity and specificity were 73.3% and 77.4%, respectively.
Univariate and multivariate analysis for hyperlipidemia after 48 weeks’ ART.

ALB, albumin; ALT, alanine aminotransferase; ART, antiretroviral therapy; CHOL, cholesterol; CI, confidence interval; HGB, hemoglobin; LDL, low-density lipoprotein; OR, odds ratio; PLT, platelet; TG, triglycerides; WBC, white blood cell.
Performance of model to predict liver steatosis after 48 weeks’ ART
We next investigated the feasibility of the model score to predict liver steatosis. A significantly positive correlation was found between CAP value and model score (r = 0.230, p < 0.001). Different proportions of distribution in the four stages of liver steatosis were also observed (Low-risk group, S0/S1/S2/S3%, 84.9/9.9/2.3/2.9; High-risk group, 70.9/14.5/4.3/10.3; p = 0.017) (Figure 3). When the model was used to predict liver steatosis with a cutoff value of −2.90, its sensitivity and specificity was 90.0% and 27.9%. When the model was used to predict liver steatosis with a cutoff value of −1.35, its sensitivity and specificity were 35.0% and 77.3%, respectively.

(a) Scatter plot of CAP value and model score (r = 0.230, p < 0.001). (b) Proportions of people living with HIV with different liver steatosis stages of severity in the low-risk and high-risk groups (p = 0.017).
Discussion
In this study, we included 290 people living with HIV who had received 1-year-long ART treatment. The demographic and clinical data were documented and analyzed. All 290 people living with HIV were stratified into two groups according to whether their BMI index was <24 or ⩾24 at week 48. We found that the high BMI group included people living with HIV who were older than those in the control group and had a higher proportion of male people living with HIV. The high BMI group had a larger percentage of people living with HIV receiving integrase strand transfer inhibitor (INSTI)-based treatment than the control group. The similar results were reported in early studies. INSTI- and protease inhibitor–based first-line ARTs are associated with greater weight gain compared with non-nucleoside reverse transcriptase inhibitor (NNRTI)-based ART. 16 In our study, we also found that high BMI group’s average ALT level was higher than the others in the control group. Similarly, all three serum lipid levels documented in the high BMI group were also higher than those in the control group. In view of these findings, we established a model with which the people living with HIV could be stratified into risk stages of developing high BMI, hyperlipidemia, and liver steatosis.
Body weight changes frequently among people living with HIV. 17 Moreover, study indicated that 22% of people living with HIV with normal BMI became high BMI and 18% of high BMI individuals became obese within 3 years after ART. 18 The underlying mechanism here is various. Another study reported that CD4 count <100 cells/µL, hemoglobin < 12 g/dl, and use of protease inhibitor–based regimen were factors that promoted weight change, and age ⩾ 50 years, female sex, and black race were negative factors for weight change. 19 Because people living with HIV in our study were all Asian, we were unable to verify differences in the proportion of high BMI across ethnic groups. However, according to our results, we confirmed that age is a risk factors associated with high BMI after ART treatment. We further constructed an easy-to-use model to detect high BMI, hyperlipidemia, and liver steatosis after ART treatment in people living with HIV without risk factors for BMI changing at baseline.
People living with HIV with high BMI may promote the development of metabolic syndrome and cardiovascular events, which can lead to a poor prognosis. Gelpi reported that living with HIV is an independent risk factor for abdominal obesity, elevated LDL-C, and hypertriglyceridemia. 20 Lemoine et al. use Fibroscan to assess people living with HIV and evaluate the extent of their liver fibrosis. The study indicated that 25.1% of people living with HIV with metabolic syndrome had significant fibrosis, and 8.4% had suspected cirrhosis. 21 However, the specific immune-pathogenic mechanisms remain unknown.
Living with HIV can have an impact on immune system. Body weight change over a short period may predict a poor clinical outcome.18,22 It especially occurs under the circumstance of a falling BMI. A study showed that low BMI and falling BMI were independently associated with greater risk of developing TB among people living with HIV with CD4 counts of
Hyperlipidemia and liver steatosis are common among people living with HIV especially with high BMI.24–28 It generally takes biochemical markers detections, ultrasonography, and MR-based detection to diagnose hyperlipidemia and nonalcoholic fatty liver disease (NAFLD), which may result in a certain economic burden. Considering the high incidence of NAFLD and hyperlipidemia among people living with HIV, there is a demand for a simple and efficient diagnostic method that is capable of predicting disease(s). Here we established a model including five significant factors extracted from baseline characteristics and showed great superiority in diagnosing and staging hyperlipidemia and high BMI. There is significant linear correlation between CAP value and model score, which shows a potential to diagnose liver steatosis. The model may assist with early detection and early intervention of hyperlipidemia and high BMI. It could also stratify high BMI and hyperlipidemia into different risk stages. By screening high-risk groups, the medical economic burden can be effectively reduced. This study had some limitations. First, it is a retrospective and single-center study which may affect the stability of the model. Second, the relatively small sample size increases the systematic bias. These limitations could be lessened in subsequent studies.
Conclusion
In our study, we found that the high BMI people living with HIV after ART treatment were significantly different in demographic characteristics, such as age, gender, and ART regimens. Hence, we constructed a model to predict high BMI after ART treatment. For the people living with HIV without risk factors associated with BMI changing, our model can be effectively and efficiently used to predict the occurrence of high BMI, hyperlipidemia, and liver steatosis after ART treatment and to stratify these diseases into different stages of severity.
Supplemental Material
sj-doc-1-taj-10.1177_20406223221102750 – Supplemental material for A model for predicting high BMI of people living with HIV after receiving antiretroviral therapy
Supplemental material, sj-doc-1-taj-10.1177_20406223221102750 for A model for predicting high BMI of people living with HIV after receiving antiretroviral therapy by Zhe Qian, Houji Wu, Yihua Wu, Wei Liao, Tao Yu, Xuwen Xu, Jie Peng and Shaohang Cai in Therapeutic Advances in Chronic Disease
Footnotes
Acknowledgements
We thank our colleagues in the Department of Infectious Diseases of Nanfang Hospital for their help.
Ethics approval and consent to participate
This retrospective study was approved by the Ethics Committee of Nanfang Hospital, Southern Medical University, and written consent was obtained from all participants. The ethic number: NFEC-2021-448.
Consent for publication
None
Author contributions
Availability of data and material
The data used in the current study are available from the corresponding author upon reasonable request.
Funding
The authors disclosed receipt of the following financial support for the research, authorship, and/or publication of this article: This study was supported by grants from the Clinical Research Startup Program of Southern Medical University by High-level University Construction Funding of Guangdong Provincial Department of Education (No. LC2016PY003) and scientific research project of Guangdong Provincial Administration of Traditional Chinese Medicine (No. 20211088). The funding sources did not have any influence on the study design, data collection, analysis and interpretation of the data, writing of the manuscript, or decision to submit for publication.
Conflict of interest statement
The authors declared no potential conflicts of interest with respect to the research, authorship, and/or publication of this article.
Supplemental material
Supplemental material for this article is available online.
References
Supplementary Material
Please find the following supplemental material available below.
For Open Access articles published under a Creative Commons License, all supplemental material carries the same license as the article it is associated with.
For non-Open Access articles published, all supplemental material carries a non-exclusive license, and permission requests for re-use of supplemental material or any part of supplemental material shall be sent directly to the copyright owner as specified in the copyright notice associated with the article.