
Abstract
Background:
The consistency in steatosis grading between magnetic resonance imaging-based proton density fat fraction (MRI-PDFF) and controlled attenuation parameter (CAP) before and after treatment remains unclear. This study aimed to compare the diagnostic accuracy of steatosis grading between MRI-PDFF and CAP using liver biopsy as standard and to evaluate the value of monitoring changes in steatosis grading with CAP during follow-up utilizing MRI-PDFF as a reference.
Methods:
Consecutive patients from a biopsy cohort and a randomized controlled trial were included in this study and classified into 3 groups (the biopsy, orlistat treatment, and routine treatment subgroups). Hepatic steatosis was measured via MRI-PDFF and CAP at baseline and at the 6th month; the accuracy and cutoffs were assessed in the liver biopsy cohort at baseline.
Results:
A total of 209 consecutive patients were enrolled. MRI-PDFF and CAP showed comparable diagnostic accuracy for detecting pathological steatosis [⩾S1, area under the receiver operating characteristic curve (AUC) = 0.984 and 0.972, respectively]; in contrast, CAP presented significantly lower AUCs in grades S2–3 and S3 (0.820 and 0.815, respectively). The CAP values correlated well with the MRI-PDFF values at baseline and at the 6th month (r = 0.809 and 0.762, respectively, both p < 0.001), whereas a moderate correlation in their changes (r = 0.612 and 0.524 for moderate-severe and mild steatosis, respectively; both p < 0.001) was observed. The AUC of CAP change was obtained to predict MRI-PDFF changes of ⩾5% and ⩾10% (0.685 and 0.704, p < 0.001 and p = 0.001, respectively). The diagnostic agreement of steatosis grade changes between MRI-PDFF and CAP was weak (κ = 0.181, p = 0.001).
Conclusions:
CAP has decreased value for the initial screening of moderate-severe steatosis and is limited in monitoring changes in steatosis during treatment. The confirmation of steatosis grading with MRI-PDFF remains necessary.
Keywords
Introduction
Metabolic associated fatty liver disease (MAFLD) has emerged as the most predominant cause of chronic liver disease. 1 Liver biopsy is the gold standard for the diagnosis of MAFLD. However, liver biopsy has several limitations, such as invasiveness and sampling variability, 2 which make it impractical to evaluate and monitor MAFLD severity among all patients. Therefore, accurate noninvasive assessment methods are urgently needed in clinical practice to evaluate the severity and treatment efficacy of MAFLD.
Magnetic resonance imaging-based proton density fat fraction (MRI-PDFF) has been used to conduct quantitative and accurate assessments of liver fat content (LFC). 3 A robust correlation with a Spearman rank correlation coefficient greater than 0.9 was demonstrated among MRI-PDFF, histology-proven steatosis grading and proton magnetic resonance spectroscopy ( 1 HMRS). 4 Moreover, MRI-PDFF can evaluate LFC the whole liver, avoiding the sample error of biopsy and 1HMRS. 5 Furthermore, MRI-PDFF is more sensitive to longitudinal changes in steatosis than biopsy and possesses a higher rate of successful detection than 1HMRS.5,6 Therefore, MRI-PDFF has been regarded as an alternative method to histological assessment in steatosis grading.
The controlled attenuation parameter (CAP) has been used as another noninvasive steatosis marker. Several studies have demonstrated that CAP was significantly correlated with histological steatosis grading in MAFLD patients.7,8 However, the cutoff value for diagnosing steatosis grades (S0–S3) varies greatly among different studies.9 –12 Several studies reported that CAP correlated with LFC determined by MRI-PDFF in MAFLD cross-sectional and longitudinal settings.12,13 However, an obvious change in CAP may still remain on the categorical scale of steatosis grading. The steatosis grading consistency among CAP and MRI-PDFF remains limited. As the degree of LFC is highly associated with the development of diabetes and cardiovascular disease (CVD), the accuracy of steatosis grading is of particular clinical importance for the prognosis prediction and efficacy evaluation of MAFLD patients.13,14
The aim of this study was to compare the diagnostic accuracy to detect and grade steatosis using liver biopsy as a standard between MRI-PDFF and CAP. Furthermore, using the follow-up data from the biopsy samples and a clinical trial for assessing orlistat therapy in MAFLD, we used MRI-PDFF as a reference to evaluate the value of monitoring steatosis grading through the change in CAP values during follow-up among MAFLD patients and to explore the consistency between MRI-PDFF and CAP, and relative factors.
Patients and methods
Study design and population
This was a prospective cohort study conducted at the First Affiliated Hospital, Sun Yat-Sen University. The study design included two parts. The first part utilized a cross-sectional analysis to assess the accuracy of steatosis grading between CAP and MRI-PDFF with liver histology results as reference; in contrast, the second part aimed to evaluate the concordance of measurement changes in these two methods during NAFLD treatment. The study protocol was approved by the Institutional Ethics Committee for Clinical Research and Animal Trials of the First Affiliated Hospital, Sun Yat-Sen University [Approval number: (2014) No. 112] and was performed in accordance with the ethical standards. All patients provided written informed consent.
The study participants were derived from two consecutive prospective cohorts with both CAP and MRI-PDFF measurements. The first cohort included patients who were older than 18 years old and underwent liver biopsy for the evaluation of MAFLD between January 2016 and September 2020, most of whom participated in an ongoing clinical study registered in the Chinese Clinical Trial Registry (ChiCTR-OOC-16007902, websites: http://www.chictr.org.cn/showprojen.aspx? proj = 13350) evaluating the association between biopsy-proven NASH/fibrosis and metabolism. 15 The main indications for liver biopsy were the assessment of suspected MAFLD after positive ultrasonography screening. The second cohort was derived from another prospective, open-label, monocentric, randomized controlled trial registered in the Chinese Clinical Trial Registry (ChiCTR-IPR-17012258) aimed at evaluating the efficacy of orlistat with MRI-PDFF assessments between August 2017 and August 2020. 16 There was no overlap between the two cohorts. The diagnosis of MAFLD is based on the detection of liver steatosis together with the presence of at least one of three criteria that includes overweight or obesity, type 2 diabetes mellitus (T2DM) or clinical evidence of metabolic dysfunction. 17 Patients with any of the following were excluded: daily alcohol consumption (⩾10 g in women and ⩾20 g in men); positive hepatitis B surface antigen or antibody against hepatitis C virus; autoimmune liver disease; pregnancy; endocrine disorders (e.g., hypothyroidism); competing etiologies of liver disease resulting in steatosis (e.g., consumption of tamoxifen); malignancies.
To the best of our knowledge, there is no widely established cutoff value of MRI-PDFF to evaluate the monitoring value of CAP. Some patients may have a decrease in MRI-PDFF value or CAP value but still remain in the same grade (categorical scale). Previous clinical trials of NAFLD treatment and meta-analysis have accepted cutoff values of >5%, >10%, and >16.37~23.3% with MRI-PDFF for discriminating mild, moderate, and severe steatosis degrees.18 –21 The difference between the three cutoff values is approximately 5% and 10%. Therefore, we further estimated the predictive value of CAP change for MRI-PDFF changes ⩾5% and ⩾10%, which may indicate steatosis grade changes.
Clinical assessment
Patients were required to complete a standardized questionnaire about alcohol consumption, smoking, past medical history, and family history. Anthropometric indexes were obtained by specialized doctors. Venous blood was drawn to document the liver biochemistry, lipids, glucose, insulin, and uric acid after fasting overnight. The homeostasis model of assessment for insulin resistance (HOMA-IR) was defined as [fasting blood glucose(mmol/l) × fasting blood insulin (μU/ml)]/22.5. 22
Histological assessment
Liver biopsy was performed in the right hepatic lobe under the ultrasound guidance using 18G Temno needles and avoiding major blood vessels and intrahepatic ducts. Two passes of liver specimens were attained for each patient to get the samples with at least 15 mm in length. The histological characteristics were evaluated and scored via the NASH clinical research network system. Discriminating normal control, mild, moderate, and severe steatosis was defined by the presence of steatosis in <5% (S0), ⩾5% (S1), ⩾33.3% (S2), and ⩾66.7% (S3) of hepatocytes according to histological analysis [Supplemental Figure 1(a), (d), (g), (j)]. Fibrosis was graded using the Kleiner Fibrosis Score (F0–F4).23,24 Two fixed pathologists with over 10 years of experience were blinded to all the clinical data and reviewed the liver specimens separately. There were 6 cases of scoring inconsistency; therefore, a third pathologist participated in the discussion to achieve a final consensus.
MRI quantification of liver fat content
MRI-PDFF was utilized to quantify the LFC with an irregularly shaped region of interest (ROI) covering the entire liver in twenty-one consecutive slices (max-area centered) from patients placed by two radiologists. The radiologists reported the MRI-PDFF independently of each other and were blinded to all the clinical data. 25 Upper-abdominal MRI with a 3.0-Tesla MRI scanner (Siemens 3.0T MAGNETOM Verio) was performed at baseline and at the sixth month. MRI-PDFF maps were also attained by placing circular ROIs with diameter of 20 mm centrally in each of the eight liver segments. The liver fat-water separation images were obtained via a T1 volumetric interpolated breath-hold examination IDEAL-IQ/Dixon sequence with the same scanning protocol and imaging parameter settings as presented in our previous study. 25 Briefly, TE1 2.5 ms, TE2 3.7 ms, 5.47 ms for repetition, 5° flip angle, ±504.0 kHz per pixel receiver bandwidth, and a slice thickness of 3.0 mm. While the fat-water separation images were acquired, data for LFC were further analyzed [Supplemental Figure 1(b), (e), (h), (k)].
CAP measurement and liver stiffness measurement
Within the same day of MRI-PDFF assessments, CAP, and transient elastography based liver stiffness measurements were conducted via FibroScan system (FibroScan-402, Echosens, France) with either an M- or an XL-probe, according to the instructions and training offered by the manufacturer and similar studies. 26 Patients were placed in a supine position with the right arm elevated above the head and extended to the maximum. The measurements were performed on the right lobe of the liver in a intercostal position according to established protocols. The measurement was done blinded to clinical data. The results were adoptable only if a success rate of >60% and ⩾10 eligible acquisitions were attained, with an interquartile range (IQR)-to-median ratio <0.2 for TE and IQR value of less than 40 for CAP [Supplemental Figure 1(c), (f), (i), (l)].26,27 Given that a lack of uniform reference values has been reported, 28 the cutoff value of CAP was chosen for discriminating no steatosis, mild, moderate, and severe steatosis according to the ROC analysis results in the present study using data from biopsy-proven MAFLD patients in our center. Furthermore, a pilot study involving 50 MAFLD patients in our center before the present study was conducted to estimate the reproducibility and repeatability of CAP between the two fixed physicians. The median interval of CAP measurement in the pilot study between two visits was 4 days (IQR 3–7 days). For the within-session intra- and interobserver repeatability, the intraclass correlation coefficients were 0.94 and 0.87, respectively (Supplemental Tables 1 and 2, Supplemental Figure 2).
Treatment and follow-up
The subjects with biopsy received nutrition intake and exercise training instructions. For patients without biopsy who were recruited from the orlistat therapy clinical trial, the allocation and intervention have been described in detail in the published article. 29 In brief, using a predefined computer-generated number with a 1:1.5 allocation, the patients were divided into an orlistat group and a routine treatment group, and the therapy regimen was open label. The orlistat group received orlistat (120 mg, three times daily) without additional treatment. For the routine treatment group, an easy-to-carry brochure with personalized exercise and dietary prescriptions was provided. All patients received another MRI-PDFF and CAP estimation at the 6th month. Patients from the first cohort received treatment similar to that of the routine treatment group in the second cohort. To evaluate the monitoring value of CAP in hepatic steatosis using MRI-PDFF as a reference, 57 biopsy-proven patients with baseline and sixth-month MRI-PDFF and CAP results were enrolled for further analysis and all of them received guidance on lifestyle modifications. As in the clinical settings during the follow-up, it may happen that two measurement methods presented the same steatosis degree changes, although they may acquire different steatosis degree results at baseline, and in this case the changes of CAP may remain well correlated with that of MRI-PDFF. However, it would not be appropriate to consider CAP was accurate or valuable in monitoring disease progression in this case. Therefore, to present the more accurate correlation between CAP and MRI-PDFF in the follow-up, a second estimation of consistency between CAP and MRI-PDFF values at the sixth month was obtained exclusively for those patients with accurate grading by two methods at baseline.
Sample size calculation
According to the previous studies evaluating the diagnostic accuracy of MRI-PDFF and CAP using histology as standard, the AUCs of MRI-PDFF were 0.99, 0.90, and 0.92 for ⩾S1, ⩾S2, and S3, respectively, and the AUCs of CAP were 0.87, 0.77, and 0.70 for ⩾S1, ⩾S2, and S3, respectively. 29,30 With these settings calculated by the PASS software (NCSS, Kaysville, USA), the estimated sample size needed to be at least 7, 32, 26, and 13 for S0, S1, S2, and S3, respectively, to achieve a power of 80% with an alpha of 0.05.
Statistical analysis
All statistical calculations were performed with SPSS software (version 25.0, IBM, Chicago, USA). The results are expressed as the mean ± the standard deviation (SD). Values that were not normally distributed were expressed as the median with IQRs. One-way analysis of variance and the Kruskal–Wallis test were used to compare continuous variables. Categorical variables were compared via chi-squared test. ROC analysis was conducted to evaluate the diagnostic accuracy of steatosis with MRI-PDFF and CAP. Comparisons between the AUCs were performed with DeLong test. The correlations between CAP values and steatosis as determined by MRI-PDFF were analyzed with Pearson’s correlation. A consistency test of Cohen’s kappa was utilized to estimate the consistency between CAP and MRI-PDFF. Factors associated with the consistency in steatosis stage changes were explored via logistic regression analysis. Linear regression analysis was conducted to identify the factors that influenced MRI-PDFF. A two-tailed p-value of <0.05 was considered statistically significant.
Results
Clinical characteristics of patients at baseline
The flow of patients in the present study is shown in STARD diagrams (Figure 1). No adverse events from performing the biopsy, MRI-PDFF, or CAP occurred in the present study. A total of 209 patients were enrolled in this study, among whom 102 patients were assigned to the biopsy cohort and 107 patients were assigned to the orlistat and routine treatment cohort. The clinical characteristics of all the patients are presented in Table 1. No significant difference was found among the three groups in sex, age, or anthropometric or metabolic indexes at baseline. Similarly, steatosis measured via MRI-PDFF and CAP, and liver stiffness were comparable among the three groups.

STARD diagrams to show the flow of patients in the present study. The cutoff values we used here was derived from the first part of the present study “Diagnostic accuracy in steatosis grade using histology as a standard” and presented as 244 dB/m, 265 dB/m, and 292 dB/m for S0/1, S1/2, and S2/3 of CAP, and 5%, 14.6%, and 24.3% for S0/1, S1/2, and S2/3 of MRI-PDFF.
Summary of baseline clinical characteristics.

Continuous variables are expressed as median with IQR for non-Gaussian distribution.
BMI, body mass index; CAP, controlled attenuation parameter; HDL-C, high-density lipoprotein-cholesterol; HOMA-IR, homeostasis model assessment of insulin resistance; LDL-Cl, low-density lipoprotein-cholesterol; LSM, liver stiffness measurement; MRI-PDFF, magnetic resonance imaging-based proton density fat fraction.
Diagnostic accuracy in steatosis grade using histology as a standard
The reproducibility and repeatability of CAP, MRI-PDFF, and histology and the clinical characteristics of the corresponding pilot study cohorts are presented in Supplemental Tables 1 and 2. The accuracy of MRI-PDFF in the judgment of steatosis of S0 versus S1–3 was comparable with that of CAP, as documented by a similar area under the ROC curve (0.984 versus 0.972, p = 0.49), with cutoff values of 5.5% and 244 dB/m, respectively [Figure 2(a)]. Comparing S0–S1 with S2–S3, the AUC values were 0.956 for MRI-PDFF and 0.820 for CAP, with cutoff values of 14.60% and 265 dB/m, respectively [Figure 2(b)]. Similarly, the AUCs for differentiating S0–S2 from S3 were 0.966 and 0.815, with cutoff values of 24.25% and 292 dB/m for MRI-PDFF and CAP, respectively [Figure 2(c)]. The AUCs of MRI-PDFF were significantly greater than those of CAP (p = 0.003 and 0.006, respectively) in differentiating between ⩾S2 and ⩾S3. Details about diagnostic accuracy, including sensitivity and specificity, are summarized in Supplemental Table 3. We further conducted ROC analysis for diagnostic accuracy of CAP in steatosis grade using MRI-PDFF as a reference. For baseline, CAP attained AUCs of 0.925, 0.846, and 0835 for ⩾S1, ⩾S2, and S3, respectively [all p < 0, Supplemental Figure 3(a)]. Similarly, AUC of CAP were 0.928, 0.875, and 0.848 for ⩾S1, ⩾S2, and S3 at the 6th month [all p < 0, Supplemental Figure 3(b)].

Diagnostic accuracy comparison between MRI-PDFF and CAP using histology as standard in detecting and grading hepatic steatosis: (a) S0 versus S1–3. (b) S0–1 versus S2–3. (c) S0–2 versus S3. ROC of CAP change in predicting MRI-PDFF change ⩾5% and ⩾10% (d) and MRI-PDFF steatosis grade worsening (e) and improvement (f).
Changes in obesity, liver biochemistry, and other metabolic outcomes between baseline and the 6th month
The changes in obesity, liver biochemistry, and other metabolic outcomes are presented in detail in Table 2. The orlistat group achieved the largest BMI change (−1.5 ± 1.4 kg/m2), followed by −1.0 ± 1.8 kg/m2 and −0.5 ± 0.8 kg/m2 in the biopsy group and routine treatment group, respectively (p = 0.005). A similar trend was also demonstrated in WC and MRI-PDFF changes.
Changes of obesity, liver biochemistry, and other metabolic outcomes among biopsy proven MAFLD with therapy and patients with orlistat or routine treatment at the 6th month.

BMI, body mass index; CAP, controlled attenuation parameter; HDL-C, high-density lipoprotein-cholesterol; HOMA-IR, homeostasis model assessment of insulin resistance; LDL-C, low-density lipoprotein-cholesterol; LSM, liver stiffness measurement; MRI-PDFF, magnetic resonance imaging-based proton density fat fraction.
Correlation and grading consistency between MRI-PDFF and CAP values and their changes from baseline to the sixth-month follow-up
The exclusion criteria of biopsy cohort at the 6th month were disagreement in steatosis grade among histology, MRI-PDFF, and CAP at baseline (14 patients) and the lack of a second estimation of CAP or MRI-PDFF (31 patients). For those 14 patients with disagreement in steatosis grade at baseline, 4 of whom also lacked a second estimation of CAP or MRI-PDFF. As shown in Figure 3, MRI-PDFF and CAP showed similar correlations in estimating hepatic steatosis at baseline [r = 0.812, p < 0.001, Figure 3(a)] and at the sixth month [r = 0.762, p < 0.001, Figure 3(b)]. Notably, a second estimation of consistency between CAP and MRI-PDFF values at the sixth month was obtained, exclusively for those patients with accurate grading by two methods at baseline. For the biopsy group, the correlation efficiencies were 0.796 and 0.771 for baseline and the sixth month, respectively [both p < 0.001, Figure 3(d)–(e)]. For routine treatment and orlistat patients, the highest correlation values were obtained at baseline (r = 0.757), followed by r = 0.744 at the 6th month [both p < 0.001, Figure 3(g)–(h)]. We further investigated the correlation between MRI-PDFF change and CAP change between baseline, mild, and moderate-severe steatosis. However, the correlation was greater in moderate-severe MAFLD compared with mild MAFLD [Figure 3(c), (f), (i)]. ROC analysis was used to evaluate the predictive value of CAP in MRI-PDFF changes ⩾5% and ⩾10%, and CAP achieved AUCs of 0.685 (p < 0.001) and 0.704 (p = 0.001) with cutoff values of 16 dB/m and 33 dB/m, respectively [Figure 2(d), Supplemental Table 3].
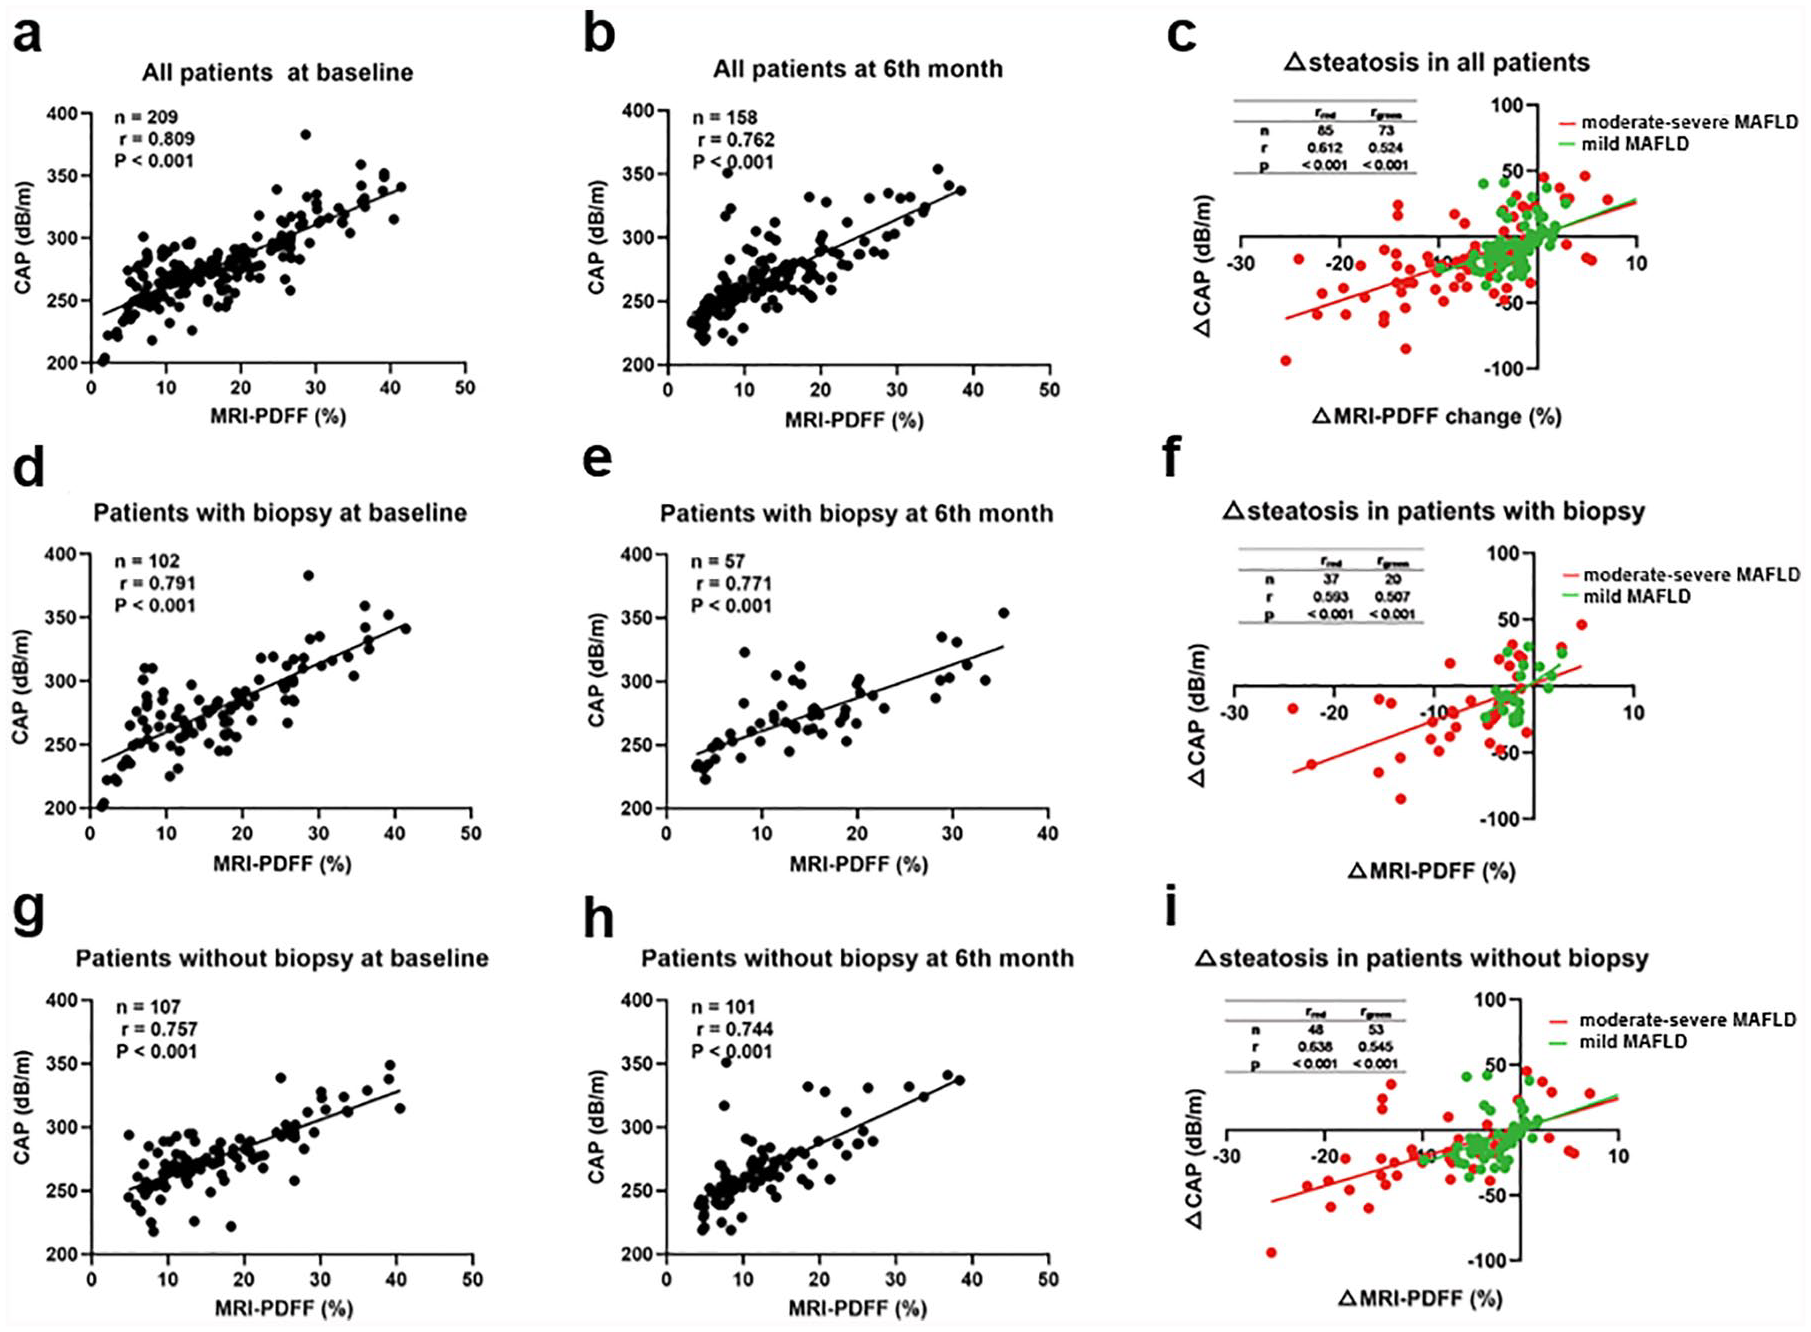
Correlation between MRI-PDFF and CAP. (a) All patients at baseline. (b) All patients at the 6th month. (c) Steatosis changes measured by MRI-PDFF and CAP in all patients. (d) Patients with biopsy at baseline. (e) Patients with biopsy at the 6th month. (f) Steatosis changes measured by MRI-PDFF and CAP in patients with biopsy. (g) Patients without biopsy at baseline. (h) Patients without biopsy at the 6th month. (i) Steatosis changes measured by MRI-PDFF and CAP in patients without biopsy.
Based on the cutoff value obtained above, steatosis was further classified by MRI-PDFF as S1 (5.5–14.5%), S2 (14.6–24.2%), or S3 (⩾24.3%). Using MRI-PDFF-based steatosis grade change as a reference, the CAP attained an AUC of 0.702 (p = 0.003) for predicting steatosis grade worsening and an AUC of 0.717 (p < 0.001) for predicting improvement. In addition, the AUCs in moderate-severe steatosis were greater than those in mild MAFLD for predicting both steatosis grade worsening and improvement [0.721 versus 0.691, 0.738 versus 0.687, Figure 2(e)–(f)]. Furthermore, according to the cutoff value presented above, steatosis was further classified by CAP as S1 (244–264 dB/m), S2 (265–291 dB/m), or S3 (⩾292 dB/m). It should be noted that two patients (1.3%) with an MRI-PDFF difference of greater than 10% remained in the same steatosis grade, whereas nine patients (5.7%) attained an MRI-PDFF change of less than 5%, having one grade increased or decreased. We continued to perform ROC analysis of △CAP for △MRI-PDFF ⩾5% and ⩾10% with AUCs of 0.673 and 0.879 who was remaining in the same steatosis grade at the 6th month (Supplemental Figure 3(c)–(d)].
Cohen’s kappa value for steatosis grade changes defined by MRI-PDFF and CAP was 0.181 [p = 0.001, Figure 4(a)]. Similarly, Cohen’s kappa values of moderate-severe MAFLD and mild MAFLD were 0.327 and 0.003, respectively [Figure 4(b)–(c)].
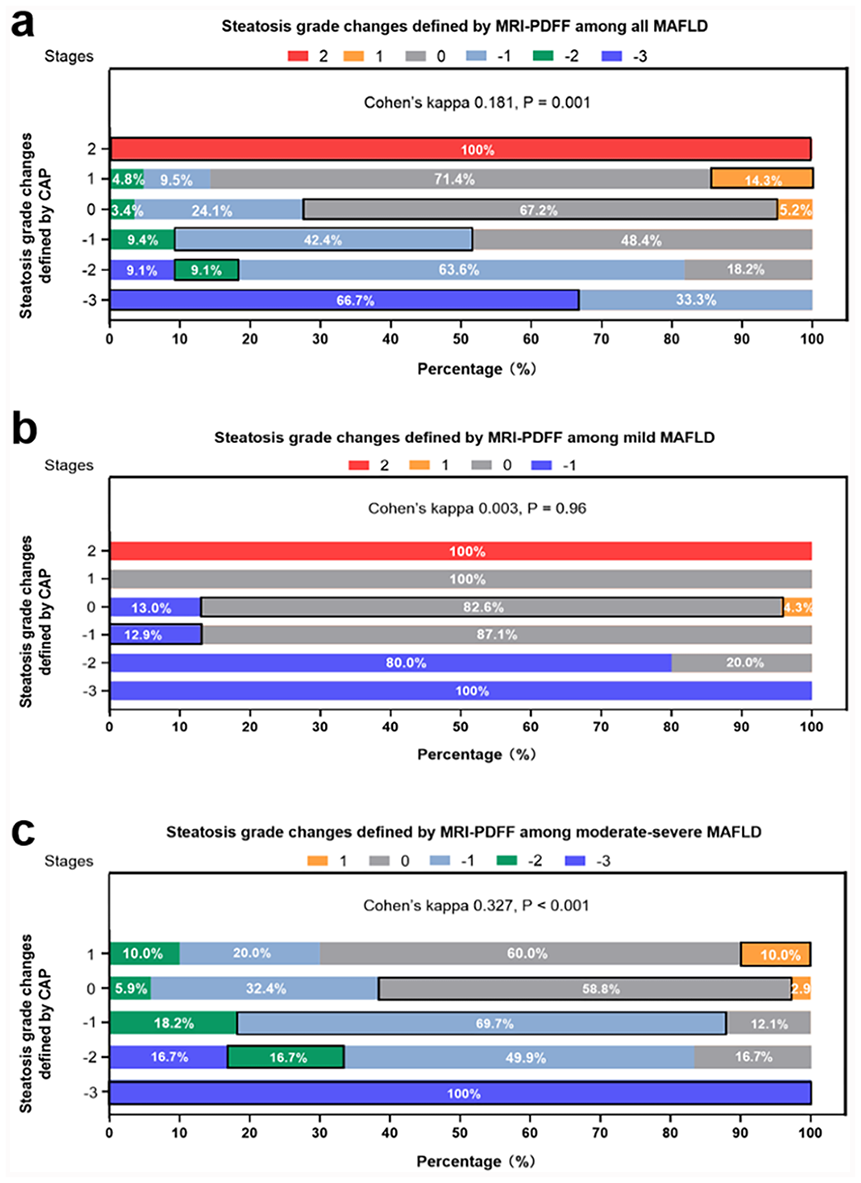
Steatosis grade changes agreement between MRI-PDFF and CAP among all NAFLD patients (a), mild NAFLD patients (b), and moderate-severe NAFLD patients (c), respectively.
Factors associated with steatosis staging agreement between MRI-PDFF and CAP
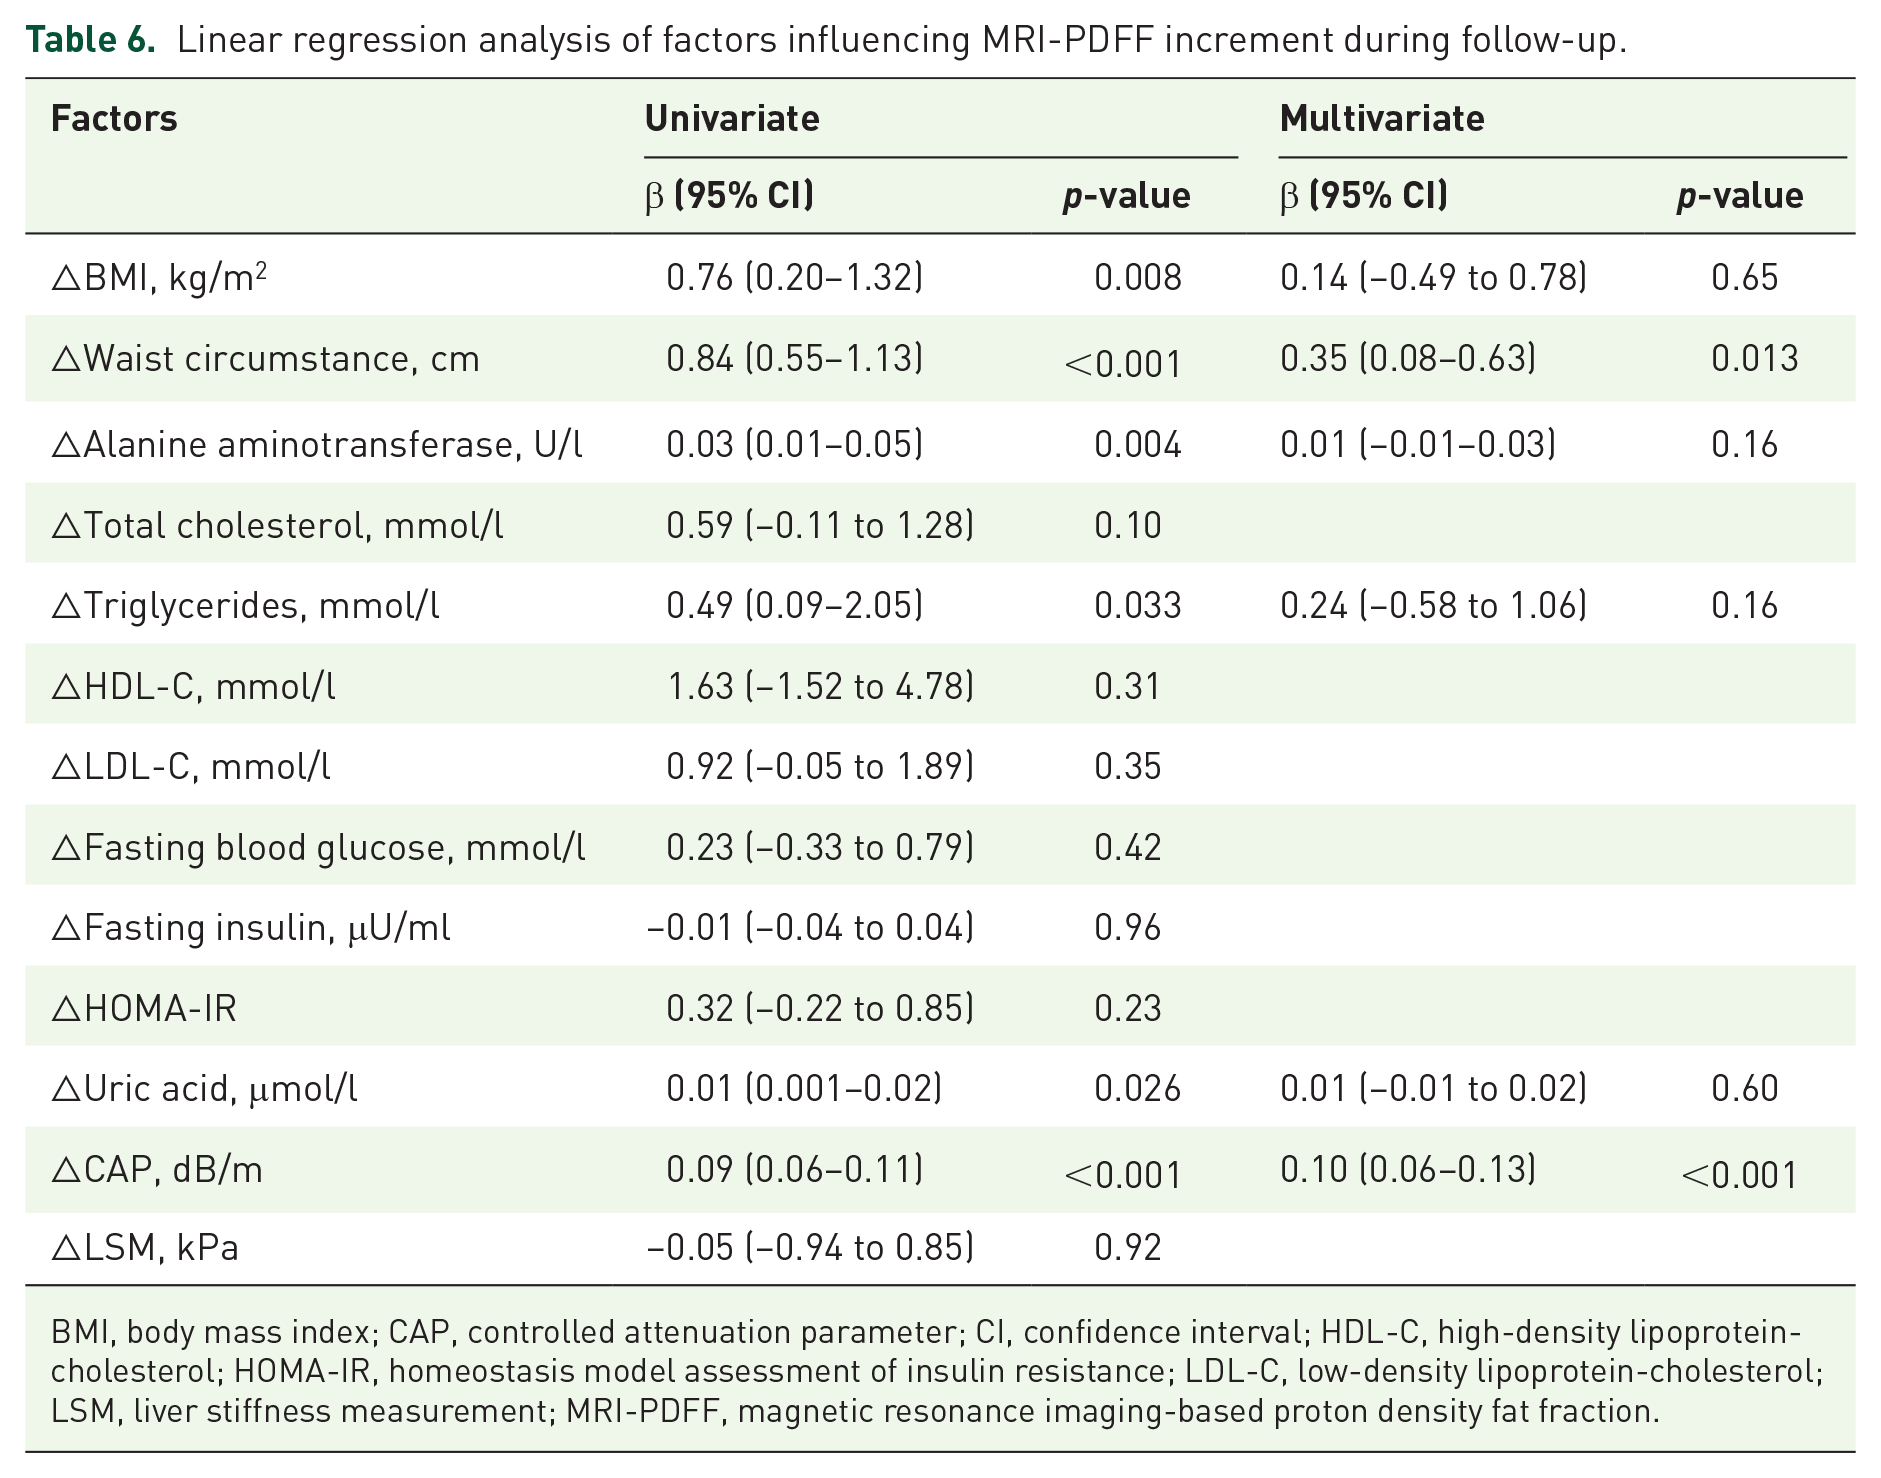
Univariate logistic analysis revealed that steatosis measured by MRI-PDFF per 5% increase at baseline was significantly related to the agreement in steatosis grading among histology, MRI-PDFF and CAP [odd’s ratio (OR) 1.33; 95% confidence interval (CI) 1.02–1.68; p = 0.009) and the agreement between MRI-PDFF and CAP at the 6th month (OR 1.52; 95% CI 1.24–1.86; p = 0.002, Table 3). One factor was identified as significant; therefore, multiple logistics analysis was not conducted. Furthermore, in univariate logistic analysis, steatosis measured by MRI-PDFF per 5% increase at baseline was associated with agreement in steatosis stage changes (OR 1.32; 95% CI: 1.10–1.59; p = 0.003, Table 4). No factor was statistically significant with agreement in steatosis degree improvement or worsening. Univariate linear regression showed that BMI (β coefficient = 0.76, p = 0.011), waist circumstance (WC) (β coefficient = 0.69, p < 0.001), alanine aminotransferase (ALT) (β coefficient = 0.07, p = 0.001), fasting insulin (β coefficient = 0.22, p = 0.02) and controlled attenuation parameter (CAP) (β coefficient = 0.27, p < 0.001) had a significant influence on MRI-PDFF at baseline. Whereas after multivariate liner regression, WC (β coefficient = 0.47, p = 0.047) and CAP (β coefficient = 0.13, p < 0.016) remained significant (Table 5). Similarly, after univariate and multivariate linear regression, WC and CAP had a significant influence on MRI-PDFF at the 6th month (β coefficient = 0.24 and 0.14, p = 0.031 and 0.002, respectively, Table 5). During follow-up, multivariate liner regression analysis revealed that both the changes of WC (β coefficient = 0.35, p = 0.013) and CAP (β coefficient = 0.10, p < 0.001) were identify as significant factors influencing the MRI-PDFF changes (Table 6).
Factors associated with the agreement in steatosis grade among histology, MRI-PDFF, and CAP.

Agreement at baseline between MRI-PDFF and CAP.
One factor was found to be significant; therefore, multiple logistics analysis was not conducted.
BMI, body mass index; CAP, controlled attenuation parameter; CI, confidence interval; HDL-C, high-density lipoprotein-cholesterol; HOMA-IR, homeostasis model assessment of insulin resistance; LDL-C, low-density lipoprotein-cholesterol; LSM, liver stiffness measurement; MRI-PDFF, magnetic resonance imaging-based proton density fat fraction; OR, odd’s ratio.
Factors associated with the agreement in steatosis stage changes between MRI-PDFF and CAP.
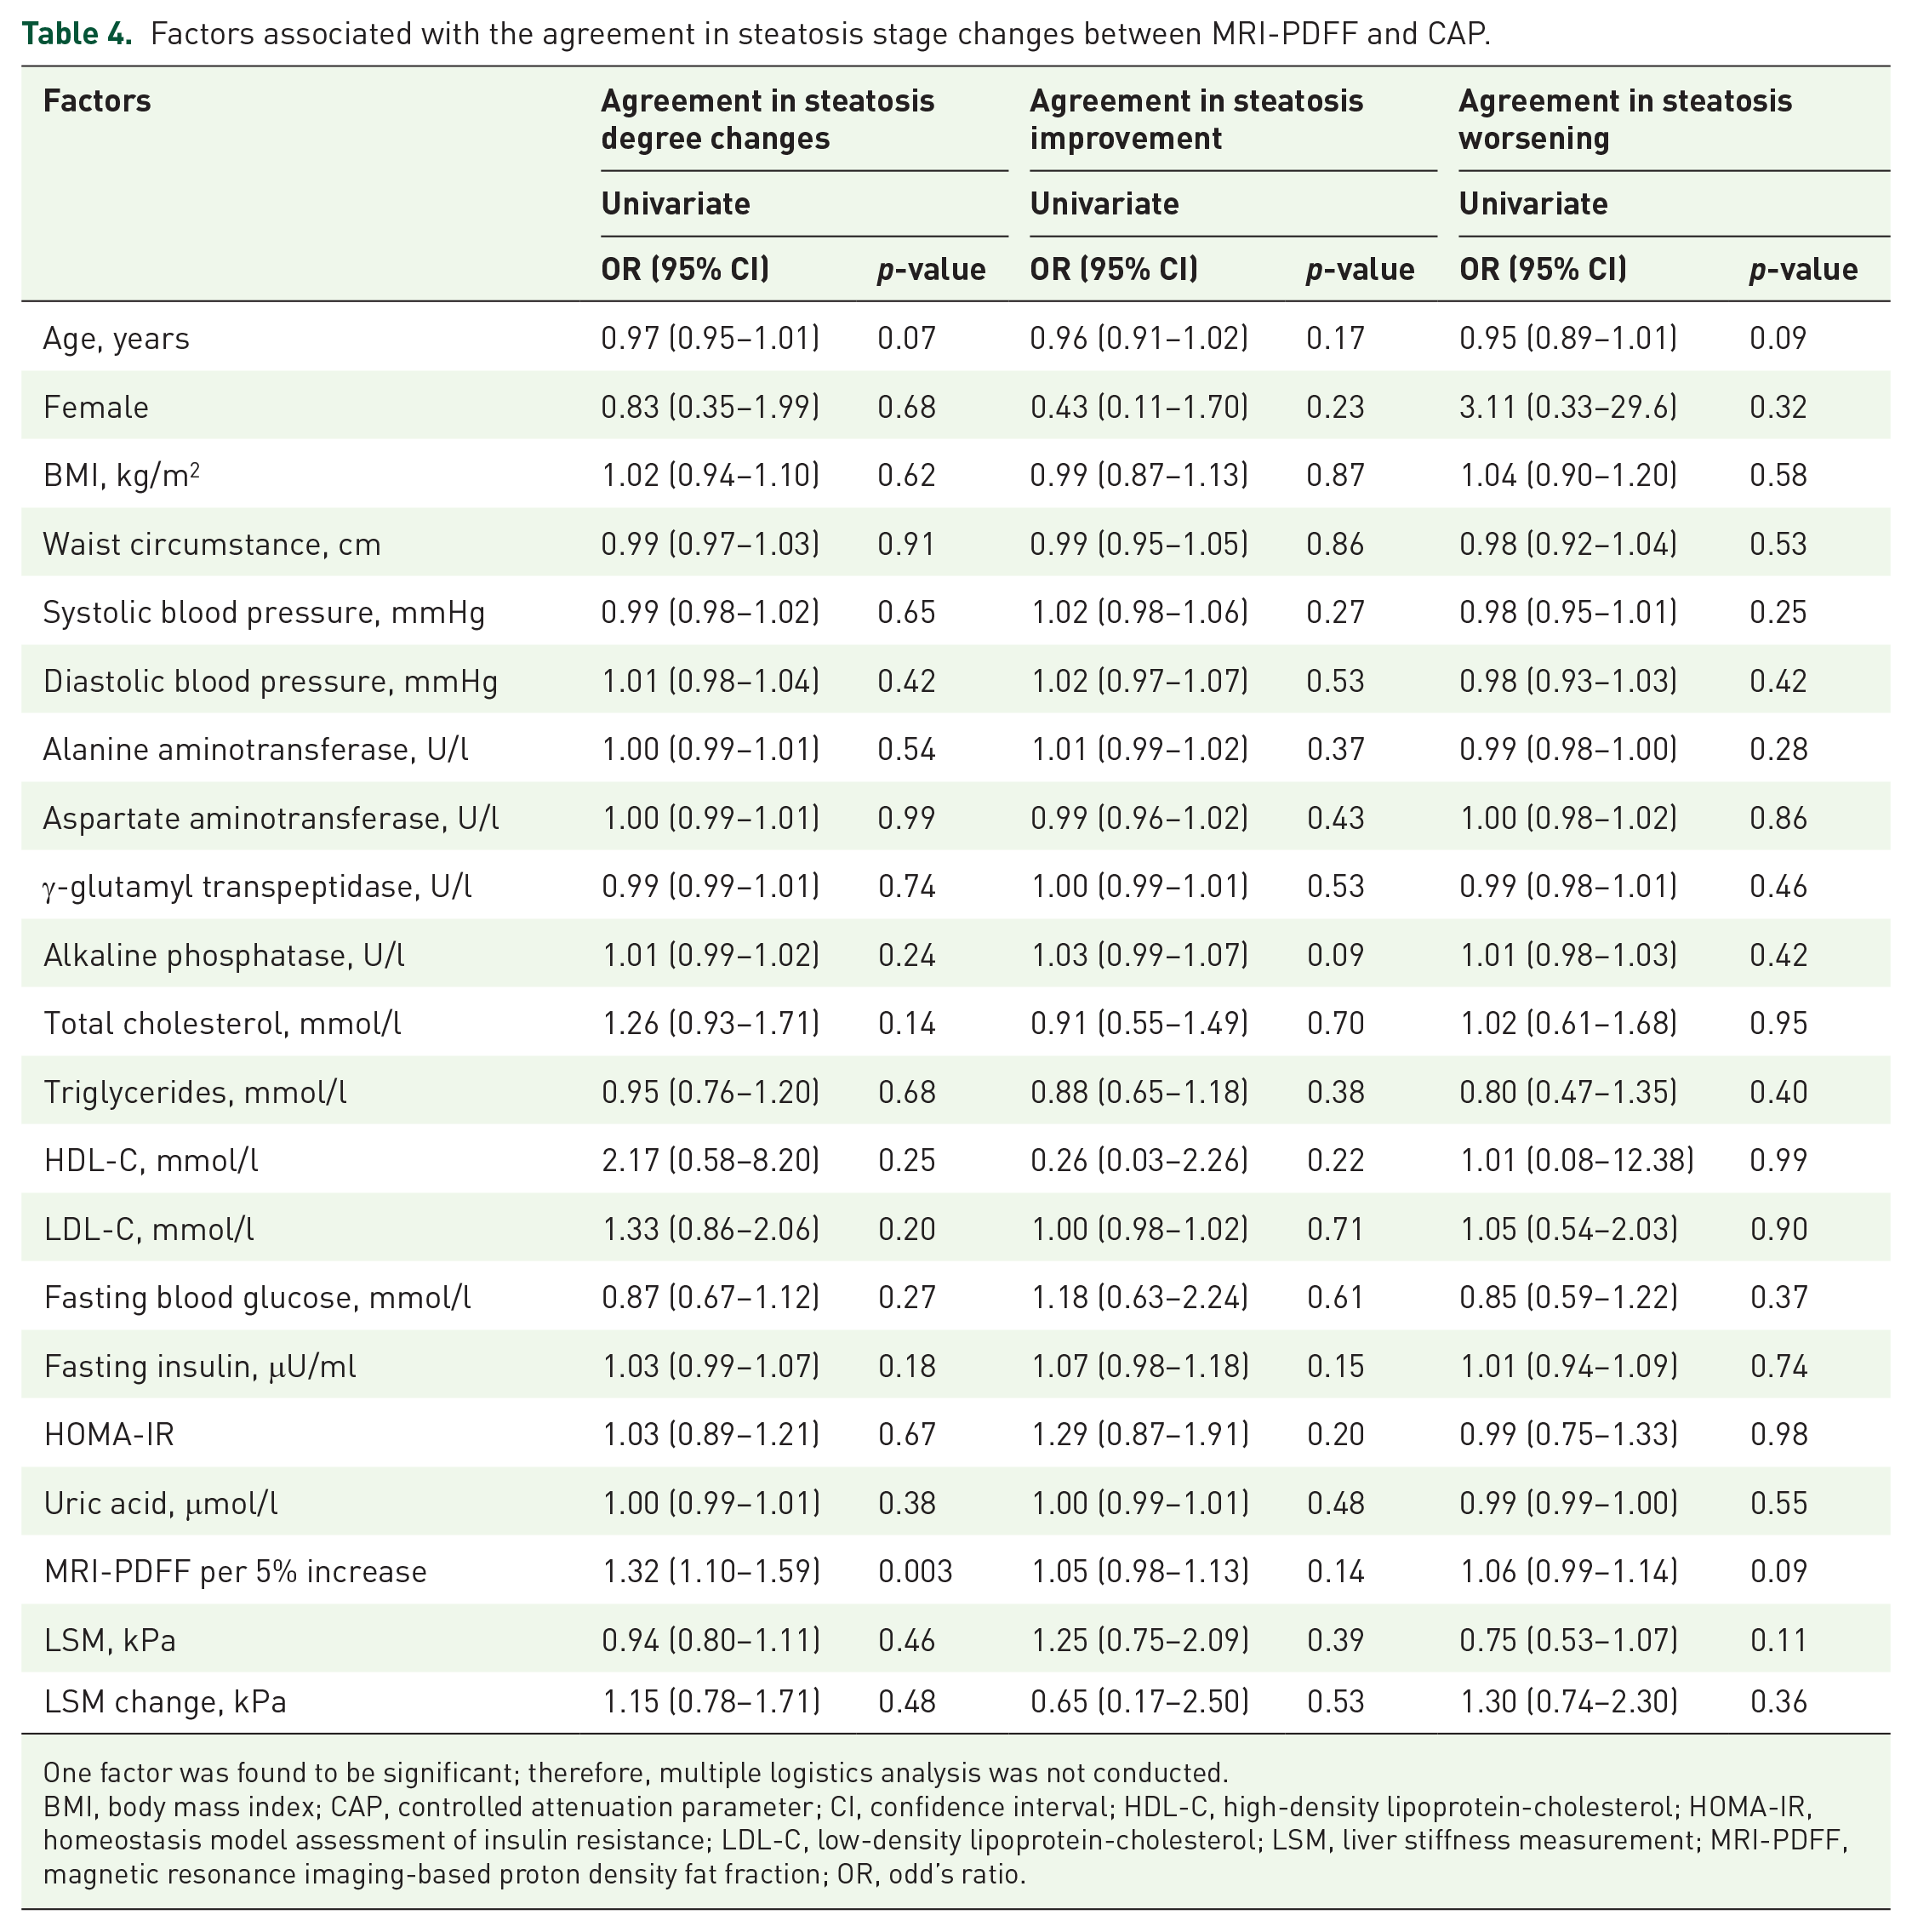
One factor was found to be significant; therefore, multiple logistics analysis was not conducted.
BMI, body mass index; CAP, controlled attenuation parameter; CI, confidence interval; HDL-C, high-density lipoprotein-cholesterol; HOMA-IR, homeostasis model assessment of insulin resistance; LDL-C, low-density lipoprotein-cholesterol; LSM, liver stiffness measurement; MRI-PDFF, magnetic resonance imaging-based proton density fat fraction; OR, odd’s ratio.
Linear regression analysis of factors influencing MRI-PDFF at baseline and at the 6th month.
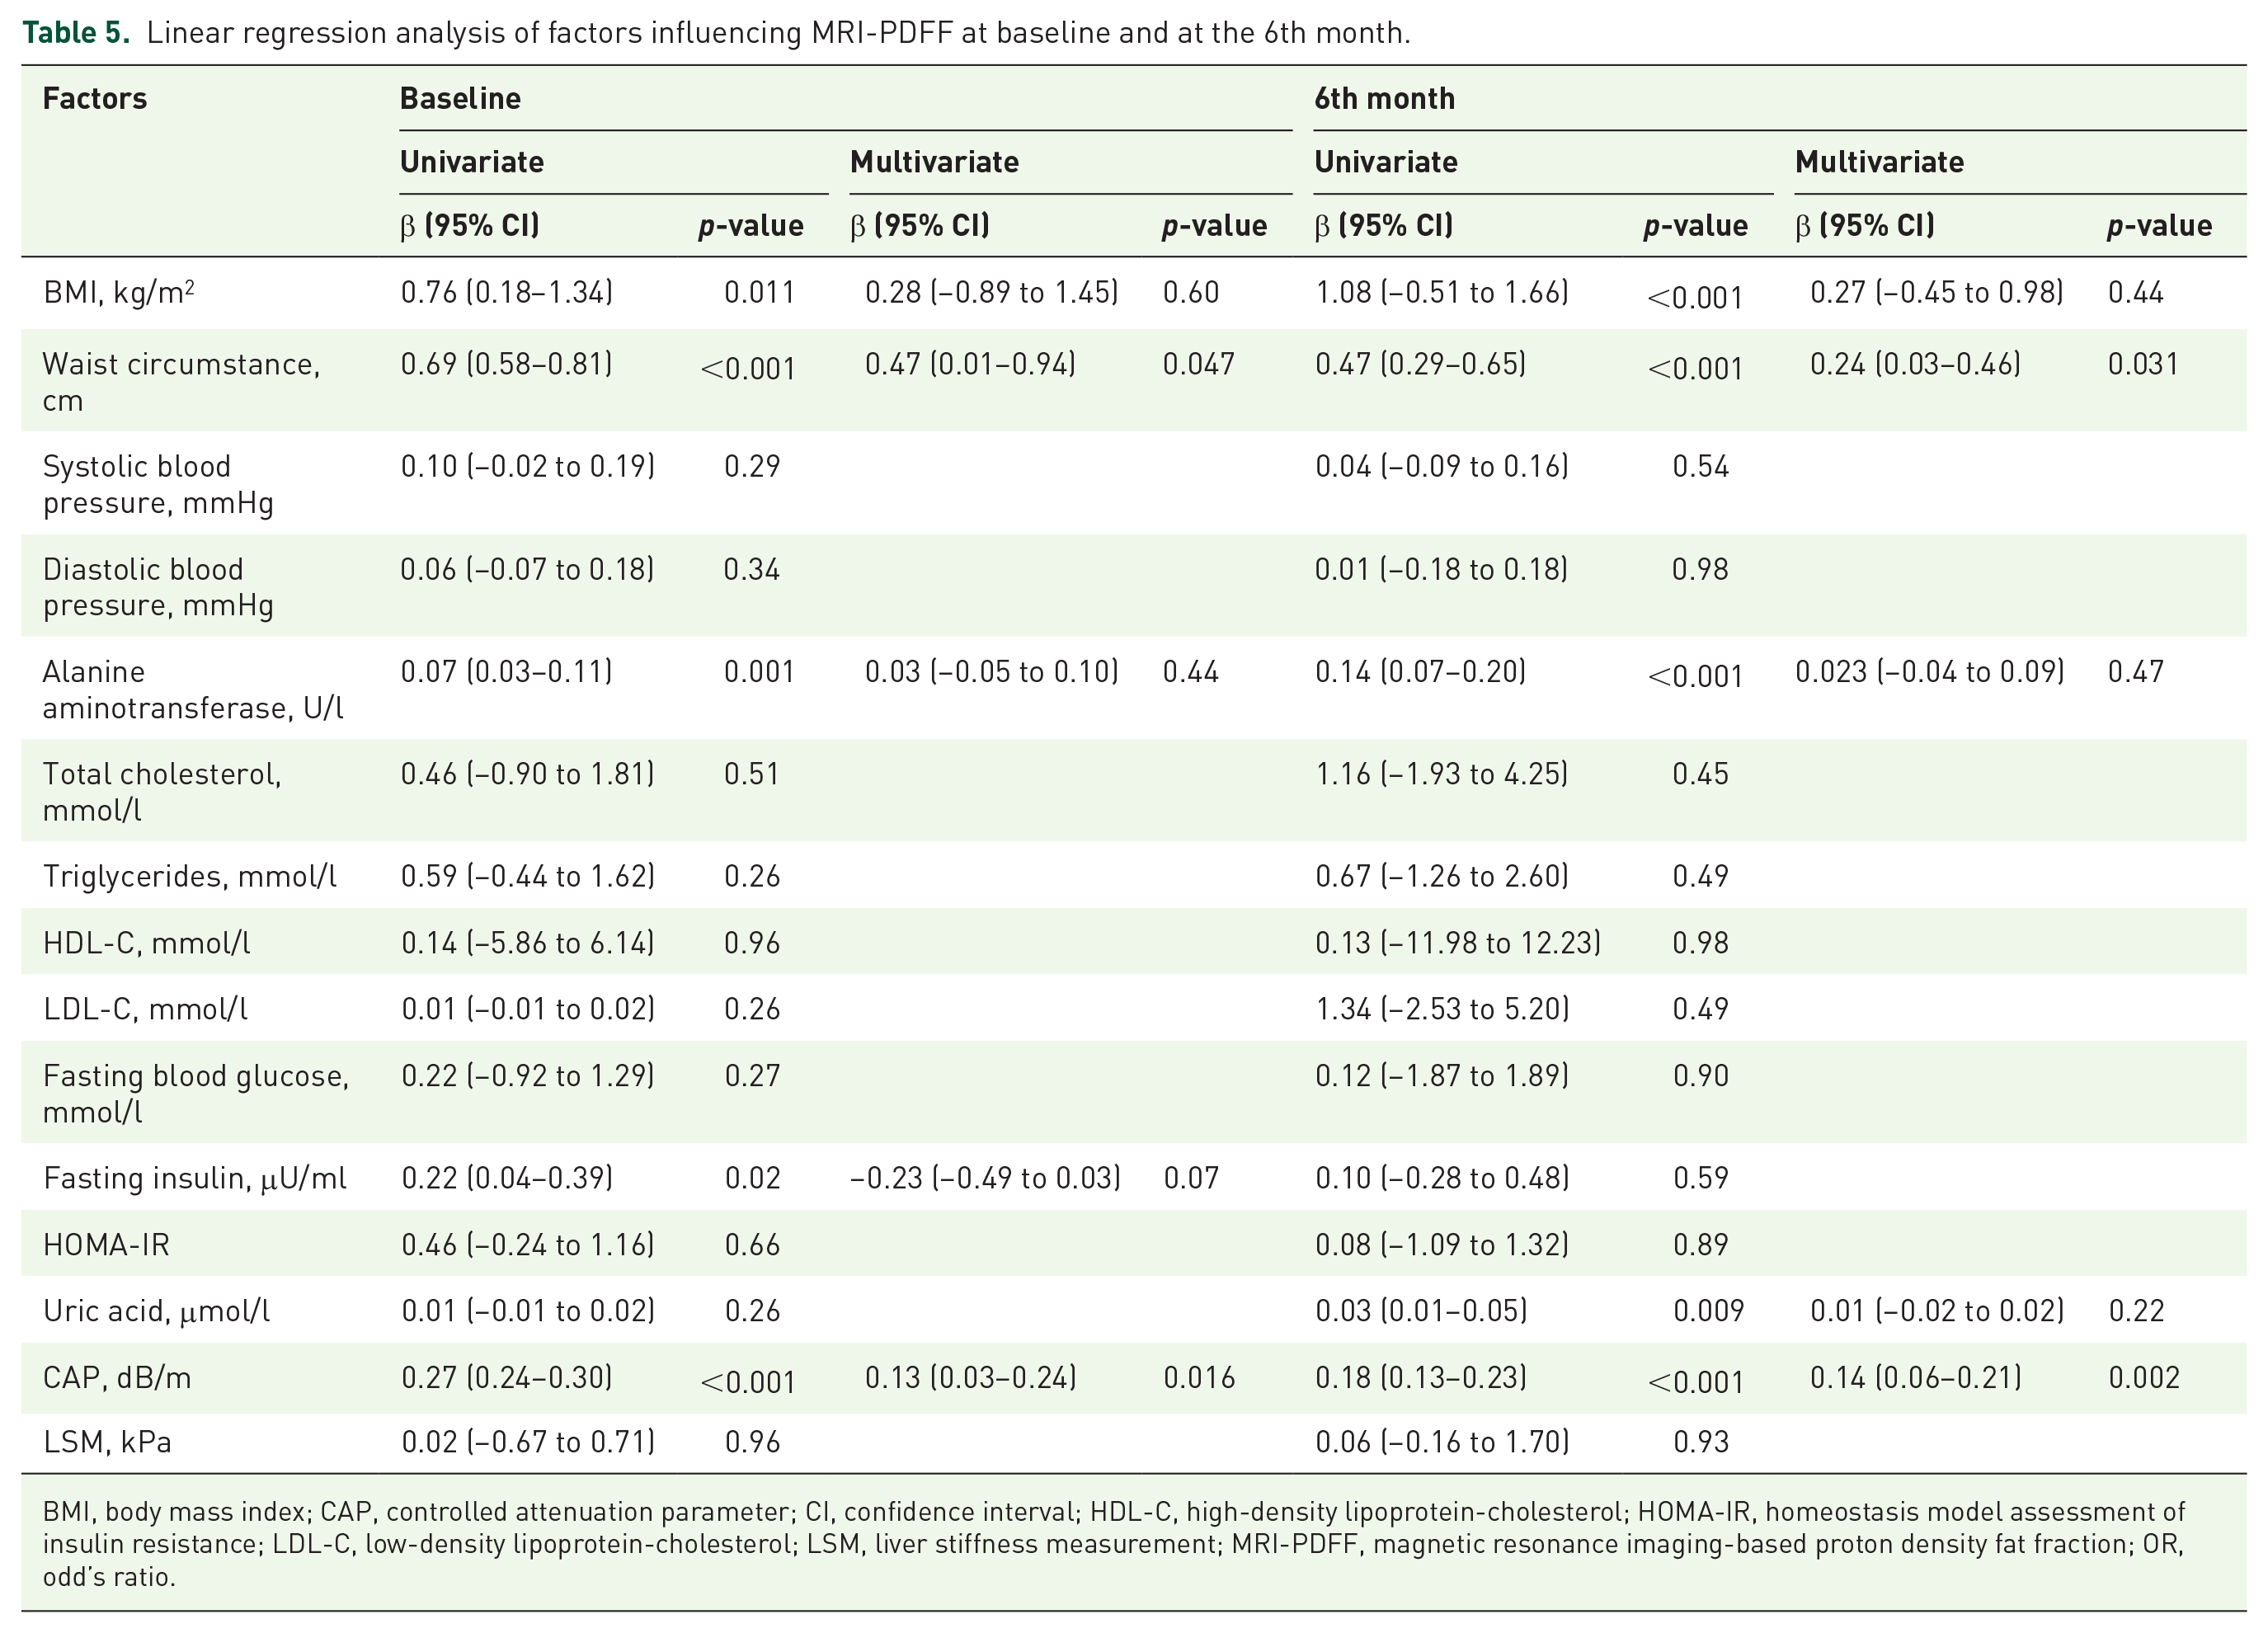
BMI, body mass index; CAP, controlled attenuation parameter; CI, confidence interval; HDL-C, high-density lipoprotein-cholesterol; HOMA-IR, homeostasis model assessment of insulin resistance; LDL-C, low-density lipoprotein-cholesterol; LSM, liver stiffness measurement; MRI-PDFF, magnetic resonance imaging-based proton density fat fraction; OR, odd’s ratio.
Linear regression analysis of factors influencing MRI-PDFF increment during follow-up.
BMI, body mass index; CAP, controlled attenuation parameter; CI, confidence interval; HDL-C, high-density lipoprotein-cholesterol; HOMA-IR, homeostasis model assessment of insulin resistance; LDL-C, low-density lipoprotein-cholesterol; LSM, liver stiffness measurement; MRI-PDFF, magnetic resonance imaging-based proton density fat fraction.
Discussion
The present study compared the diagnostic accuracy of detecting and grading steatosis by MRI-PDFF and CAP before and after treatments. Using histology as a reference, the accuracy of detecting steatosis decreased with CAP but not with MRI-PDFF as steatosis grades increased. Furthermore, using MRI-PDFF as a reference to estimate the monitoring value of CAP during follow-up, our results demonstrated that CAP change did not correlate well with MRI-PDFF change in steatosis grading alteration detected at the baseline assessments. Therefore, the interpretation of the change in the CAP value should be taken with caution even in assessing the steatosis grading monitoring.
LFC monitoring is crucial in the management of MAFLD. Several studies have revealed that LFC is associated with the presence of diabetes and CVD.31 –33 Therefore, the decrease in LFC is an important goal of treatment. In the present study, we found that CAP correlated well with MRI-PDFF at baseline except in moderate or severe steatosis. An AUC of 0.972 (95% CI 90.7–98.8%) was noted in mild steatosis, which decreased to 0.815 in severe steatosis, which was further demonstrated in the logistic regression model. The trends in the AUCs of different steatosis degrees were similar to those of previous studies. A multicenter study including 450 suspected MAFLD adults in the United Kingdom using liver biopsy as a reference reported that CAP values identified patients with steatosis ⩾S1, S2, and S3 with AUCs of 0.87, 0.77, and 0.70, respectively. 29 Another pilot study with a sample of 55 MAFLD patients and 22 controls stated that AUCs for CAP estimation of steatosis grade from ⩾S1, ⩾S2, to S3 were 0.94, 0.80, and 0.69 with the M-probe, and 0.97, 0.81, and 0.67 with the XL-probe, respectively. 34 Taken together, these results suggest that cases with a greater than moderate degree of steatosis should be further confirmed by MRI-PDFF before initiating treatment in clinical practice, which is necessary for the accurate estimation of prognosis and therapeutic effects.
The CAP, the first ultrasound-based tool for the quantification of liver steatosis, has been available for 10 years. It is easy to operate, and physicians can evaluate CAP and liver stiffness via FibroScan at the same time. However, CAP can only be conducted in A-mode ultrasound and several factors (underlying disease, BMI, and diabetes) may influence the estimation and of CAP.7,8,35 Newer ultrasound techniques for the quantification of liver steatosis based on B-mode ultrasound have been available in recent years. Attenuation Imaging (ATI) is implemented in an US system (Canon Medical Systems, Otawara, Japan), which can quantify the attenuation of the US beam using a real-time and color-coded map and filter out the structures that affect the measured values, such as artefacts or vessels. Ferraioli et al. 12 conducted a prospective study involving 87 NAFLD patients diagnosed via MRI-PDFF > 5.0% and 36 healthy controls and demonstrated that ATI performed better than CAP in predicting ⩾S0 (AUC 0.91 versus 0.85) and S > 1 steatosis (AUC 0.95 versus 0.88). Ferraioli et al. 36 further divided ATI into Attenuation Imaging–Penetration (ATI-Pen) and the previous ATI algorithm (Attenuation Imaging–General [ATI-Gen]) and validated that ATI-Pen and ATI-Gen attained higher AUC than CAP for detecting ⩾S0. A prospective study from Japan, involving 182 consecutive patients with hepatitis C virus or NAFLD-related chronic liver disease who had undergone ultrasound guided attenuation parameter (UGAP), CAP, computed tomography (CT), and liver biopsy and significant differences were found between UGAP and CAP detecting ⩾S2 (0.950 versus 0.851, p = 0.013) and S3 (0.959 versus 0.817, p = 0.001). 37 As a result, both ATI and UGAP has the potential to be the reliable alternative to the liver biopsy in quantifying liver steatosis.
Previous studies have validated that MRI-PDFF correlated well with the steatosis grade determined by histology, which is acknowledged as the gold standard of MAFLD evaluation.3,4 Compared with MRI-PDFF, CAP has several advantages, such as low cost and easy operation. However, the consistency between CAP change and MRI-PDFF change, especially in grading steatosis during follow-up, has not been well validated. Although CAP change showed a similar correlation with MRI-PDFF change at the sixth month of steatosis staging, its correlation was impaired when applied to identify the grading change of LFC. Using the steatosis grading cutoff value attained, CAP achieved AUCs of 0.717 and 0.702 for predicting MRI-PDFF steatosis grade improvement and worsening, respectively, which also had poor Cohen’s kappa values. In a study on the interobserver concordance in the CAP measurements, the overall intraclass correlation coefficient was 0.84 and the absolute difference in CAP values between the two observers was 20 dB/m. 38 Our study revealed that the absolute difference in CAP values between the two observers was 8 dB/m. The intraclass correlation coefficient of CAP was 0.88 and the within-weeks coefficient of variation was 8.9%. For the within-session intra- and interobserver repeatability, the intraclass correlation coefficients were 0.94 and 0.87, respectively, with coefficients of variation of 3.8% and 4.9%. Therefore, it is with high probability that steatosis degree changes predicted by CAP changes of 16 dB/m could not be merely due to the variability in measurements, which is intrinsic to the technique. The results of our study were consistent with a longitudinal observational study of 57 MAFLD patients showing that the correlation index between CAP and MRI-PDFF reached 0.37 without statistical significance. 39 Similarly, a recent study involving 50 MAFLD patients by sonography and/or histology demonstrated that after 12 months of follow-up, a weak correlation between CAP change and MRI-PDFF change was found (r = 0.493, p = 0.001). 40 As a result, CAP has limited value in monitoring LFC grading changes during follow-up.
Currently, effective drugs for MAFLD are limited. Weight loss reduces hepatic steatosis, which is achieved by a hypocaloric diet and increased physical-activity-based lifestyle intervention, especially for obese MAFLD patients. However, weight loss is not equal to the remission of MAFLD and MAFLD can also occur in nonobese individuals. Therefore, it is essential to establish a noninvasive, reproducible, and well-correlated histological method to monitor LFC. Our results validated that MRI-PDFF showed high diagnostic accuracy in detecting and grading steatosis with AUCs of 0.972, 0.955, and 0.950 for ⩾S1, ⩾S2, and S3, respectively, which was analogous to previous studies.11,41 –43 In addition, Middleton et al. 26 further declared that an MRI-PDFF reduction of 5.15% identified subjects with a reduced steatosis grade, whereas an increase of 5.6% identified those with an increased steatosis grade. Therefore, MRI-PDFF has high utility in both detecting and grading steatosis in MAFLD patients.
Interestingly, severe steatosis has been identified as a confounding factor in steatosis grading with CAP when using histology as a reference. For dynamic change consistency, those with a high grade of steatosis at baseline seem to have increased correctness to some degree when CAP is used. This finding may be attributed to the fact that severe steatosis patients would have higher possibilities of achieving a large extent of LFC decrease than those with mild steatosis worsening to severe steatosis during the intervention. As a result, the significant decrease in LFC may be sensitive enough for CAP to be detected; minimal changes in LFC to a mild degree would not be likely to be identified by CAP.
The present study has several limitations. First, this was a single-center prospective study; therefore, bias may exist. Second, the patients enrolled were limited, although the study sample was larger than any reported article as far as we were concerned. Third, we utilized MRI-PDFF rather than biopsy to estimate the monitoring value of CAP, even though MRI-PDFF has been validated that MRI-PDFF change correlates well with histologically-determined steatosis change.
Conclusions
In conclusion, MRI-PDFF exhibits high diagnostic accuracy in detecting and grading steatosis. CAP offers comparable diagnostic accuracy in detecting mild steatosis, but the accuracy decreased as the steatosis grade worsened. In addition, changes in CAP value change correlated weakly with changes in MRI-PDFF values, suggesting that the use of CAP values for monitoring changes in LFC should be further confirmed by changes in MRI-PDFF during follow-up, especially for estimating treatment responses.
Supplemental Material
sj-pdf-1-taj-10.1177_20406223211033119 – Supplemental material for Steatosis grading consistency between controlled attenuation parameter and MRI-PDFF in monitoring metabolic associated fatty liver disease
Supplemental material, sj-pdf-1-taj-10.1177_20406223211033119 for Steatosis grading consistency between controlled attenuation parameter and MRI-PDFF in monitoring metabolic associated fatty liver disease by Cong xiang Shao, Junzhao Ye, Zhi Dong, Fuxi Li, Yansong Lin, Bing Liao, Shiting Feng and Bihui Zhong in Therapeutic Advances in Chronic Disease
Supplemental Material
sj-pdf-2-taj-10.1177_20406223211033119 – Supplemental material for Steatosis grading consistency between controlled attenuation parameter and MRI-PDFF in monitoring metabolic associated fatty liver disease
Supplemental material, sj-pdf-2-taj-10.1177_20406223211033119 for Steatosis grading consistency between controlled attenuation parameter and MRI-PDFF in monitoring metabolic associated fatty liver disease by Cong xiang Shao, Junzhao Ye, Zhi Dong, Fuxi Li, Yansong Lin, Bing Liao, Shiting Feng and Bihui Zhong in Therapeutic Advances in Chronic Disease
Footnotes
Acknowledgements
We are grateful to Professor Aihua Lin in School of Public Health, Sun Yat-sen University for their assistance in statistical analysis of this study.
Author contributions
Bihui Zhong: conceive, design, and critical revision of the manuscript for important intellectual content; Congxiang Shao and Junzhao Ye: contributed equally to this work, including data collection, analysis, interpretation of results, and manuscript drafting. Zhi Dong: imaging pictures processing. Fuxi Li and Yansong Lin: anthropometry data collection. Bing Liao: histological assessment. Shiting Feng: imaging data collection.
Funding
The authors disclosed receipt of the following financial support for the research, authorship, and/or publication of this article: This study is supported by National Natural Science Foundation of China (81870404, 81670518, 81170392), Guangdong Science and Technology Department (2014A020212118), Chinese Foundation for Hepatitis Prevention and Control (TQGB20140083) and China postdoctoral science foundation (2020M683128).
Conflict of interest statement
The authors declare that there is no conflict of interest.
Supplemental material
Supplemental material for this article is available online.
References
Supplementary Material
Please find the following supplemental material available below.
For Open Access articles published under a Creative Commons License, all supplemental material carries the same license as the article it is associated with.
For non-Open Access articles published, all supplemental material carries a non-exclusive license, and permission requests for re-use of supplemental material or any part of supplemental material shall be sent directly to the copyright owner as specified in the copyright notice associated with the article.