
Abstract
Background:
FIBTEM, a rotational thromboelastometry (ROTEM) component, assesses fibrin-based clot firmness and indirectly measures fibrinogen function. It offers faster turnaround time compared to the Clauss method for fibrinogen quantification, which may support early coagulation assessment in critically ill patients with sepsis.
Objectives:
Our study aims to evaluate the correlation between FIBTEM parameters and fibrinogen levels and predict the possibility of hyperfibrinogenemia using FIBTEM parameters in patients with sepsis.
Design:
A retrospective secondary analysis of a prospective observational study.
Methods:
Patients diagnosed with sepsis were recruited and admitted to the University Medical Center Ho Chi Minh City intensive care unit from June 2020 to December 2021. The international normalized ratio, activated partial thromboplastin time, platelet counts, fibrinogen levels, and FIBTEM parameters (A5, A10, A20, and maximum clot firmness (MCF)) were assessed for each patient. The correlations among laboratory parameters were assessed using the Pearson’s correlation coefficient. Predicted values of fibrinogen and FIBTEM were analyzed using simple linear regression, Bland–Altman plots, and Lin’s concordance correlation coefficient (CCC). The area under the receiver operating characteristic curve (AUC) and Kappa coefficients were calculated.
Results:
The median age of 159 patients with sepsis was 69. Males represented 51.6% of the participants. The percentage of patients with comorbidities was 88.1%. The mean plasma fibrinogen level was 5.4 ± 1.8 g/L. Fibrinogen levels were strongly correlated with FIBTEM parameters (p < 0.01 for all values), including A5 (r = 0.701), A10 (r = 0.717), A20 (r = 0.723), and MCF (r = 0.735). MCF could not predict exact fibrinogen levels (CCC = 0.703). The AUC of the MCF to predict hyperfibrinogenemia was 0.905 (95% CI: 0.866–0.945), with a sensitivity of 85.5%, a specificity of 83.1%, and a Kappa coefficient of 0.69 at the optimal cut-off value of 22.5 mm.
Conclusion:
FIBTEM MCF could be a practical, rapid, surrogate tool for detecting hyperfibrinogenemia in sepsis and may help guide early clinical decisions before fibrinogen test results are available, although further validation in larger studies is required.
Plain language summary
What is this research about? Sepsis is a severe condition where the body responds to infection in a way that can damage its own tissues and organs. In sepsis, blood clotting can become abnormal. Fibrinogen is a protein in the blood that helps it to clot. High fibrinogen levels (hyperfibrinogenemia) can indicate inflammation and affect treatment decisions. Traditional tests to measure fibrinogen levels can take time, which may delay critical care. What did the researchers do? Researchers studied 159 patients with sepsis admitted to an intensive care unit in Ho Chi Minh City between June 2020 and December 2021. They used a test called FIBTEM, part of a rotational thromboelastometry (ROTEM) system, which assesses how blood clots. They compared FIBTEM results with traditional fibrinogen level tests to see if FIBTEM could quickly and accurately indicate high fibrinogen levels. What did the researchers find? The study found a strong correlation between FIBTEM results and fibrinogen levels. Specifically, a measurement called maximum clot firmness (MCF) from the FIBTEM test effectively identified patients with high fibrinogen levels. An MCF value of 22.5 mm or higher was a good indicator of hyperfibrinogenemia. Why is this important? Using FIBTEM allows healthcare providers to assess fibrinogen levels more rapidly than traditional methods. This quick assessment can help make timely decisions about the care and treatment of patients with sepsis, potentially improving outcomes. Conclusion FIBTEM is a valuable tool for quickly identifying high fibrinogen levels in sepsis patients, aiding in faster and more effective treatment decisions.
Introduction
Sepsis is a leading cause of death among hospitalized patients with severe infections, particularly in intensive care units (ICUs), with reported mortality rates of 12.8%–24.4%.1–3 The systemic inflammatory response in sepsis activates the coagulation cascade and frequently results in hemostatic disturbances. 4 Up to 70% of septic patients develop sepsis-induced coagulopathy, which is strongly associated with organ dysfunction and adverse outcomes.5–7 A comprehensive coagulation assessment is therefore essential for classifying disease severity, predicting prognosis, and guiding timely therapeutic interventions. 8
Fibrinogen is a large glycoprotein synthesized in the liver with a half-life of 3–5 days. 9 It is critical for hemostasis, converting to fibrin via thrombin to form stable blood clots, and plays a key role in platelet aggregation and interaction with coagulation proteins such as thrombospondin and von Willebrand factor.9,10 Beyond coagulation, fibrinogen also contributes to wound healing, tissue regeneration, and modulation of the inflammatory response to infection. 10 Plasma fibrinogen is commonly measured by the Clauss method, which, despite its reliability, requires laboratory infrastructure and may delay results by up to an hour, potentially impacting urgent clinical decision-making.
Hypofibrinogenemia is strongly linked to the severity and progression of sepsis-induced coagulopathy and is included as a parameter in diagnostic scoring systems for disseminated intravascular coagulation (DIC).11,12 The 2020 Japanese Clinical Practice Guidelines for Sepsis and Septic Shock recommend fibrinogen supplementation when plasma levels fall below 1.5 g/L. 13 While hypofibrinogenemia is well recognized, hyperfibrinogenemia is actually more common in septic patients, except in overt DIC, and has been relatively understudied.11,14–17 Elevated fibrinogen levels are associated with a prothrombotic state, contributing to venous thromboembolism,18–20 stroke, 21 and worse outcomes in sepsis.10,22,23 Early recognition of fibrinogen abnormalities enables targeted therapeutic strategies, such as fibrinogen concentrate or cryoprecipitate supplementation in hypofibrinogenemia, and adjustments to anticoagulation or thromboprophylaxis in patients with marked hyperfibrinogenemia and a high thrombotic risk.13,18–20 These interventions may improve outcomes by preventing both bleeding and thrombotic complications.
Rotational thromboelastometry (ROTEM) is a viscoelastic method that assesses whole-blood coagulation, integrating both plasma and cellular components. 24 Compared with conventional coagulation tests (CCTs), including international normalized ratio (INR), activated partial thromboplastin time (aPTT), platelet count, and Clauss fibrinogen, ROTEM provides a more comprehensive evaluation and can detect hypercoagulability or impaired fibrinolysis, which CCTs may miss.7,24–27 The FIBTEM assay specifically measures fibrin-based clot strength by using cytochalasin D to inhibit platelets, so its clot firmness reflects fibrinogen concentration and function. 24
FIBTEM provides results within 5–10 min, much faster than conventional fibrinogen assays. 28 Multiple studies have demonstrated strong correlations between FIBTEM parameters and plasma fibrinogen levels, enabling the early prediction of fibrinogen status and guiding prompt interventions in trauma patients.29,30 However, the diagnostic performance of FIBTEM parameters in sepsis has not been systematically validated.
Beyond trauma and critical care, ROTEM has shown diagnostic and perioperative value in rare hemostatic disorders. In a study of 63 patients with congenital dysfibrinogenemia, ROTEM clot formation parameters provided high diagnostic value and functional insight beyond standard assays. 31 Similarly, perioperative ROTEM monitoring in a severe hemophilia A patient undergoing ankle surgery-guided factor replacement and ensured adequate hemostatic control. 32 These findings underscore the versatility of ROTEM and support the investigation of FIBTEM in sepsis, where hemostatic disturbances are frequent and complex.
Although several studies have shown strong correlations between FIBTEM parameters and plasma fibrinogen levels, most were conducted in trauma, surgical, or healthy populations.29,33 Recent reviews have emphasized the fundamental principles of ROTEM and its clinical value in guiding fibrinogen replacement therapy, highlighting its role as a rapid, functional complement to CCTs. 34 However, coagulation disturbances in sepsis differ fundamentally from those in trauma or surgery, reflecting a complex interplay of inflammation, endothelial dysfunction, and consumption and activation of coagulation factors. Whereas hypofibrinogenemia is a primary concern perioperatively, hyperfibrinogenemia predominates in sepsis and contributes to thrombotic risk and disease progression.11,14–17,22
Extrapolating data from nonsepsis populations may therefore be inappropriate. Furthermore, most prior investigations assessed only unidirectional correlations between FIBTEM and fibrinogen, without evaluating their reciprocal predictive potential. Studies in sepsis-specific settings are needed to determine whether FIBTEM and fibrinogen can serve as interchangeable tools for early hyperfibrinogenemia detection, which is particularly relevant in resource-limited ICUs where ROTEM devices may not be available. This study is a secondary analysis of a previously published observational cohort that characterized coagulation profiles in patients with sepsis using EXTEM and INTEM parameters. 35
To address these gaps, we investigated the correlation between FIBTEM parameters and Clauss fibrinogen levels in a Vietnamese adult ICU cohort with sepsis. We assessed the diagnostic performance of FIBTEM maximum clot firmness (MCF) for predicting hyperfibrinogenemia.
Methods
Study design and participants
This study is a retrospective secondary analysis of a previously published prospective cohort conducted at the 30-bed non-COVID ICU of the University Medical Center Ho Chi Minh City, University of Medicine and Pharmacy at Ho Chi Minh City, between June 2020 and December 2021. 35 Adult patients (⩾18 years) admitted within 24 h with sepsis or septic shock, as defined by the Sepsis-3 criteria, were consecutively enrolled. Sepsis was defined as documented or suspected infection plus an acute increase in SOFA score ⩾2 points, while septic shock required vasopressor therapy to maintain MAP ⩾65 mmHg and serum lactate >2 mmol/L despite adequate fluid resuscitation.
For the current analysis, we included patients with complete ROTEM (including INTEM, EXTEM, and FIBTEM) and Clauss fibrinogen results performed within the first 24 h of ICU admission. Patients with missing Clauss fibrinogen data were excluded. The original study’s exclusion criteria were transfusion of plasma, cryoprecipitate, or platelets before ROTEM sampling, known congenital or acquired coagulopathies unrelated to sepsis, ongoing therapeutic anticoagulation or antiplatelet therapy, advanced chronic liver disease (Child-Pugh C), end-stage renal disease requiring dialysis, active malignancy or hematologic disorders, and pregnancy.
A total of 159 patients met the inclusion criteria and were included in the analysis, representing all eligible cases during the 18-month recruitment period. As this was a secondary analysis, no a priori sample size calculation was performed; however, post hoc power analysis demonstrated >99.9% power (α = 0.05) to detect the observed area under the receiver operating characteristic (ROC) curve (AUC) of 0.905 for MCF predicting hyperfibrinogenemia and >99.9% power to reject the null hypothesis of r = 0 for the correlation between MCF and Clauss fibrinogen (r = 0.735). All estimates are presented with 95% confidence intervals (CIs) to reflect statistical precision.
Demographic and clinical data, as well as ROTEM and Clauss fibrinogen tests, were collected according to standardized protocols within the first 24 h of ICU admission. Written informed consent was obtained from all participants or their legal representatives at the time of the original study, which was approved by the institutional ethics committee (No. 349/HĐĐĐ-ĐHYD, May 26, 2020). As this analysis involved de-identified data and no new patient interventions were implemented, additional informed consent was not required (Figure 1).

Workflow of the study.
Laboratory testing
INR, aPTT, PLT, and plasma fibrinogen levels were measured, and FIBTEM was performed within 24 h of ICU admission. At the central laboratory of the University Medical Center, each test was performed according to the manufacturer’s instructions. INR, aPTT, and plasma fibrinogen levels were measured using STA R-MAX (Diagnostica Stago S.A.S, Asnières-sur-Seine Cedex, France). PLT was measured using a Sysmex XN-9000 analyzer (Sysmex Company, Kobe, Japan). The ROTEM was performed using the ROTEM delta (TEM International GmbH, Munich, Germany), and the procedure lasted over 1 h. ROTEM tests were performed immediately after sampling. While full results, including fibrinolysis parameters, are typically completed within 60 min, key parameters such as A5, A10, and MCF were accessible within the first 10–20 min and used for clinical interpretation. FIBTEM is a channel in the ROTEM used to evaluate the function of fibrinogen by adding cytochalasin D reagent to inhibit the action of platelets. 25 Therefore, the action of platelets in the coagulation cascade will be inhibited, and FIBTEM results will depend mainly on plasma fibrinogen levels.36,37 The clotting time (CT) (s) is the interval between the beginning of the test and the formation of a clot with a 2-mm amplitude. The MCF (mm) is the most significant amplitude of the clot. A5, A10, and A20 measure the amplitude of the clot at 5, 10, and 20 min, respectively, after CT. 37 The normal values of the FIBTEM parameters were within the manufacturer’s reference ranges: A5: 4–17 mm, A10: 7–23 mm, A20: 8–24 mm, and MCF: 9–25 mm. Increased FIBTEM was defined as meeting at least one of the following criteria: A5 >17 mm (not-increased A5 status ⩽17 mm); A10 >23 mm (not-increased A10 status ⩽23 mm); A20 >24 mm (not-increased A20 status ⩽24 mm); and MCF >25 mm (not-increased MCF status ⩽25 mm). Decreased FIBTEM was defined as meeting at least one of the following criteria: A5 <4 mm, A10 <7 mm, A20 <8 mm, and MCF <9 mm.24,28,38 All tests were conducted according to the manufacturer’s instructions for use (IFU), without any procedural modifications.
Fibrinogen levels were measured using the Clauss assay method following the manufacturer’s instructions (Diagnostica Stago S.A.S., France). Normal fibrinogen levels were based on 2–4 g/L laboratory reference ranges. Hyperfibrinogenemia was defined as a fibrinogen level > 4 g/L (not-increased fibrinogen status ⩽ 4 g/L), and hypofibrinogenemia was defined as a fibrinogen level <2 g/L. 39 The assay was performed according to the standard protocol provided by the reagent and equipment manufacturers. Both ROTEM and Clauss fibrinogen assays were performed independently in the central laboratory according to standard operating procedures. Laboratory technicians conducting each assay were not involved in data analysis. Because both ROTEM and Clauss are objective laboratory measurements, no additional blinding procedures were necessary.
Statistical analysis
Data distribution was first assessed for normality using the Shapiro–Wilk test. Variables with a normal distribution are presented as mean ± SD, whereas nonnormally distributed variables are expressed as median (interquartile range (IQR)). Age, INR, aPTT ratio (aPTTr), and PLT are medians and IQRs. Fibrinogen levels and FIBTEM parameters (A5, A10, A20, and MCF) are described as means and standard deviations (SD). Increased FIBTEM parameters, including A5 (>17 mm), A10 (>23 mm), A20 (>24 mm), and MCF (>25 mm), as well as sex, comorbidities, and hyperfibrinogenemia, are described by frequency and percentage. Pearson’s correlation coefficient was used to measure the correlation between FIBTEM and fibrinogen levels. If the correlation is strong (r ⩾ 0.7), 40 the ability of FIBTEM to predict fibrinogen levels will be assessed using simple linear regression. To evaluate the robustness of regression estimates, we performed bootstrap resampling with 2500 repetitions and calculated bias-corrected and accelerated (BCa) 95% CIs for the regression coefficients. As the bootstrapped estimates were nearly identical to the original coefficients, detailed results are shown in Supplemental File 3. Observed and calculated fibrinogen levels, as well as FIBTEM parameters, were compared using Bland–Altman plots with 95% CIs to assess the accuracy and precision of the correlation. Bias was defined as the mean difference between the two observed and calculated values, and 95% of the limits of agreement (LOA) referred to a 1.96 SD difference. 38 Lin’s concordance correlation coefficient (CCC) was also used to measure the agreement between the observed and calculated values. Agreement strength was categorized as poor (⩽0.90), moderate (>0.90–0.95), substantial (>0.95–0.99), or perfect (>0.99). 41 The AUC was calculated to determine the optimal cut-off values for sensitivity and specificity using the maximized Youden index. A nonparametric test compared the AUCs. AUC values between 0.7 and 0.8 were considered acceptable, 0.8 and 0.9 were considered excellent, and >0.9 were considered outstanding. 42 Cohen’s Kappa coefficients were calculated to measure agreement between observed FIBTEM parameters and hyperfibrinogenemia status and between observed fibrinogen levels and increased FIBTEM (A5, A10, A20, and MCF). Agreement strength was based on the standard definition (<0: poor, 0–0.2: slight, 0.21–0.4: fair, 0.41–0.6: moderate, 0.61–0.8: substantial, and 0.81–1: almost perfect). 43 Statistical significance was defined as a two-sided p value of less than 0.05. Two patients with extreme values in all four FIBTEM parameters (A5, A10, A20, and MCF) were excluded from the analysis due to their disproportionate influence on correlation models. The IQR method identified these values as outliers. These exclusions were based on statistical and technical review, and were not defined a priori in the protocol. The statistical analysis was performed using SPSS version 20.0 for Windows (IBM Corp., Armonk, NY, USA).
Results
Characteristics of participants
Two patients with extreme outlier values in FIBTEM parameters (A5, 49 and 54 mm; A10, 52 and 58 mm; A20, 60 mm; and MCF, 61 mm) were excluded from the 161 eligible participants. Both cases exhibited markedly elevated FIBTEM results without available repeat ROTEM measurements, raising concerns about disproportionate influence on statistical modeling. Therefore, we excluded them based on predefined statistical criteria for outlier detection. After these exclusions, 159 patients (82 males and 77 females) were included in the final analysis. The median age was 69 years (IQR, 60–81), and 140 patients (88.1%) had at least one comorbidity. The most common comorbidities were diabetes mellitus (47.2%), coronary artery disease (30.2%), and chronic kidney disease (17.6%). A history of ischemic stroke and heart failure was present in 11.9% and 10.7% of patients, respectively, whereas other comorbidities were less frequent (Table 1). The median INR was 1.3 (IQR, 1.2–1.6) and the median aPTTr was 1.1 (IQR, 0.9–1.2). The median platelet count was 199 × 10³/mm³ (IQR, 127–271), and the mean plasma fibrinogen concentration was 5.4 ± 1.8 g/L. On FIBTEM, the mean A5, A10, and A20 were 23.9 ± 8.4 mm, 26.2 ± 9.1 mm, and 28.5 ± 9.7 mm, respectively, with a mean MCF of 29.5 ± 1.0 mm (Table 1).
Patient characteristics (n = 159).

aPTT, activated partial thromboplastin time; INR, international normalized ratio; IQR, interquartile range; MCF, maximum clot firmness; PLT, platelet counts; SD, standard deviation.
Correlations between FIBTEM and fibrinogen levels
Table 2 shows that fibrinogen levels positively and strongly correlated with FIBTEM parameters, including A5 (r = 0.701), A10 (r = 0.717), A20 (r = 0.723), and MCF (r = 0.735; p < 0.01 for all values). PLT had a moderate positive correlation with FIBTEM parameters, whereas no significant correlation was observed between FIBTEM parameters and aPTTr. Besides, FIBTEM parameters and fibrinogen levels correlated negatively and weakly with INR (Table 2).
Correlation between FIBTEM parameters and conventional coagulation tests (n = 159).

Values are presented as correlation coefficients (r) with corresponding p values. Correlations were analyzed using Pearson’s correlation coefficient.
Correlation is significant at the 0.05 level (two-tailed).
Correlation is significant at the 0.01 level (two-tailed).
aPTTr, activated partial thromboplastin time ratio; FIB, fibrinogen levels; INR, international normalized ratio; MCF, maximum clot firmness; PLT, platelet counts.
Comparison between the observed and calculated FIBTEM values and observed and calculated fibrinogen levels
Based on the strong correlation (r = 0.701–0.735) between fibrinogen levels and FIBTEM parameters, linear regression was used to develop equations capable of estimating FIBTEM parameters (calculated FIBTEM) from actual fibrinogen levels and estimating fibrinogen levels (calculated fibrinogen levels) from actual FIBTEM parameters (Table 3). The correlation coefficients (r) were from 0.701 to 0.735, indicating a good identification level of the independent variables. The coefficient of determination values (R2) explained 49.2%–54.1% of the variability of the corresponding dependent variables (p < 0.001).
Correlation and Bland–Altman plot data between the observed and calculated FIBTEM and observed and calculated fibrinogen levels.

CCC, Lin’s concordance correlation coefficient (95% confidence interval); FIB, fibrinogen level; MCF, maximum clot firmness; MeanC, calculated mean; MeanOC, observed and calculated mean; r, correlation coefficient; R2, R-squared; SD, standard deviation; Sig, significant.
The calculated FIBTEM parameters and fibrinogen levels were deduced from the equations based on observed FIBTEM and fibrinogen data, respectively. Figure 2 illustrates the concordance between the observed FIBTEM parameters and the calculated values using the linear regression equation. The R2 values indicated the extent to which fibrinogen levels account for the variation in FIBTEM parameters, showing a decrease from MCF (54.1%), A20 (52.2%), and A10 (51.4%) to A5 (49.2%). Similarly, the concordance between the observed and calculated fibrinogen values from the models based on FIBTEM parameters was also presented equally (Table 3). Bootstrap analysis with 2500 repetitions confirmed the stability of the regression coefficients, yielding results nearly identical to the original models.

Lin’s concordance correlation coefficient and Bland–Altman’s plot for comparing the observed and calculated FIBTEM.
Figure 2 shows the concordance between the observed FIBTEM parameters and the calculated values from the linear regression model evaluated using the CCC. The straight lines represent the regression of the observed versus the model-calculated FIBTEM parameters. Bland–Altman analysis of the observed versus the calculated FIBTEM parameters showed −0.4851, 0.0025, 0.0008, and 0.0013 mm differences in bias for A5 (95% LOA 22 : −12.191 to 11.221 mm), A10 (95% LOA: −12.454 to 12.459 mm), A20 (95% LOA: −13.056 to 13.057 mm), and MCF (95% LOA: −13.276 to 13.278 mm), respectively. CCC and its 95% CI for FIBTEM parameters (mm) identification from fibrinogen (g/L) were poor (⩽0.90), ranging from 0.666 to 0.697. The percentage errors for A5, A10, A20, and MCF were 48.9%, 47.5%, 45.9%, and 45%, respectively (Table 3).
Figure 3 shows the concordance between the observed fibrinogen levels and the values calculated from the linear regression model evaluated using the CCC. The straight lines represent the regression of the observed versus the model-calculated fibrinogen levels. Bland–Altman analysis of the observed versus the calculated fibrinogen levels had 0.0017 (95% LOA: −2.536 to 2.539 g/L), −0.0040 (95% LOA: −2.486 to 2.487 g/L), 0.0058 (95% LOA: −2.455 to 2.467 g/L), and −0.0116 (95% LOA: −2.424 to 2.401 g/L) differences in bias, and the percentage errors were 47%, 46%, 45.6%, and 44.7%, corresponding to A5, A10, A20, and MCF used for calculation, respectively. CCC (95% CI) for fibrinogen (g/L) identification from FIBTEM (mm) was also poor (⩽0.90), ranging from 0.659 to 0.703 (Table 3).

Lin’s correlation coefficient concordance and Bland–Altman’s plot for comparison between the observed and calculated fibrinogen levels.
ROC curve analysis
The percentage of increased levels were as follows: FIBTEM A5 (82.4%, 131/159), FIBTEM A10 (62.3%, 99/159), FIBTEM A20 (69.2%, 110/159), MCF (67.3%, 107/159), and fibrinogen levels (78.0%, 124/159). Figure 4 and Table 4 show the results of the ROC analyses. The cut-off values of fibrinogen predicted specific values of increased FIBTEM parameters with high AUC (0.857–0.925), high sensitivity (80.0%–91.6%), and positive predictive values (85.6%–95.2%). Notably, parameter A5 demonstrated the best performance, with the highest values for AUC (0.925), sensitivity (91.6%), and positive predictive value (95.2%). There was a substantial agreement between the calculated and the observed clot firmness parameters for A5 (K = 0.656; p < 0.001), A10 (K = 0.601; p < 0.001), and MCF (K = 0.619; p < 0.001). Nevertheless, the agreement was moderate for A20 (K = 0.574; p < 0.001). The FIBTEM parameters, including A5, A10, A20, and MCF, showed similar performance in predicting fibrinogen levels, with nearly equal AUCs (0.883–0.905), high sensitivity (87.9%–93.6%), and positive predictive values (90.6%–94.0%). MCF had the highest sensitivity (92.7%), positive predictive value (93.5), and AUC (0.905) in forecasting increased fibrinogen levels compared with other FIBTEM parameters. The agreement between the observed and calculated fibrinogen levels was substantial for A5 (K = 0.618), A10 (K = 0.620), A20 (K = 0.628), and MCF (K = 0.692; p < 0.001 for all values).

Area under the ROC curves of fibrinogen levels for predicted increased FIBTEM parameters and FIBTEM levels for predicted hyperfibrinogenemia.
AUC and cut-off values of fibrinogen levels and FIBTEM parameters for predicting hyperfibrinogenemia and increased FIBTEM parameters.
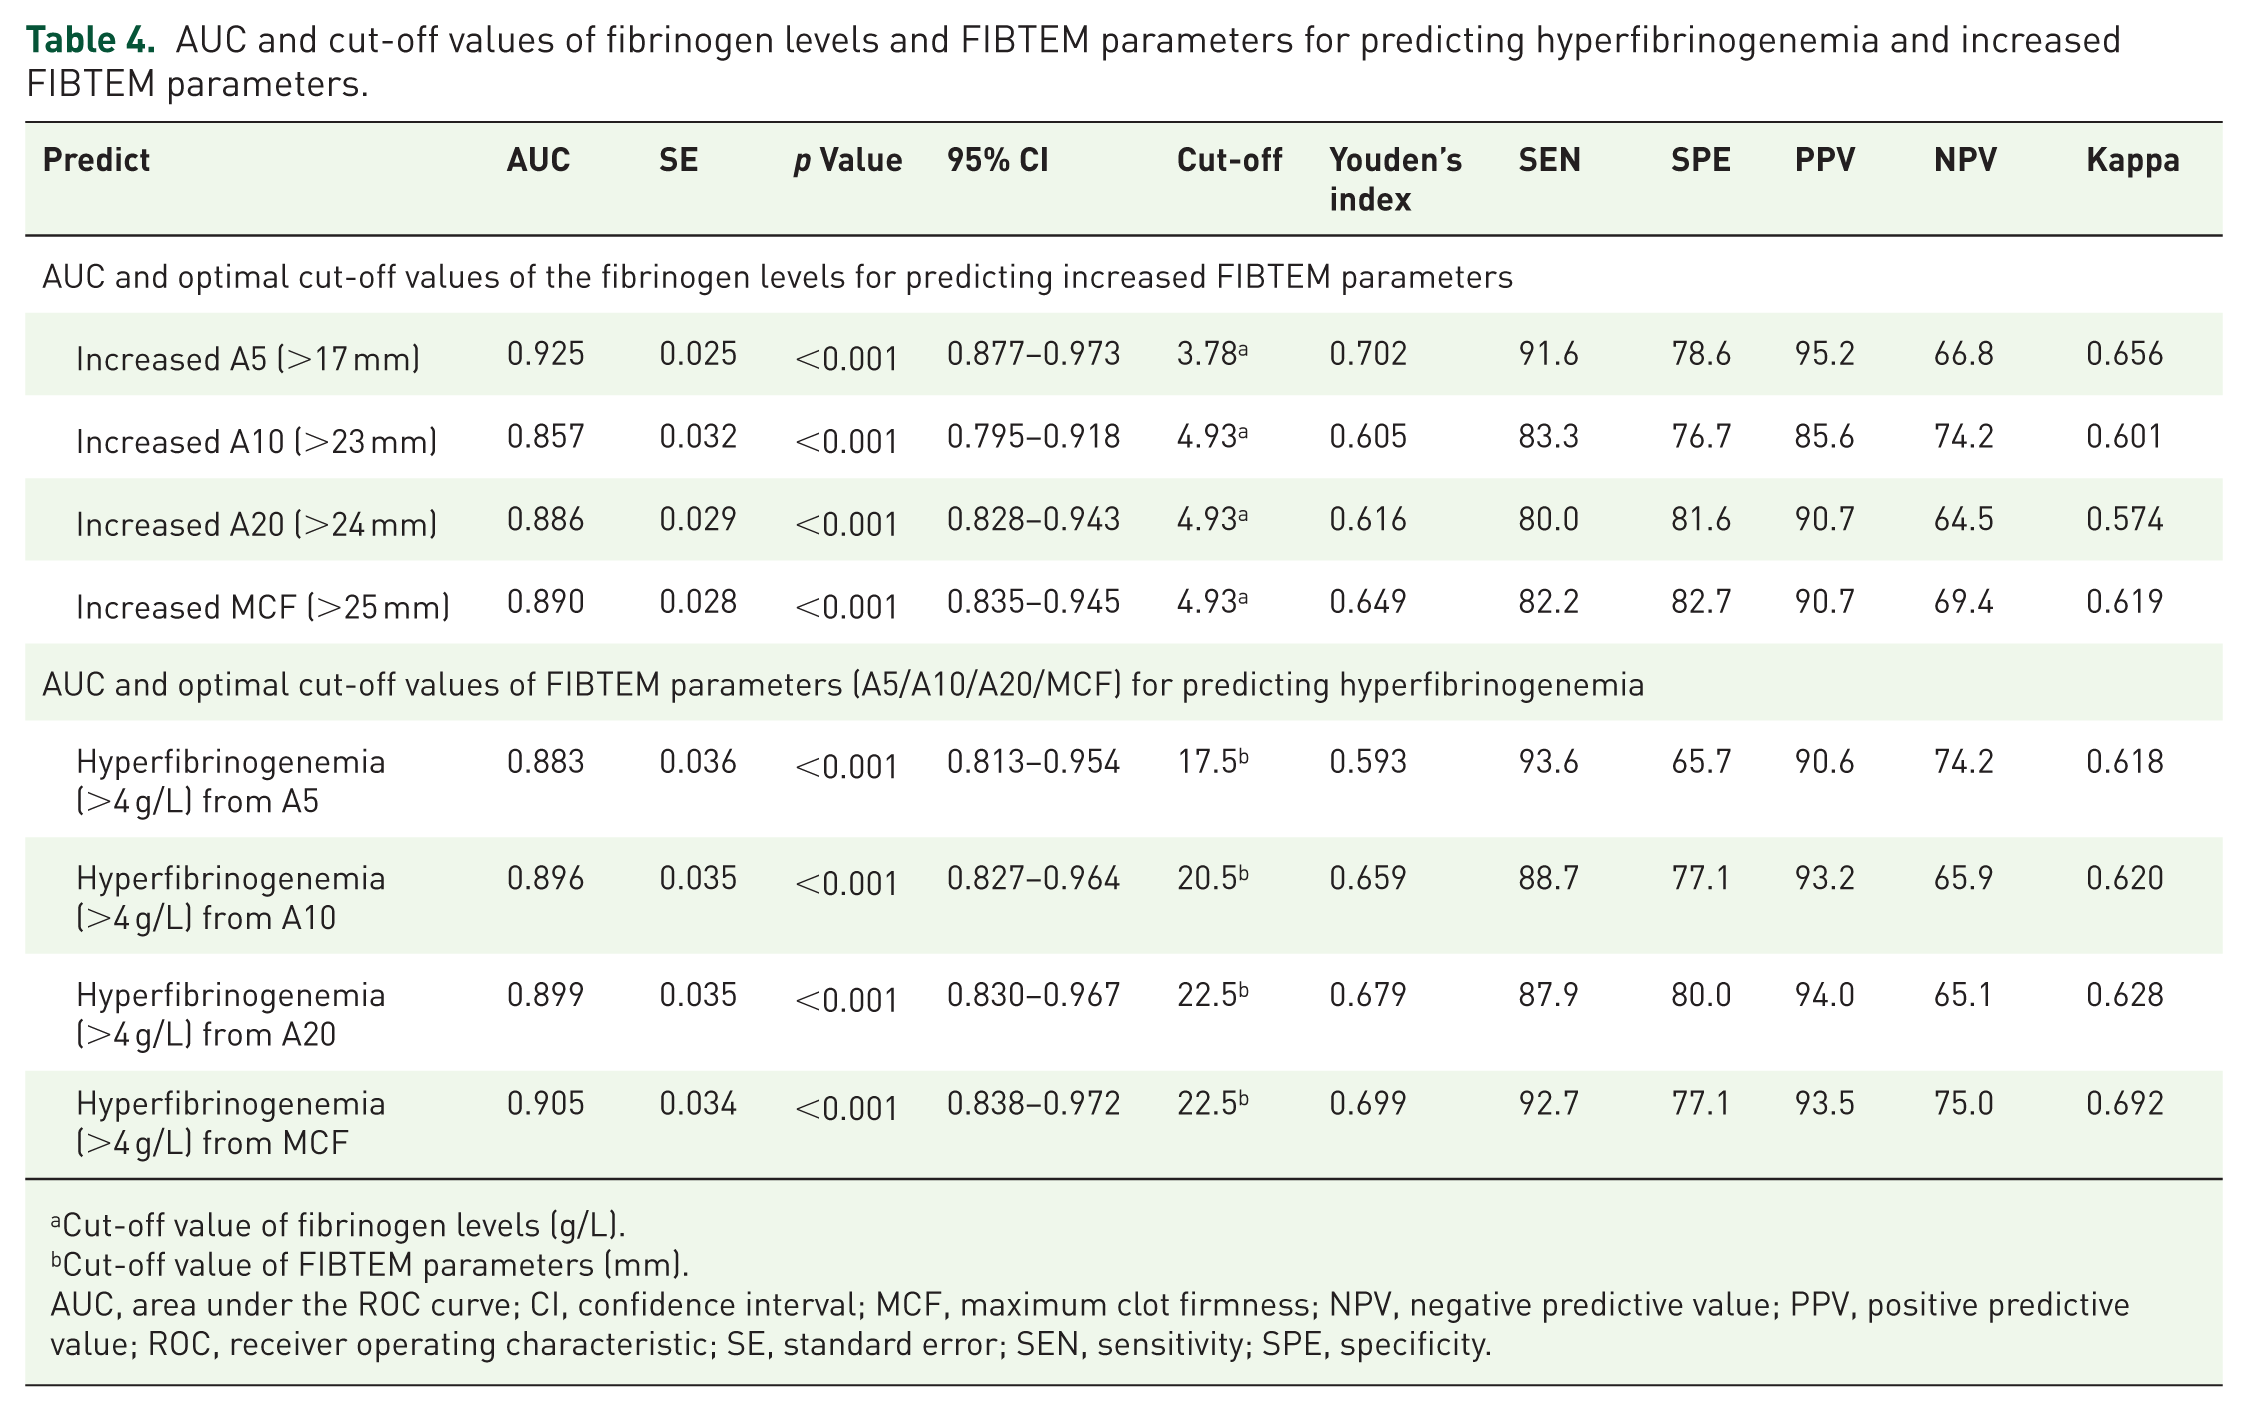
Cut-off value of fibrinogen levels (g/L).
Cut-off value of FIBTEM parameters (mm).
AUC, area under the ROC curve; CI, confidence interval; MCF, maximum clot firmness; NPV, negative predictive value; PPV, positive predictive value; ROC, receiver operating characteristic; SE, standard error; SEN, sensitivity; SPE, specificity.
This study’s findings indicated that fibrinogen levels and FIBTEM parameters significantly correlated with AUCs exceeding 0.857 (p < 0.001) for all calculated values corresponding to the cut-off values of FIBTEM and fibrinogen levels. The substantial agreement between MCF and fibrinogen levels (K = 0.692 and AUC = 0.905) indicated that MCF could predict increased or nonincreased fibrinogen levels. Similarly, fibrinogen levels could predict increased or not-increased FIBTEM A5 status (K = 0.656, AUC = 0.925). The AUC for patients with hypofibrinogenemia was incalculable because only four patients (2.5%) in the study had fibrinogen levels <2 g/L. Due to this very low prevalence, FIBTEM MCF showed minimal discriminative ability, with an AUC of 0.05 (95% CI not estimable), 100% sensitivity, and 1.9% specificity at the optimal cut-off of 10 mm (Youden index). These findings are presented in Supplemental File 1.
Discussion
Key findings
Our study demonstrated that FIBTEM MCF had excellent predictive capacity for hyperfibrinogenemia, with a cut-off value of 22.5 mm (AUC = 0.905). Although FIBTEM parameters were strongly correlated with plasma fibrinogen levels, they could not precisely predict absolute fibrinogen concentrations. Both FIBTEM parameters and fibrinogen levels reliably identified increased fibrinogen status (AUC = 0.883–0.905) and increased FIBTEM parameters (AUC = 0.857–0.925), respectively. These findings are consistent with previous reports.29,44 Notably, our bilateral analysis, using fibrinogen to predict FIBTEM parameters and vice versa, showed stronger correlations (R2 = 0.492–0.541) than earlier studies (R2 ≈ 0.27).29,44,45
Our study makes several significant contributions. First, we examined a sepsis-specific ICU population, which is distinct from previously studied trauma, surgical, or healthy cohorts where hemostatic profiles differ markedly. Second, we focused on hyperfibrinogenemia, an underexplored but common feature of sepsis, and established early predictive thresholds for clinical use. Third, we conducted a bidirectional analysis, demonstrating that FIBTEM parameters can predict hyperfibrinogenemia and that fibrinogen levels can estimate clot firmness, supporting the practical application of either assay when the other may be unavailable. Finally, by studying an adult Vietnamese ICU population, we fill a critical geographical and ethnic gap, acknowledging potential differences in coagulation dynamics across populations and healthcare settings.
We observed strong correlations between calculated and observed FIBTEM parameters and fibrinogen levels (r = 0.701–0.735, p < 0.001), allowing reliable classification of patients into increased or nonincreased fibrinogen and FIBTEM status, even though the percentage error exceeded 30%. This concordance was slightly more pronounced in patients with comorbidities (data not shown), further supporting the robustness of our findings.
We identified optimal FIBTEM cut-off values for predicting hyperfibrinogenemia (>4 g/L): 17.5 mm for A5, 20.5 mm for A10, and 22.5 mm for both A20 and MCF. These thresholds provide early recognition of elevated fibrinogen levels in sepsis. In contrast, most previous studies have focused on A5 and A10 cut-offs to detect hypofibrinogenemia (<1.5 g/L) in trauma or perioperative settings.33,44 To our knowledge, no prior study has reported FIBTEM-based thresholds for elevated fibrinogen in sepsis.
Comparison with other studies
Previous studies have reported moderate-to-strong correlations between FIBTEM parameters (A5, A10, A20, MCF) and plasma fibrinogen levels in trauma and surgical patients.44–50 Our study is the first to apply this approach specifically to septic patients, providing early, calculated fibrinogen estimates. Despite the strong correlations, FIBTEM values could not precisely predict absolute fibrinogen concentrations, consistent with prior work in trauma (CCC = 0.52) 29 and liver transplant populations. 51 Several factors may explain this discrepancy. Although fibrinogen is the primary determinant of MCF, other contributors, such as factor XIII, influence clot firmness; its depletion in sepsis may weaken the predictive power.52–55 We also observed a moderate positive correlation between MCF and platelet count, suggesting incomplete platelet inhibition by cytochalasin D, as previously described, 56 which may cause overestimation of MCF in thrombocytosis. Additional factors, including hematocrit and colloid administration, can alter MCF values without corresponding changes in Clauss fibrinogen levels.36,57–60 These findings highlight that FIBTEM is a functional, multifactorial test and not a perfect surrogate for absolute fibrinogen measurement.
Among the eight patients with hypofibrinogenemia (<2 g/L), bleeding events and DIC diagnoses were not systematically recorded, limiting conclusions about clinical outcomes. Nonetheless, hypofibrinogenemia is a recognized marker of advanced DIC and poor prognosis in sepsis. Given the small number of cases in our cohort, larger studies are needed to clarify the clinical implications of fibrinogen depletion in sepsis-related coagulopathy.
Implications
Although we use the terms “prediction” and “cut-off,” FIBTEM parameters do not forecast future fibrinogen levels but rather reflect real-time fibrinogen-dependent clot firmness. Thus, the association between MCF and hyperfibrinogenemia should be viewed as a surrogate marker or early indicator. The key clinical value of FIBTEM lies in its rapid turnaround, enabling bedside recognition of elevated fibrinogen levels and earlier decision-making before Clauss assay results are available.
The principal advantage of FIBTEM is its rapid turnaround; results are available within 10–15 min compared with about 1 h for the Clauss assay. In sepsis, where coagulation status can change rapidly, this time gain enables earlier recognition of hyperfibrinogenemia and facilitates timely decisions regarding anticoagulation, thromboprophylaxis, or closer monitoring. Although ROTEM devices involve significant upfront costs and higher per-test expenses, the ability to bypass laboratory delays and obtain actionable results 30–45 min sooner may improve ICU workflow, reduce unnecessary transfusions, and potentially shorten length of stay, offsetting implementation costs.
Hyperfibrinogenemia is common in sepsis,11,14–16,60 driven by up to a threefold increase in fibrinogen production. 16 It promotes thrombosis and vascular injury, 61 reduces clot permeability, and impairs fibrinolysis, contributing to a hypercoagulable state. 22 These effects have been linked to worse outcomes in sepsis and DIC.10,22,23,62 Our study demonstrates that MCF reliably detects elevated fibrinogen levels (cut-off 22.5 mm, AUC = 0.905), offering a rapid bedside tool to recognize this prothrombotic state. Although no guidelines currently recommend anticoagulation specifically for hyperfibrinogenemia, our findings highlight its potential role in identifying septic patients at increased risk of thrombosis. Current Surviving Sepsis Campaign guidelines already recommend pharmacological thromboprophylaxis with low molecular weight or unfractionated heparin in critically ill patients with sepsis unless contraindicated. In this context, FIBTEM MCF could be helpful for early recognition of patients with hyperfibrinogenemia who may particularly benefit from the timely implementation of thromboprophylaxis. 63
The proposed MCF cut-off of 22.5 mm was derived from a single Vietnamese ICU cohort and showed excellent diagnostic performance (AUC = 0.905). However, external validation in larger, multicenter, and ethnically diverse populations is needed, as fibrinogen-FIBTEM dynamics may vary with ethnicity, sepsis etiology, and institutional practices.
Limitations
This study has several limitations. It was a single-center, retrospective secondary analysis with a limited sample size and no a priori power calculation, which restricts its external validity, despite a post hoc power analysis showing high statistical power. The study focused on correlations between FIBTEM parameters and fibrinogen levels, but did not evaluate clinical outcomes, such as thrombosis or bleeding. The small number of hypofibrinogenemia cases (<2 g/L) precluded meaningful subgroup analysis. Additionally, no reference data exist for large cohorts of Vietnamese adults with sepsis, which may limit generalizability. Finally, our proposed MCF cut-off of 22.5 mm lacks external validation and should be interpreted cautiously until confirmed in multicenter, ethnically diverse populations. Nonetheless, our findings support the potential utility of early FIBTEM parameters (A5, A10, A20) as rapid surrogates for fibrinogen status in sepsis.
Conclusion
FIBTEM MCF showed a strong correlation with plasma fibrinogen levels in patients with sepsis and reliably identified hyperfibrinogenemia using practical cut-off values. While it does not predict future fibrinogen levels, it provides a real-time reflection of fibrinogen-dependent clot firmness. Its rapid turnaround, compared with the Clauss assay, makes it a valuable bedside tool for the early recognition of prothrombotic states and guiding timely coagulation management, particularly in time-sensitive ICU settings or where laboratory testing is delayed or unavailable. Future studies should validate the proposed MCF cut-off in external cohorts and evaluate its prognostic value for outcomes such as thrombosis and bleeding.
Supplemental Material
sj-docx-1-tah-10.1177_20406207251399472 – Supplemental material for Exploring the interchangeable roles of fibrinogen and FIBTEM in patients with sepsis
Supplemental material, sj-docx-1-tah-10.1177_20406207251399472 for Exploring the interchangeable roles of fibrinogen and FIBTEM in patients with sepsis by Hanh-Duyen Bui-Thi, Tuan-Anh Nguyen, Khoa Nguyen-Dang, Kien Gia To, Tai Tran-Quoc and Minh-Khoi Le in Therapeutic Advances in Hematology
Supplemental Material
sj-docx-2-tah-10.1177_20406207251399472 – Supplemental material for Exploring the interchangeable roles of fibrinogen and FIBTEM in patients with sepsis
Supplemental material, sj-docx-2-tah-10.1177_20406207251399472 for Exploring the interchangeable roles of fibrinogen and FIBTEM in patients with sepsis by Hanh-Duyen Bui-Thi, Tuan-Anh Nguyen, Khoa Nguyen-Dang, Kien Gia To, Tai Tran-Quoc and Minh-Khoi Le in Therapeutic Advances in Hematology
Supplemental Material
sj-docx-3-tah-10.1177_20406207251399472 – Supplemental material for Exploring the interchangeable roles of fibrinogen and FIBTEM in patients with sepsis
Supplemental material, sj-docx-3-tah-10.1177_20406207251399472 for Exploring the interchangeable roles of fibrinogen and FIBTEM in patients with sepsis by Hanh-Duyen Bui-Thi, Tuan-Anh Nguyen, Khoa Nguyen-Dang, Kien Gia To, Tai Tran-Quoc and Minh-Khoi Le in Therapeutic Advances in Hematology
Footnotes
Acknowledgements
We appreciate the employees of the Intensive Care and Laboratory departments for their help in conducting this study. We also acknowledge Medcomtech Joint Stock Company’s sponsorship, which provided the reagent for the ROTEM test.
Declarations
Supplemental material
Supplemental material for this article is available online.
References
Supplementary Material
Please find the following supplemental material available below.
For Open Access articles published under a Creative Commons License, all supplemental material carries the same license as the article it is associated with.
For non-Open Access articles published, all supplemental material carries a non-exclusive license, and permission requests for re-use of supplemental material or any part of supplemental material shall be sent directly to the copyright owner as specified in the copyright notice associated with the article.