
Abstract
Background:
Eltrombopag (ELT), a thrombopoietin receptor agonist (TPO-RA), has been approved for relapsed/refractory aplastic anemia (AA). However, data on avatrombopag (AVA), another TPO-RA, are limited, and the comparisons between the two TPO-RAs are lacking.
Objectives:
We aimed to compare the efficacy and safety between ELT and AVA in relapsed/refractory AA patients.
Design:
In this retrospective study, patients with relapsed/refractory AA who had been treated with ELT (N = 45) or AVA (N = 30) alone and had compatible baseline hematological parameters were compared.
Methods:
Data from patients diagnosed with acquired AA were retrospectively collected. All patients were refractory/relapsed to standard immunosuppressive therapy (IST) for at least 6 months before ELT or AVA. Patients had to be treated with ELT or AVA alone for at least 6 months before evaluation if they did not respond. Baseline characteristics, overall response (OR), complete response (CR), relapse, adverse events, and factors that may affect efficacy were analyzed.
Results:
Of the 75 patients enrolled, 45 received ELT and 30 received AVA. Patients with AVA had a higher percentage of abnormal liver or renal function than those with ELT (p = 0.036). No significant difference was found in the OR/CR rate in the first/second/third/sixth month between the two cohorts (p > 0.05). Patients treated with AVA had a shorter median time to response than those treated with ELT (p = 0.012) and had a higher platelet level in the second month (p = 0.041). AVA had fewer adverse events than ELT (p = 0.046). Under compatible follow-up time (p = 0.463), no difference was found between the ELT and AVA cohorts in relapse (p = 1.000) or clone evolution (p = 0.637). No predictive factors for OR and CR in the sixth month were found for either ELT or AVA.
Conclusion:
With worse liver or renal function, AVA had a similar OR/CR rate but a shorter median time to response and fewer adverse events for patients with relapsed/refractory AA.
Introduction
Aplastic anemia (AA) is a bone marrow failure syndrome characterized by bone marrow hypoplasia and cytopenia. 1 Anti-thymocyte globulin (ATG) combined with cyclosporin A (CsA) is the standard first-line immunosuppressive therapy (IST). It is recommended for transfusion-dependent non-severe aplastic anemia (NSAA) patients, severe aplastic anemia (SAA) patients older than 50 years old, or younger patients with no suitable donors. Allogeneic hematopoietic stem cell transplantation is recommended for younger patients with human leukocyte antigen (HLA)-identical donors. 2
By binding to the thrombopoietin receptor, thrombopoietin receptor agonists (TPO-RAs) can block the inhibitory effect of interferon-γ, stimulating megakaryocyte growth and platelet production.3,4 Eltrombopag (ELT), an oral TPO-RA, was originally developed for immune thrombocytopenia (ITP) and then proven to promote trilineage hematopoiesis in patients with AA.5,6 Olnes et al. 7 performed a phase II study on 25 patients with refractory AA and showed a 44% hematologic response in the third month. A real-world study in Europe showed an overall response rate (ORR) of 62% in patients with AA (moderate, severe, and very severe). 8 Hepatotoxicity, however, restricts the use of ELT for some AA patients. Avatrombopag (AVA), another oral TPO-RA, has been approved for the treatment of thrombocytopenia in adult patients with chronic liver disease. 9 Unlike ELT, AVA does not have hepatotoxicity and is an appropriate option for patients with liver function abnormalities. 10 A case report from China 11 reported successful treatment of SAA by AVA. On the other hand, a real-world study in China 12 showed an ORR of 59% in patients with chemoradiotherapy-induced AA. Different pharmacokinetics of ELT and AVA have been presented thus far.13,14 To date, few data about AA patients treated with AVA have been published. Furthermore, few alternative therapies other than ELT are available for AA patients who are relapsed or refractory to first-line IST, particularly those with abnormal liver function.
Hence, we retrospectively collected ELT data from 45 patients and AVA data from 30 patients with relapsed/refractory AA in a single center in China. The efficacy, safety, and possible predictive factors were analyzed.
Methods
Patients
Data from patients with acquired AA who were relapsed/refractory to IST and had been treated with ELT or AVA in Peking Union Medical College Hospital (PUMCH) from June 2018 to March 2022 were collected retrospectively. AA patients who met the inclusion criteria were consecutively recruited into our retrospective study. The two treatment cohorts were matched with baseline clinical characteristics including age, male proportion, time from diagnosis to ELT/AVA treatment, SAA/NSAA proportion, refractory/relapse ratio, the proportion of previous CsA/ATG + CsA treatment, hemoglobin, platelet count, absolute neutrophil count, absolute reticulocyte count, ferritin, and paroxysmal nocturnal hemoglobinuria (PNH) clone, before ELT or AVA treatment. Patients should meet the following criteria before selection: 18 years of age or older; with a confirmed diagnosis of SAA or NSAA; patients with PNH clone size <50%; did not respond or relapsed to at least a full dose of CsA for at least 6 months ± ATG (only for those with SAA); patients had to be treated with ELT or AVA for at least 6 months if not responded; patients did not receive hematopoietic stem cell transplantation before/after ELT or AVA; had follow-up appointments for at least 6 months; had relatively complete medical records, and were willing to provide the information. The reporting of this study conforms to the Strengthening the Reporting of Observational Studies in Epidemiology (STROBE) statement. 15
Treatment regimens
All the enrolled patients had been treated with CsA 3–5 mg/kg/day and maintained the trough concentration of 100–200 μg/mL. Patients with SAA had been treated with CsA + rabbit ATG 3.5 mg/kg/day for 5 days before ELT/AVA. They did not respond or relapsed after at least 6 months of CsA. The dose assignment of ELT was performed based on the FDA label and a phase II study in moderate AA. 16 The dose assignment of AVA was performed according to the FDA label. ELT was started at 25 mg/day for 2 weeks, increased every 2 weeks to a maximum of 150 mg/day (25–50–100–150 mg/day), and tapered gradually (25 mg/day every 3 months) after the best response was achieved. AVA was started at 20 mg/day for 2 weeks, increased every 2 weeks to a maximum of 60 mg/day (20–40–60 mg/day), and tapered gradually (20 mg/day every 3 months) after the best response was achieved. Other treatments included transfusion if hemoglobin was <60 g/L, platelets <20 × 109/L, or granulocyte colony-stimulating factor (G-CSF) (5 μg/kg/day) if neutrophils were <0.5 × 10⁹/L.
Clinical data, including sex, age, symptoms, signs, complete blood cell count, serum biochemistry such as liver and renal functions, ferritin level, bone marrow smear, biopsy, chromosomal analysis, myeloid malignant gene mutations, laboratory inspection results, and treatment outcome, were collected before and after therapy. All the treatment-related side effects and the disease status were obtained from the medical records or, very occasionally, from the telephone interview of the patients and their relatives. The response was assessed after 1, 2, 3, and 6 months of therapy and in the last follow-up.
Assessment of response and adverse events
Complete response (CR) and partial response (PR) were defined according to the guidelines 2 : (1) CR: normal hemoglobin (Hgb), absolute neutrophil count (ANC) > 1.5 × 10⁹/L, platelet (PLT) > 100 × 109/L; (2) PR: (A) free from blood transfusion (previously blood transfusion-dependent); (B) at least one lineage restored to normal or twice increased compared with the baseline; (C) Hgb increased >30 g/L (<60 L before treatment), ANC increased >0.5 × 10⁹/L (<0.5 × 10⁹/L before treatment), PLT increased >20 × 109/L (<20 × 109/L before treatment) compared with the baseline. (D) No longer meets the criteria for severe disease (previously diagnosed with SAA). No response (NR) was defined as not having any of the above responses. Adverse events were graded according to the Common Toxicity Criteria of the National Cancer Institute, version 5.0.
Statistical analysis
The sample size was calculated based on the ORR in the sixth month. The non-inferiority or superiority model was used. Assume a response rate of 60% in patients treated with AVA and 50% in patients treated with ELT, a response rate difference of 20% as the non-inferiority or superiority margin, and a sampling ratio of 0.67. With a one-sided significance level of 0.025 and a power of 90%, a sample size of 72 patients was needed. Thus, this study determined the follow-up period and enrolled 30 patients in the AVA cohort and 45 patients in the ELT cohort.
Descriptive statistics are presented as frequencies and were compared using the chi-square test. Continuous variables were expressed as median (range) and compared by independent samples t-test (normal distribution) and Wilcoxon Mann–Whitney test (skewed distribution). Factors related to efficacy were analyzed by binary logistic regression. All reported p values were two-sided.
Results
A total of 75 patients were enrolled. A total of 45 patients were treated with ELT. The median age at ELT initiation was 53 (range, 18–81) years, with 15 (33.3%) males, and the median time from diagnosis to ELT treatment was 40 (range, 6–387) months. A total of 40 (88.9%) patients had NSAA, and 5 (11.1%) had SAA. In total, 24 (53.3%) were relapsed and 21 (46.7%) were refractory.
A total of 30 patients were treated with AVA. The median age at AVA initiation was 57 (range, 18–82) years, with 11 (36.7%) males, and the median time from diagnosis to AVA treatment was 26 (range, 6–502) months. A total of 26 (86.7%) patients had NSAA, and 4 (13.3%) had SAA. In total, 11 (36.7%) were relapsed and 19 (63.3%) were refractory.
No significant difference was found between the ELT and AVA cohorts in baseline characteristics such as age, male proportion, time from diagnosis to ELT/AVA treatment, SAA/NSAA proportion, refractory/relapse ratio, the proportion of previous CsA/ATG + CsA treatment, hemoglobin, platelet count, absolute neutrophil count, absolute reticulocyte count, ferritin, PNH clone, and time of ELT/AVA treatment and follow-up. However, more patients in the AVA cohort had baseline abnormal liver or renal function than those in the ELT cohort [11 (36.7%) versus 7 (15.6%), p = 0.036, Table 1].
Baseline characteristics of patients enrolled.

Abnormal liver function was assessed by alanine aminotransferase (ALT) or serum total bilirubin (STB) above the upper normal limit.
Abnormal renal function was assessed by creatinine (Cr) concentration above the upper normal limit.
Abnormal liver and renal functions were assessed by ALT or STB or Cr concentration above the upper normal limit.
AA, aplastic anemia; ATG, anti-thymocyte globulin; AVA, avatrombopag; CsA, cyclosporin A; ELT, eltrombopag; NSAA, non-severe aplastic anemia; PNH, paroxysmal nocturnal hemoglobinuria; SAA, severe aplastic anemia.
Response
The median ELT treatment duration was 12 (range, 6–31) months, and the median AVA treatment duration was 10 (range, 6–26) months (p = 0.213). The median time of follow-up was 13 (range, 6–31) months in the ELT cohort and 12 (range, 6–26) months in the AVA cohort (p = 0.463). The median time to overall response (OR) was 3 (range, 1–9) months and 1 (range, 1–6) month in the ELT and AVA cohorts (p = 0.012), respectively.
A total of 27 (60.0%) of the 45 patients had a response to ELT, and 18 (60.0%) of the 30 patients had a response to AVA. There was no significant difference in the ORR in the first/second/third/sixth month and in the last follow-up (20.0%/40.7%/40.0%/51.4%/57.8% versus 41.7%/40.9%/47.8%/55.2%/53.3%, p > 0.05) or complete response rate (CRR) in the first/second/third/sixth month and in the last follow-up (16.0%/22.2%/15.0%/11.4%/24.4.% versus 16.7%/13.6%/4.3%/20.7%/30.0%, p > 0.05) between the two cohorts (Table 2 and Figure 1).
Response at different time points for ELT and AVA cohorts.
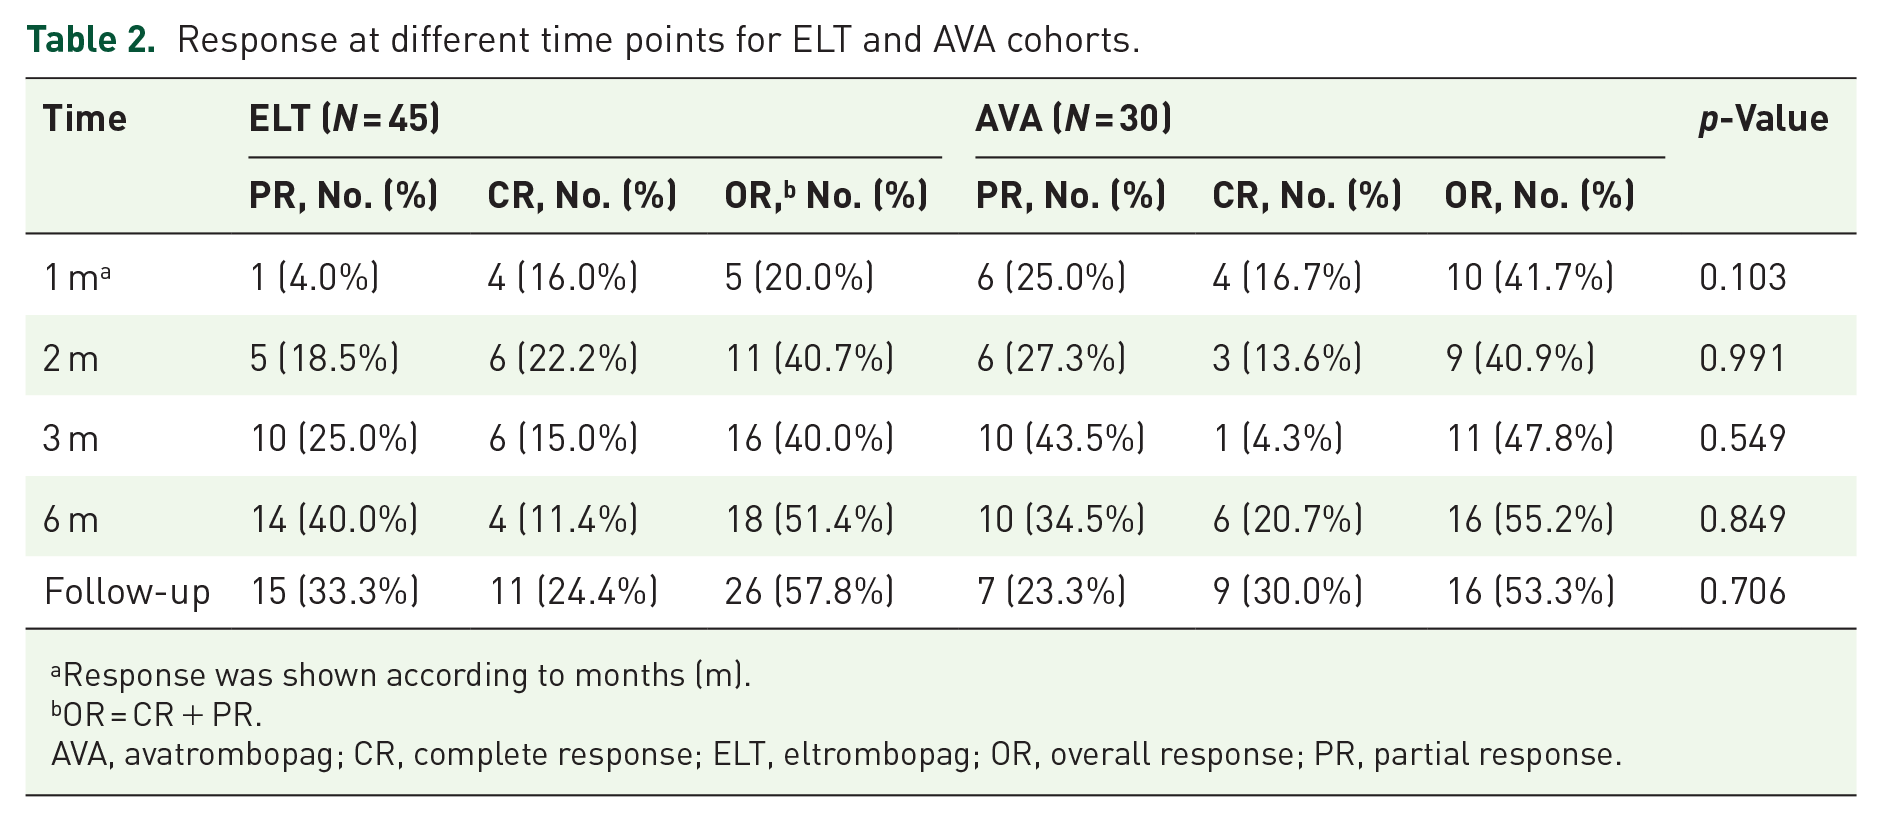
Response was shown according to months (m).
OR = CR + PR.
AVA, avatrombopag; CR, complete response; ELT, eltrombopag; OR, overall response; PR, partial response.

Response to ELT/AVA at different time points. The 100% stacked column was constructed by the number of CR, PR, and NR each month to show the percentages of CR, PR, and NR patients. (a) The percentages of patients who responded in the first, second, third, sixth months, and in the last follow-up in the ELT cohort and (b) the percentages of patients who responded in the first, second, third, sixth months, and in the last follow-up in the AVA cohort. No difference was found between the two cohorts in ORR or CRR at any time. Analysis visits were shown according to months (m).
A total of 25 patients (55.5%) in the ELT cohort and 13 patients (43.3%) in the AVA cohort achieved a platelet response at different time points (p = 0.300). With compatible baseline platelet levels, patients treated with ELT and AVA who had a platelet response had similar platelet counts in the first month (47 × 109/L (range, 9–173) versus 23 × 109/L (range, 5–404), p = 0.282). However, the median platelet level was higher in the AVA cohort in the second month (95 × 109/L (range, 10–202) versus 30 × 109/L (range, 9–171), p = 0.041) but became compatible in the third/fourth/fifth/sixth month and in the last follow-up (61 × 109/L (range, 20–135) versus 49 × 109/L (range, 7–613), p = 0.389; 83 × 109/L (range, 21–109) versus 44 × 109/L (range, 9–253), p = 0.411; 50 × 109/L (range, 38–157) versus 38 × 109/L (range, 13–140), p = 0.394; 76 × 109/L (range, 19–190) versus 84 × 109/L (range, 15–370), p = 0.801; 124 × 109/L (range, 38–246) versus 85 × 109/L (range, 5–336), p = 0.275) (Figure 2 and Table 3).

Changes in median platelet level over time in platelet responders. The median platelet level values over time (from baseline to the last follow-up) of platelet responders of the ELT cohort (blue) and avatrombopag cohort (orange) were constructed. The difference in median platelet level between the two cohorts reached the highest in the second month [30 × 109/L (range, 9–171) versus 95 × 109/L (range, 10–202), p = 0.041] but was compatible at other time points. Error bars indicate the interquartile range. Analysis visits were shown according to month (m).
Changes in median platelet level over time.

AVA, avatrombopag; ELT, eltrombopag; m, month.
Adverse events
Treatment-related adverse events (of any grade) seemed higher in patients with ELT, than in those with AVA (53.3% versus 30.0%, p = 0.046, Table 4). A total of 31.1% and 11.1% of patients treated with ELT suffered from liver dysfunction and renal dysfunction, respectively, while 20.0% and 0% of patients treated with AVA suffered from liver dysfunction and renal dysfunction, respectively (p = 0.286, p = 0.079). The most frequent adverse events (of any grade) were gastrointestinal disorder (17.8% versus 6.7%, p = 0.298), alanine aminotransferase increase (17.8% versus 10.0%, p = 0.549), and blood bilirubin increase (13.3% versus 10.0%, p = 0.942) for the ELT and AVA cohorts, respectively. There were no differences in the following aspects between the two cohorts: three patients (6.7%) had National Cancer Institute Common Toxicity Criteria grade 3 adverse events, including gastrointestinal disorder and blood bilirubin increase, two patients (6.7%) had a dose reduction due to gastrointestinal and cardiac disorder and one patient (1.8%) discontinued the treatment due to gastrointestinal disorder in the ELT cohort. Two (6.7%) had grade 3 adverse events, including gastrointestinal disorder and alanine aminotransferase increase, one patient (3.3%) had a dose reduction due to tremor, and one patient (3.3%) discontinued the treatment due to gastrointestinal disorder in the AVA cohort.
Adverse events of ELT and AVA cohorts.

N, number of patients with adverse events.
Liver dysfunction, patients with adverse events of alanine aminotransferase increase or blood bilirubin increase.
Renal dysfunction, patients with adverse events of creatinine increase.
Indicated the difference in adverse events of any grade.
Relapse, clone evolution, and survival
The median time of follow-up was 13 (6–31) months in the ELT cohort, and 12 (6–26) months in the AVA cohort (p = 0.463). Two patients (6.7%) treated with AVA interrupted the dose because of a CR. In the ELT cohort, 4/27 patients (14.8%) relapsed in the 3rd, 10th, 18th, and 29th months of follow-up. One patient developed a new chromosomal abnormality [t(10;11) (p12;q21)] in the 21st month of follow-up, one patient experienced monosomy 7 abnormality and progressed to myelodysplastic neoplasm in the 12th month of follow-up, one had a 1% increase in myeloblasts and had BCOR, DNMT3A, RB1, and GNAS somatic mutations in the 13th month of follow-up, and one had an increase in PNH clone size from 0% to 3% in the seventh month of follow-up and then from 3% to 5% in the ninth month of follow-up.
In the AVA cohort, 2/18 patients (11.1%) relapsed in the 6th and 24th months of follow-up. One patient developed a complex chromosomal abnormality t(4;11) (p16,q13) and t(6;7) (p21,q32) in the fifth month. No significant difference was found in relapse rate (p = 1.000) or clone evolution rate (p = 0.637) between the two cohorts.
Factors that may predict response
Factors that may predict the OR and CR rates in the sixth month were further analyzed. Age, sex ratio, time from diagnosis to ELT/AVA treatment, disease status before ELT/AVA, baseline hemoglobin, platelet count, absolute neutrophil count, absolute reticulocyte count, serum ferritin, and PNH clone were selected. No factors were found to be predictable for either ELT or AVA (p > 0.05).
Discussion
There have been many reports on ELT alone or adding ELT to IST in the treatment of refractory/relapsed or newly diagnosed AA, either for SAA or NSAA.7,16 –18 Comparisons of different TPO-RAs, such as ELT and romiplostim from various aspects have also been reported. 19 AVA was effective in some case reports in patients with SAA with liver dysfunction, 11 or refractory AA switched from other TPO-RAs. 20 Recently, AVA was effective in patients with chemoradiotherapy-induced AA, 12 and phase II trials of AVA in combination with immunosuppressive therapy in treatment-naive and relapsed/refractory SAA are underway. 21 However, since AVA has not been approved in the treatment of AA, few cases have been reported thus far, and there is limited knowledge about AVA for newly diagnosed AA or refractory/relapsed AA, let alone the comparison with other TPO-RAs. Therefore, our study is the first report for the comparison of the two TPO-RAs and showed the outline of AVA on refractory/relapsed AA in a relatively large patient cohort. Patients in the AVA cohort had more abnormalities in renal and liver functions at baseline, which was probably one of the reasons for choosing AVA, and had similar ORRs in the first, second, third, and sixth months, and in the last follow-up compared with patients treated with ELT.
Olnes et al. 7 and Desmond et al. 6 demonstrated an ORR of ELT of 44% (11/25) and 40% (17/43) in patients relapsed or refractory to IST. Our ORR was marginally higher. However, their patients were all SAA patients who had poor hematopoiesis before ELT. On the other hand, our study in the ELT cohort had a similar ORR in the sixth month to those of Yamazaki et al. 17 and Fan et al., 16 who reported an ORR of approximately 50% in NSAA/SAA patients. There are very little data on AVA, but one report by Chi et al. 12 showed that patients with chemoradiotherapy-induced AA achieved an ORR of 58.8% and a CRR of 23.5% in the sixth month, which seemed higher than our report. Nevertheless, their patients were quite different, since they had shorter disease durations, fewer previous treatments, and were secondary to malignant tumors.
Previous studies22 –24 in patients with chronic ITP indicated that AVA tended to raise platelets more rapidly, but ELT tended to maintain the increase in platelets longer. In phase III and EXTEND studies of ELT in patients with ITP,22,23 the median platelet count was ⩾50 × 109/L at week 2 and was maintained until week 250. In the phase III study of AVA in patients with ITP, 24 the median platelet count was ⩾50 × 109/L at day 8 and was maintained until week 62. Similarly, in our study, patients treated with AVA had a shorter time to response at 1 (1–6) months compared with 3 (1–9) months in patients treated with ELT (p = 0.012). Not only the faster speed of platelet increase, but patients with platelet response also had a higher platelet count in the second month in the AVA cohort, similar to what had been observed in ITP. It seemed that the time to response was longer in AA than in ITP, as suggested by our results. This is also true for other TPO-RAs, probably due to the difference in different disease characteristics. The median time to response of romiplostim was 37 (36–44) days in AA patients, while the median platelet count was ⩾50 × 109/L at week 3 in ITP patients.25,26 Patients with AA have more megakaryocytic hypoplasia and poorer platelet production function than those with ITP. 27 The effect duration comparison of ELT and AVA was difficult due to the relatively short time of follow-up.
It was reported by Gibiansky et al. 28 that compared with other races, the clearance of ELT was 33% lower, and the plasma exposure was 87% higher in East Asia. Therefore, referring to the phase II study of ELT in moderate AA (50–300 mg/day in non-Asian population, 25–150 mg/day in East Asian population), we assigned ELT at an initial dose of 25 mg/day and a maximum dose of 150 mg/day. However, no clinically important differences were found in the pharmacokinetics of AVA between Asian and non-Asian populations. 29 Since the optimal dose and adjustment of AVA remained unknown in AA patients, we assigned AVA at an initial dose of 20 mg/day and a maximum dose of 60 mg/day.
A total of 53% of patients treated with ELT, compared with 30% treated with AVA, had adverse events of any grade in our study (p = 0.046). The adverse event rate of ELT in our study was similar to the result reported by Lengline 30 in patients with SAA. There have been few reports of AVA administration in AA patients. Nevertheless, studies in patients with thrombopenia showed that the reported rates of adverse events varied from 10 to 60%.14,24,31 Hepatotoxicity is a common adverse event of ELT. Lengline et al. 30 reported that 18.2–28.6% of non-Asian patients treated with ELT experienced elevated transaminase levels, and Yamazaki et al. 17 also reported that 23.8% of Asian patients experienced an abnormal hepatic function in Asians. A total of 31.1% of patients treated with ELT experienced liver dysfunction in our study. ELT was given at a maximum dose of 150 mg/day in our study according to the FDA label of ELT and a phase II study 16 in moderate AA, which was higher than some studies at a maximum dose of 75 mg/day in the Asian population.32,33 That may partly correlate with the rise of liver toxicities in the ELT cohort. On the other hand, AVA is thought to have little liver toxicities and can be used at a full dose in thrombocytopenia with chronic liver disease. 31 There is no significant difference in response rate or adverse event rate between ethnic groups. 34 In this respect, our result may give a way for those who cannot tolerate a high dose of ELT.
Desmond et al. 6 reported that 17.6% (3/17) of patients relapsed during ELT treatment. A total of 14.8% (4/27) of patients treated with ELT relapsed in our study, which was similar to the result of the previous study. However, Fan et al. reported that 41.2% (7/17) of patients relapsed after ELT discontinuation. Their relapse rate was higher, possibly because they had a longer follow-up time [16 (range, 4–62) months in all patients and 27 (range, 6–62) months in patients with a response]. In our study, 11.1% (2/18) of patients treated with AVA relapsed, which was also similar to the 15% relapse rate reported by Chi et al. 12 in chemoradiotherapy-induced AA and the relapse rate of ELT. Recent studies suggested that ELT may promote the expansion of dormant preexisting clones with an aberrant karyotype and a high rate of chromosome 7 abnormalities.6,35 AVA, another TPO-mimetic, might have similar results. In our study, one patient was found to have monosomy 7 abnormalities and transform to myelodysplastic syndrome (MDS) after 12 months of ELT treatment, and one patient had complex karyotype abnormalities after 21 months of ELT treatment. Two patients had PNH clone increases and gene mutations after 7 and 13 months of ELT treatment. One patient experienced complex karyotype abnormalities after 5 months of AVA treatment. The rate of cytogenetic abnormalities was lower in our study than the 18% reported by Winkler et al. 35 . Since most of our patients had moderate AA, they had a relatively lower clonal evolution rate. Nevertheless, the occurrence of monosomy 7 abnormalities partially supported the findings of previous studies. Therefore, both ELT and AVA should be used in those with a low risk of myeloid malignant clone potential under long-term observation.
No predicting factor was found in our study for ELT or AVA. According to a previous study in patients with ELT combined with IST, 36 a better OR seems to be associated with a higher absolute reticulocyte count and absolute neutrophil count. However, the patients in our study were mainly moderate AA patients with relatively better hematopoiesis. The median absolute reticulocyte count and absolute neutrophil count in patients treated with ELT in our study were 65.8 × 10⁹/L and 1.50 × 10⁹/L, respectively, which were vastly higher than those in Zaimoku’s study (18.8 × 10⁹/L, and 0.28 × 10⁹/L, respectively). 36 No predictive factors for AVA treatment were previously reported in AA patients.
Our study still had some limitations. Due to the off-label use of AVA in AA, only patients with abnormal liver or renal function or at risk of liver or renal impairment were chosen for AVA, limiting the number of patients. The study was retrospective, and patients in the ELT cohort had to have comparable baseline characteristics with those in the AVA cohort, which may cause bias. The heterogeneous severity of diseases and previous treatments may also cause some deviation. The limited number of patients and relatively short follow-up time made the calculation of relapse, clonal evolution, and survival less accurate. Even so, our study showed that AVA may have compatible efficacy with ELT in patients with relapsed/refractory AA, even with poorer initial liver and renal functions. AVA may have quicker and probably higher short-term efficacy in platelet response, which may be important for those with a severe bleeding tendency or a meager platelet count. In addition, AVA had fewer side effects. Collectively, AVA may be an option for those with unfit or urgent refractory/relapsed AA.
Conclusion
Even in patients with worse initial hepatic and renal functions, AVA may have comparable efficacy to ELT in relapsed/refractory AA. AVA may have a quicker and probably higher short-term efficacy in platelet response and fewer side effects. Therefore, AVA may be feasible for relapsed/refractory AA patients who have a bleeding tendency and for whom other TPO-RAs or immunosuppressants are unsuitable.