
Abstract
Background
Cephalometric features have been identified as phenotypic traits of individuals with obstructive sleep apnoea (OSA). However, few studies have investigated how cephalometric parameters varied with OSA severity, especially in the Asian population.
Objectives
The aim of this study was to investigate the relationship between cephalometric parameters and severity of OSA in the Southeast Asian Chinese population. A novel cephalometric measurement, length of soft palate below the functional occlusal plane, was also studied.
Methods
In this retrospective cross-sectional study of 113 Southeast Asian Chinese patients with OSA diagnosed by overnight polysomnography, the association of cephalometric parameters with the apnoea-hypopnoea index (AHI) was evaluated, controlling for age, gender and body mass index (BMI). STROBE guidelines were used in this study.
Results
Positive association was found between age and AHI (Median Regression Coefficient = 0.26; 95% CI 0.07 to 0.44; p = 0.006). The distance of hyoid bone to mandibular plane was positively associated with AHI (Median Regression Coefficient = 0.58; 95% CI 0.05 to 1.11; p = 0.032), but the correlation did not reach statistical significance after Bonferroni correction (p = 0.64) or adjustment for age, gender and BMI (p = 0.106). Median regression analyses revealed a statistically significant negative correlation between facial axis angle and AHI (Median Regression Coefficient = −0.53; 95% CI - 1.04 to −0.01; p = 0.046), after adjusting for age, gender and BMI.
Conclusion
This study indicated that AHI was positively associated with age and negatively associated with facial axis angle.
Introduction
Obstructive sleep apnoea (OSA) is the most common form of sleep-disordered breathing (SDB). A report by the American Academy of Sleep Medicine (AASM) in 2016 estimated that 80% of individuals suffering from moderate-to-severe OSA were unaware and undiagnosed. 1 In Singapore, among patients with apnoea-hypopnoea index (AHI) of above 15, 91% of them were previously undiagnosed. 2 This underscores the need for greater awareness and improvement in assessment tools.
Craniofacial features relating to OSA have been investigated in various studies, many which involved the evaluation of lateral cephalograms (LC).3–7 Traditionally used as a dental radiograph, the LC is a simple, inexpensive, and easily accessible imaging technique. Cephalometric analyses allow clinicians to objectively evaluate and quantify two-dimensional structures of a patient. This may provide insights into the possible anatomical features related to the pathophysiology of OSA. In 1983, Riley and colleagues highlighted the value of LC in demonstrating mandibular deficiencies. The authors also proposed that the soft palate length, hyoid bone position and posterior airway dimensions were useful indicators. 8
Other cephalometric parameters that have been suggested to correlate with the presence of OSA and disease severity include a shorter cranial base, reduced cranial base angle, micrognathia, bimaxillary retrusion, inferiorly positioned hyoid bone, thicker and longer soft palate, and increased airway length.9–12 However, results from later studies investigating the relationship between cephalometric parameters and OSA have been equivocal and inconsistent. 6 This may be due to differences in study population, study methodology, and cephalometric analyses used. It has, however, been noted that Asian OSA patients generally present with more severe craniofacial restriction,13–16which contributes to narrowing of the pharyngeal airway and consequently development of OSA.
The purpose of this study was to investigate the relationship between cephalometric parameters with severity of OSA in the Southeast Asian Chinese population. In addition, a novel cephalometric parameter, the length of soft palate below occlusal plane, was included in this study. This measurement was added as empirical observations suggest that OSA patients have long soft palates extending beyond their occlusal plane. 17
Methods
Subjects
The study followed the STROBE statement checklist and was a retrospective cross-sectional study. 311 consecutive patients with OSA were screened at the National Dental Centre Singapore (NDCS) Sleep Clinic between 1st October 2007 and 31st October 2017. 113 patients met the inclusion criteria for the study, which were: • Southeast Asian Chinese patients, aged 18 years and above; • OSA patients (based on Level 1 polysomnography (PSG) data of AHI ≥ 5 events/h); • LC radiograph; • Patients with syndromes and/or cleft and craniofacial abnormalities; • Patients with prior nasal, oral or pharyngeal soft tissue surgery; • Patients who are edentulous; and/or • Patients with inadequate medical records and/or poor quality lateral cephalometric radiographs.
Records of these 113 patients were anonymised. The research protocol was approved by the SingHealth Institutional Review Board (IRB) (CIRB Reference number: 2018/2053).
Data collection
PSG data
All participants underwent Level 1 PSG studies. The age, body weight, height and AHI from the PSG reports were extracted for this study. The participants were classified based on severity of OSA, in accordance to the criteria by the AASM: mild (AHI 5–14.9 events/h), moderate (AHI 15–29.9 events/h) and severe (AHI ≥ 30 events/h). 18
Imaging protocol
LCs were obtained as part of standard clinical investigation at a single institution (NDCS), using the GENDEX Orthoralix® 9200 DDE (Gendex Dental Systems, Hatfield, PA, USA) with a standardised setting: 76-80 kV, 7 mA, with resolution of 96 μm image pixel size and 8 seconds exposure time.
All participants were positioned according to standardised guidelines during LC image acquisition. The participants were standing upright with heads positioned in natural head posture, the mid-sagittal planes were parallel to the film and perpendicular to the x- ray beam. Lips were in repose and the teeth were in centric occlusion. Calibration of the LC machine was done according to manufacturer’s instructions for projection enlargement. Magnification was in the ratio of 1:1, corroborated by the measurement scale projected in the LC image.
Cephalometric analysis
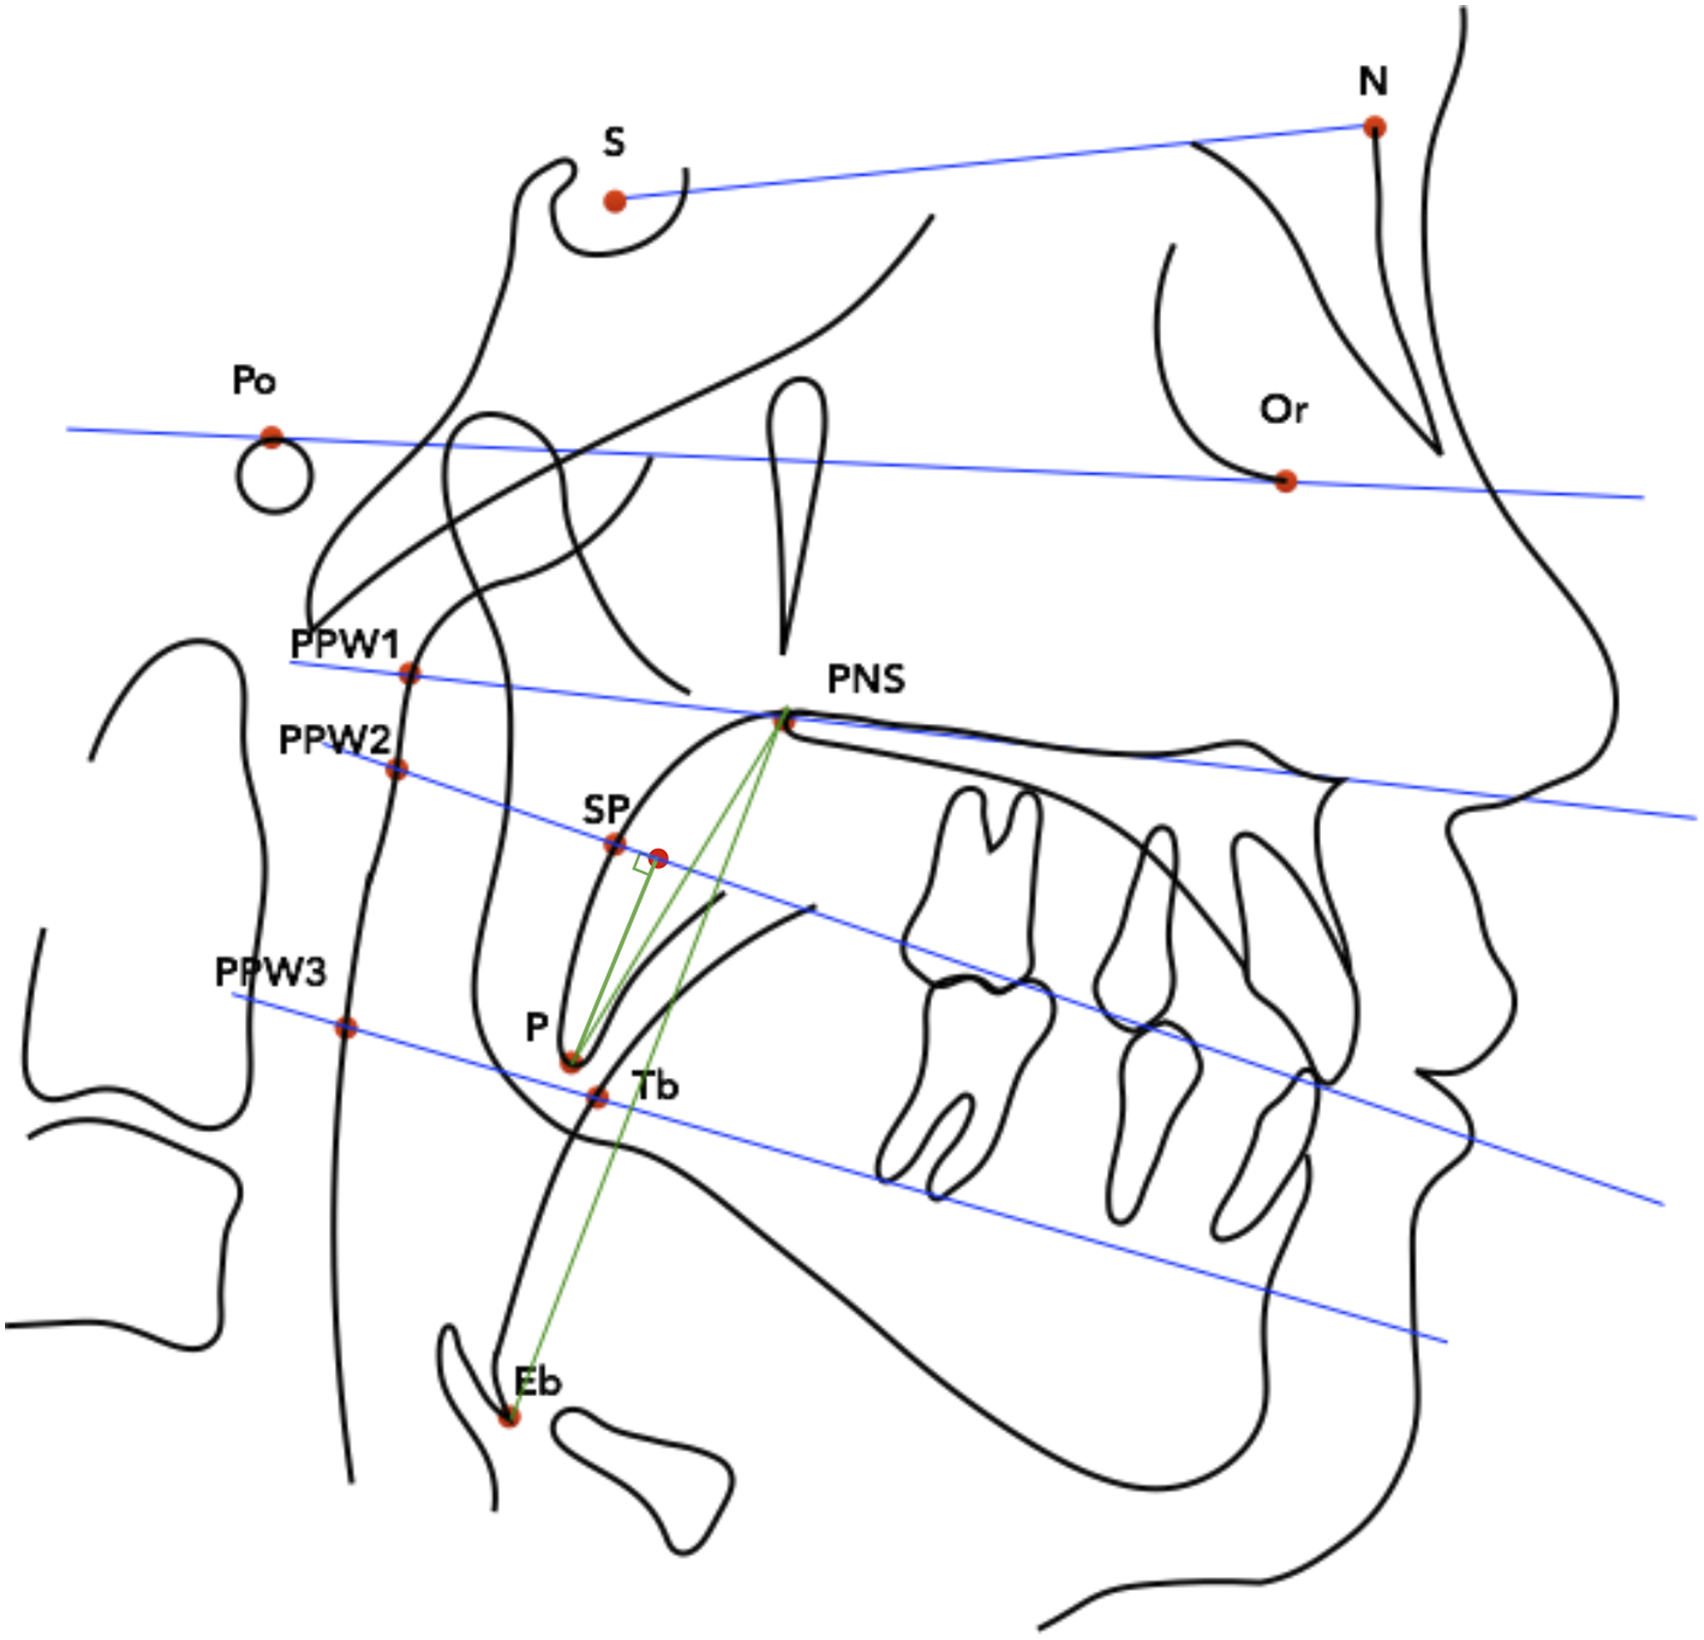
19 standard cephalometric parameters were recorded (Figures 1 and 2).19–21 A novel measurement, the vertical distance of the soft palate tip below the functional occlusal plane (P-FOP), was also measured (Figure 2). The parameters were categorised into cranial base, dentofacial, hyoid bone, airway and soft palate measurements. Hard tissue landmarks and reference planes. S, sella; N, nasion; Ba, basion; Por, porion; Or, orbitale; Pt, pterygoid; Cd, condylion; PNS, posterior nasal spine; ANS, anterior nasal spine; A, subspinale; B, supramentale; Pog, pogonion; Gn, gnathion; Me, menton; Go, gonion; U4, upper first premolar crown; L4, lower first premolar crown; U6, upper first molar crown; L6, lower first molar crown; H, hyoidale; C3, third cervical vertebrae. S-N, sella-nasion (line connecting S and N); S-Ba, sella-basion (line connecting S and Ba); FH, Frankfort horizontal plane (line connecting Por and Or); PP, palatal plane (line connecting ANS and PNS); FOP, functional occlusal plane (line connecting midpoints of U4-L4 and U6-L6); Go-B (line connecting Go and B); C3-Me (line connecting C3 and Me); MP, Mandibular plane (line connecting Go and Me); NPerp (nasion-perpendicular plane). Soft tissue landmarks. PPW1(landmark on posterior pharyngeal wall at the level of posterior superior airway space, projected from palatal plane); PPW2 (landmark on posterior pharyngeal wall at level of functional occlusal plane, projected from functional occlusal plane); PPW3 (landmark on posterior pharyngeal wall at the level of posterior inferior airway space, projected from Go-B plane); P (inferior-most point of the tip of the soft palate); SP (point of intersection of the posterior surface of the soft palate and functional occlusal plane); Tb (point on dorsum of the tongue on the line joining Go-B plane); Eb (base of the epiglottis, the deepest point of the epiglottis). Green lines represent soft palate length (P-PNS), soft palate length below functional occlusal plane (P-FOP) and vertical airway length (PNS-Eb).
Digitisation and cephalometric analysis were carried out by one investigator (HKLJ) using the Computer-Assisted Simulation System for Orthognathic Surgery (CASSOS) 2001 software (SoftEnable Technology Limited, 2000).
Intra-operator reliability
Intra-operator reliability was established by using the Bland-Altman method. 22 20% (n = 23) of LC images were randomly selected for repeat digitisations and analysed after a two-week interval. Agreement was achieved if 95% of the repeated measurements were within 1.96 standard deviation.
Statistical analyses
Statistical analyses were performed using SAS 9.4 (SAS Institute Inc, Cary, NC, USA). Descriptive data were computed and expressed in mean and standard deviation for continuous parameters with normal distribution, and as median, minimum and maximum for non-parametric data. Two-sample t-test was used to evaluate whether there was any difference in age between males and females. The Mann-Whitney U test was carried out to assess if there were any gender differences in BMI and AHI.
Median regression was used to investigate the association of clinical and cephalometric parameters with AHI. For the unadjusted analyses between AHI and cephalometric parameters, Bonferroni method was applied to reduce Type I error from multiple comparisons. Further analyses between AHI and cephalometric parameters adjusting for age, gender and BMI were also carried out using median regression. The association between AHI and the clinical and cephalometric parameters were reflected by the median correlation coefficient, and 95% confidence intervals (95% CIs). Statistical significance was set at 5%.
Results
Sample demographics
The sample consisted of 83 males and 30 females. 45, 37 and 31 participants had mild, moderate and severe OSA respectively. The mean age of the sample was 48.92 years (SD = 12.86). Median BMI was 24.72 kg/m2, with minimum of 18.51 kg/m2 and maximum of 53.15 kg/m2. Median AHI was 19.20 events/h, with minimum of 5.20 events/h and maximum of 81.40 events/h. Male participants were younger than female participants (47.24 ± 13.14 years and 53.59 ± 10.95 years respectively, p = 0.02).
Age, BMI and AHI data of sample.

SD: Standard deviation; Min: Minimum; Max: Maximum.
Age, BMI and AHI data of male and female participants.

**p < 0.05.
SD: Standard deviation; Min: Minimum; Max: Maximum.
Clinical and cephalometric findings
Clinical and cephalometric findings for mild, moderate and severe OSA groups.

SD: Standard deviation; Min: Minimum; Max: Maximum; BMI: body mass index; Facial axis angle: Ba-N to Pt-Gn (
Association between clinical and cephalometric parameters and AHI
Association between clinical and cephalometric parameters and AHI.

BMI: body mass index; Facial axis angle: Ba-N to Pt-Gn (o); SPAS: superior posterior airway space; RPAS: retro-palatal airway space; RGAS: retro-glossal airway space.
*Results adjusted for age, gender and body mass index.
^ Confidence Interval.
**p < 0.05.
AHI was positively associated with age (Median Regression Coefficient = 0.26; 95% CI 0.07 to 0.44; p = 0.006). Associations between AHI and gender or BMI were not found to be statistically significant.
The distance from mandibular plane to hyoid bone, Mp-H (mm), showed statistically significant association with AHI (Median Regression Coefficient = 0.58; 95% CI 0.05 to 1.11; p = 0.032). However, the positive association did not reach statistical significance after Bonferroni correction (Median Regression Coefficient = 0.58; 95% CI -0.25 to 1.41; p = 0.64) and adjustment for confounding risk factors (Median Regression Coefficient = 0.40; 95% CI -0.09 to 0.88; p = 0.106).
Median regression analysis showed a negative correlation between AHI and facial axis angle, Ba-N to Pt-Gn (o), after adjusting for age, gender and BMI (p = 0.046). For every one degree decrease in facial axis angle, there was an increase in AHI by a median value of 0.53 events/hour (95% CI -1.04 to −0.01).
The anterior cranial base length, S-N (mm), and superior posterior airway space, SPAS (mm), had a negative correlation with AHI, but their correlation did not reach statistical significance (p = 0.66 and p = 0.052 respectively) after adjusting for age, gender and BMI.
All other cephalometric parameters were not significantly associated with AHI.
Intra-examiner reliability
Measurements were repeated for 20% of the sample to determine the intra-examiner reliability (n = 23 pairs). Among the 23 randomly selected subjects, there were 14 males and 9 females. They consisted of 8 mild, 7 moderate and 8 severe OSA subjects. S-N (mm), Pog-NPerp (mm), SPAS (mm) and RGAS (mm) had 91.3% of the observations fall within 1.96 standard deviations, and agreement was not achieved.
Discussion
Gender differences
Data from this study (Table 2) revealed that male participants with OSA present younger than females. This finding was consistent with an observational study of 2827 patients by Basoglu and Taskaban which showed that the age of the male participants was significantly younger than the female participants (50.4 ± 11.6 years vs 56.1 ± 9.7 years, p < 0.0001). 23 A large population-based study in Germany also observed later OSA onset in females, with AHI increasing significantly only after age of fifty. 24 While the exact mechanisms underlying this observation is not fully understood, some authors have postulated biological differences in the pathophysiology of OSA between genders. 25 It was also noted that female OSA patients present with different clinical symptoms, especially when AHI was lower, leading to misdiagnosis or underdiagnosis among female patients.26,27
Clinical parameters
Age is a well-reported risk factor of OSA. Bixler and colleagues reported a 2- to 3-fold increase in OSA prevalence in patients above 65 years of age when compared to patients between 30 and 64 years of age. 28 This positive association between age and severity of OSA was observed in both men and women, with odds ratio reported from 1.77 to 3.20. 24 Similarly, our study found a positive correlation between age and AHI was found (p = 0.006).
Population-based longitudinal and cross-sectional studies have consistently found that gender and BMI were important risk factors for OSA.29–31 However, results from this study did not show a correlation between age or BMI and AHI. This is likely due to the limited sample size.
Cephalometric parameters
Results from this study suggest that the further the hyoid bone was from the mandible, the larger the AHI. An inferiorly-placed hyoid bone is thought to influence tongue posture, hence affecting the retro-glossal airway dimensions. This has also been corroborated in many cephalometric studies comparing OSA patients with control groups.10,32,33 In a study comparing OSA participants with their siblings without OSA, it was found that a greater distance from the hyoid bone to mandibular plane was associated with OSA, after correcting for BMI and age. 34 In another study consisting of 99 Chinese adult participants, multiple regression analysis adjusting for age, neck circumference and BMI showed a positive correlation between Mp-H and AHI. 12 In our study, Mp-H was positively correlated with AHI, although statistical significance was lost after applying Bonferroni’s correction and in multivariate analysis.
Facial axis angle, Ba-N to Pt-Gn (o), was found to have a statistically significant negative association with AHI (p = 0.046). The facial axis angle is based on Ricketts cephalometric analysis and it indicates an individual’s facial pattern in both the vertical and anteroposterior dimensions. 35 A smaller angle implies a reduced facial depth relative to the facial height. Based on Rickett’s Caucasian study population, an individual with a facial axis angle of less than 90° is described as dolichofacial. 36 In this sample of OSA patients, mean facial axis angle was 83.0 ± 6.0°, indicating a vertical growth pattern. The negative association between facial axis angle and AHI was also reported in a cephalometric study consisting of 206 Japanese men diagnosed with OSA. The study showed that BMI and facial axis angle were significant predictors for increased AHI. 37 In another Japanese study comparing male OSA and non-OSA controls, the OSA group presented with smaller facial axis angle, lowly-positioned hyoid bone, longer soft palate, and narrower airway. 38 In all, these results suggest that a smaller facial axis angle may indicate a higher likelihood of greater OSA severity, especially in Asians. This may be because a downward and backward mandible development could contribute to narrowing of the hypopharyngeal airway, precipitating airway collapse and OSA.
Other cephalometric parameters which have been reported to be associated with OSA include a shorter cranial base,19,39 maxillary retrusion, 10 mandibular retrognathia, 9 increased soft palate length and thickness,33,40,41 increased tongue size, 42 increased airway length, 43 and reduced posterior airway space.4,40 These features are indicative of skeletal restriction and/or upper airway constriction which can contribute to the pathogenesis of OSA. In this study, median regression analyses showed that apart from facial axis angle, the association of all the other cephalometric parameters did not have an association with AHI. There was a tendency for an increase AHI with decrease in anterior cranial base length, S-N (mm), and superior posterior airway space, SPAS (mm). However, their negative association did not reach statistical significance. This may be due to the small sample size.
As OSA patients have been observed to have their soft palates extending below the occlusal plane, 17 the team studied a novel cephalometric parameter, P-FOP (mm), which measures the vertical distance of soft palate tip to the functional occlusal plane. However, P-FOP was not found to be associated with AHI. Future studies with larger sample sizes and analysis using other regression models may be considered to evaluate the utility of this cephalometric parameter.
Limitations of the study and further research
There are several limitations of our study. Firstly, the small sample size could have led to a lack of statistical significance in several associations between cephalometry and AHI. To mitigate this, future studies should use larger sample sizes and also implement a non-OSA control group to enhance the rigour of the study.
Secondly, this study does not validate the use of LC as a diagnostic tool, as it is a case series of diagnosed OSA patients without non-OSA controls. Additionally, cephalometry does not account for non-anatomical causes of OSA. Nevertheless, when available, the LC could be analysed to identify potential cephalometric traits related to greater disease severity.
For future research, it would be beneficial to compare findings between the LC and the drug-induced sleep endoscopy (DISE) - both of which are modalities for airway visualization. If a strong correlation emerges between LC airway findings and those of DISE, it might enable selected patients to avoid having to undergo DISE, which carries risks associated with sedation and anaesthesia.
Conclusion
Male participants present younger than the female participants. The present study showed a positive association between age and AHI. Multiple regression analysis indicated a negative association between facial axis angle and AHI.
Footnotes
Acknowledgments
This work was supported by the National Dental Centre Singapore and National University of Singapore. The study received no external funding to conduct this research through any of the authors involved.
Author contributions
H.K.L.J. and Y.M. contributed to the conceptualization, methodology, investigation, validation, and writing. Y.M. was involved in supervision, project administration, conceptualization and writing. W.H.C. took part in the methodology, statistical analysis and writing. T.S.T. participated in the conceptualization, supervision and writing. All authors read and approved the final manuscript.
Declaration of conflicting interests
The author(s) declared no potential conflicts of interest with respect to the research, authorship, and/or publication of this article.
Funding
The author(s) received no financial support for the research, authorship, and/or publication of this article.