
Abstract
Background
The prevalence of age-related hearing loss is expected to increase with the ageing population in Singapore resulting in increased demand for pure tone audiometry (PTA). One way of meeting the increased demand for PTA is the Automated Method of Testing Auditory Sensitivity (AMTAS). Nonetheless, before AMTAS may be implemented, it is important to validate its results by comparing them against those of conventional PTA for the diverse Singaporean population.
Methods
100 participants were recruited from the Otorhinolaryngology clinic at a public hospital. PTA was conducted for participants via the conventional method and AMTAS. The hearing thresholds obtained via the two methods were then compared. A feedback questionnaire on the use of AMTAS was also completed by all participants.
Results
Air and bone conduction threshold results from 80 participants were analysed. The absolute mean difference in air conduction thresholds obtained via the two methods ranged from 3.30 to 9.62 dB. The absolute mean difference in bone conduction thresholds obtained via the two methods ranged from 8.16 to 9.38 dB. Most participants indicated that the machine was easy to use. Other feedback collected indicated that the AMTAS testing environment was noisy and that testing was fast.
Conclusion
This study finds that despite differences in hearing thresholds obtained via AMTAS and manual PTA, these differences are within the acceptable 10 dB test-retest variation. Nonetheless, existing issues related to the AMTAS software and noise levels in the testing environment will need to be addressed before it can be used in the clinic.
Introduction
The hearing of Singapore residents is becoming a national concern. In 2017, 63.7% of 662,480 Singapore residents aged 60 years and above were estimated to have hearing loss. 1 Hearing loss is defined as a 4-frequency average (0.5 kHz, 1 kHz, 2 kHz, and 4 kHz) greater than 25 dB HL. This number is likely to be higher now with the ageing population in Singapore and the higher prevalence of hearing loss with increasing age.1,2 Recognizing this issue, hearing screening was included in a nationwide functional health screening program. Preliminary data from this showed that at least 16,100 out of 23,100 people screened in 2018, would need further detailed hearing assessment or diagnostic pure tone audiometry (PTA). 3 As the screening program expands, the demand for diagnostic PTA is predicted to increase further. Yet, despite this, it is difficult to increase the capacity for conventional diagnostic PTA in Singapore due to manpower, space, and financial constraints. 4 One way of meeting this demand is via automated audiometry specifically the Automated Method of Testing Auditory Sensitivity (AMTAS) software.
Automated audiometry is diagnostic PTA that is conducted without direct access to trained personnel. 5 This is done using various equipment and has been validated in numerous countries since 2010.5–9 AMTAS is a computer software used with a clinical audiometer that allows the full clinical diagnostic PTA, to be conducted without trained personnel. 10 Over the past decade, numerous studies have been conducted on it by the developers and independent groups.9,11–13 These studies concluded that variations in air and bone conduction thresholds obtained via AMTAS and manual PTA were within the acceptable range of 10 dB.9,11 Thus, AMTAS is now commercially available. 10 The strength of the evidence obtained overseas for AMTAS is the reason that AMTAS is selected as the automated audiometry solution in this study. There is however limited information about the validity and feasibility of AMTAS especially in a country with multi-ethnicities who speak different languages.
Studies on AMTAS were done mainly in Western countries with pre-dominantly English native speakers and no such studies have been done in Asian countries to our knowledge. More importantly, AMTAS is only available in English with hearing test instructions recorded in English by a native English speaker. Given the large range in English fluency within the Singapore population, this could affect the accuracy of the hearing test results obtained via AMTAS. 14 Nonetheless, with the potential benefits of AMTAS in alleviating the manpower demand for diagnostic PTA in Singapore, it is important to validate the use of it in Singapore’s heterogeneous population.
In this study, we have two aims. The first aim is to determine the validity of AMTAS by determining whether there is any difference in hearing thresholds (air and bone conduction) between AMTAS and conventional manual PTA. The second aim is to determine the feasibility of using AMTAS in a specialist outpatient clinic at a restructured government hospital.
Methods
Study design
To validate AMTAS®, we designed a prospective single group within-subject repeated measures study. Validity was determined by comparing the pure tone hearing obtained via AMTAS® with those obtained from an established gold standard assessment method, conventional manual PTA. 15 We conducted both manual PTA and AMTAS® for study participants and compared the hearing thresholds obtained via the two methods. Feasibility of AMTAS® was assessed based on whether there was any change in the hearing profile of participants obtained via the two methods and on participant feedback in a short questionnaire completed at the end of testing.
Participants
One hundred study participants were recruited from outpatients attending an Otorhinolaryngology Head and Neck specialist outpatient clinic within a government-restructured hospital in Singapore. These patients were referred for PTA testing by specialist doctors, as part of routine clinical care. Outpatients were recruited if they were above 12 years old and English literate. They were excluded if they had impacted ear cerumen, and/or visible active ear infections. Ethics approval was obtained from Singhealth Centralized Institutional Review Board (CIRB) (Reference number: 2017/3069). Written informed consent was obtained from all participants. All procedures were performed in accordance with the ethical principles of the declaration of Helsinki 1964.
Manual conventional pure tone audiometry
Manual PTA was conducted by a trained audiologist or audiometric technician with at least 1 year of experience from a team of six. Manual PTA was carried out according to the recommended PTA procedure by the British Society of Audiology 16 and a mastoid placement of the bone conductor was used.
Testing was conducted in an American National Standards Institute (ANSI) certified sound booth using a GN Otometrics Madsen Itera (Copenhagen, Denmark) audiometer with TDH39 circum-aural headphones, and mastoid placement of a B71 bone oscillator was used for bone conduction. Threshold seeking was done with the modified Hughson-Westlake method. Hearing thresholds were plotted manually into the audiogram module in NOAH software version 4.4 by the tester.
AMTAS®
AMTAS® is a software developed in 2002. 17 It automates the process of obtaining a full diagnostic pure tone audiogram using a touchscreen computer and any audiometer that can be controlled with a computer. 17 In this study, the AMTAS® Pro version 1.1 was used with the GSI Audiostar Pro audiometer (Grason-Stadler, Eden Prairie, MN, USA) and a touchscreen desktop computer.
With AMTAS®, the audiometer was hidden, and study participants were presented with a touchscreen monitor to make their responses (Figure 1). Trained personnel placed the forehead calibrated B81 bone conductor in the centre of the participant’s forehead, and it was secured with an AMBAND or a calibrated bone conduction band. Thereafter, circum-aural Sennheiser HDA 200 high frequency headphones were placed over both ears (Figure 2). This concludes the involvement of any personnel in the testing. AMTAS setup. Final placement of transducers in AMTAS testing.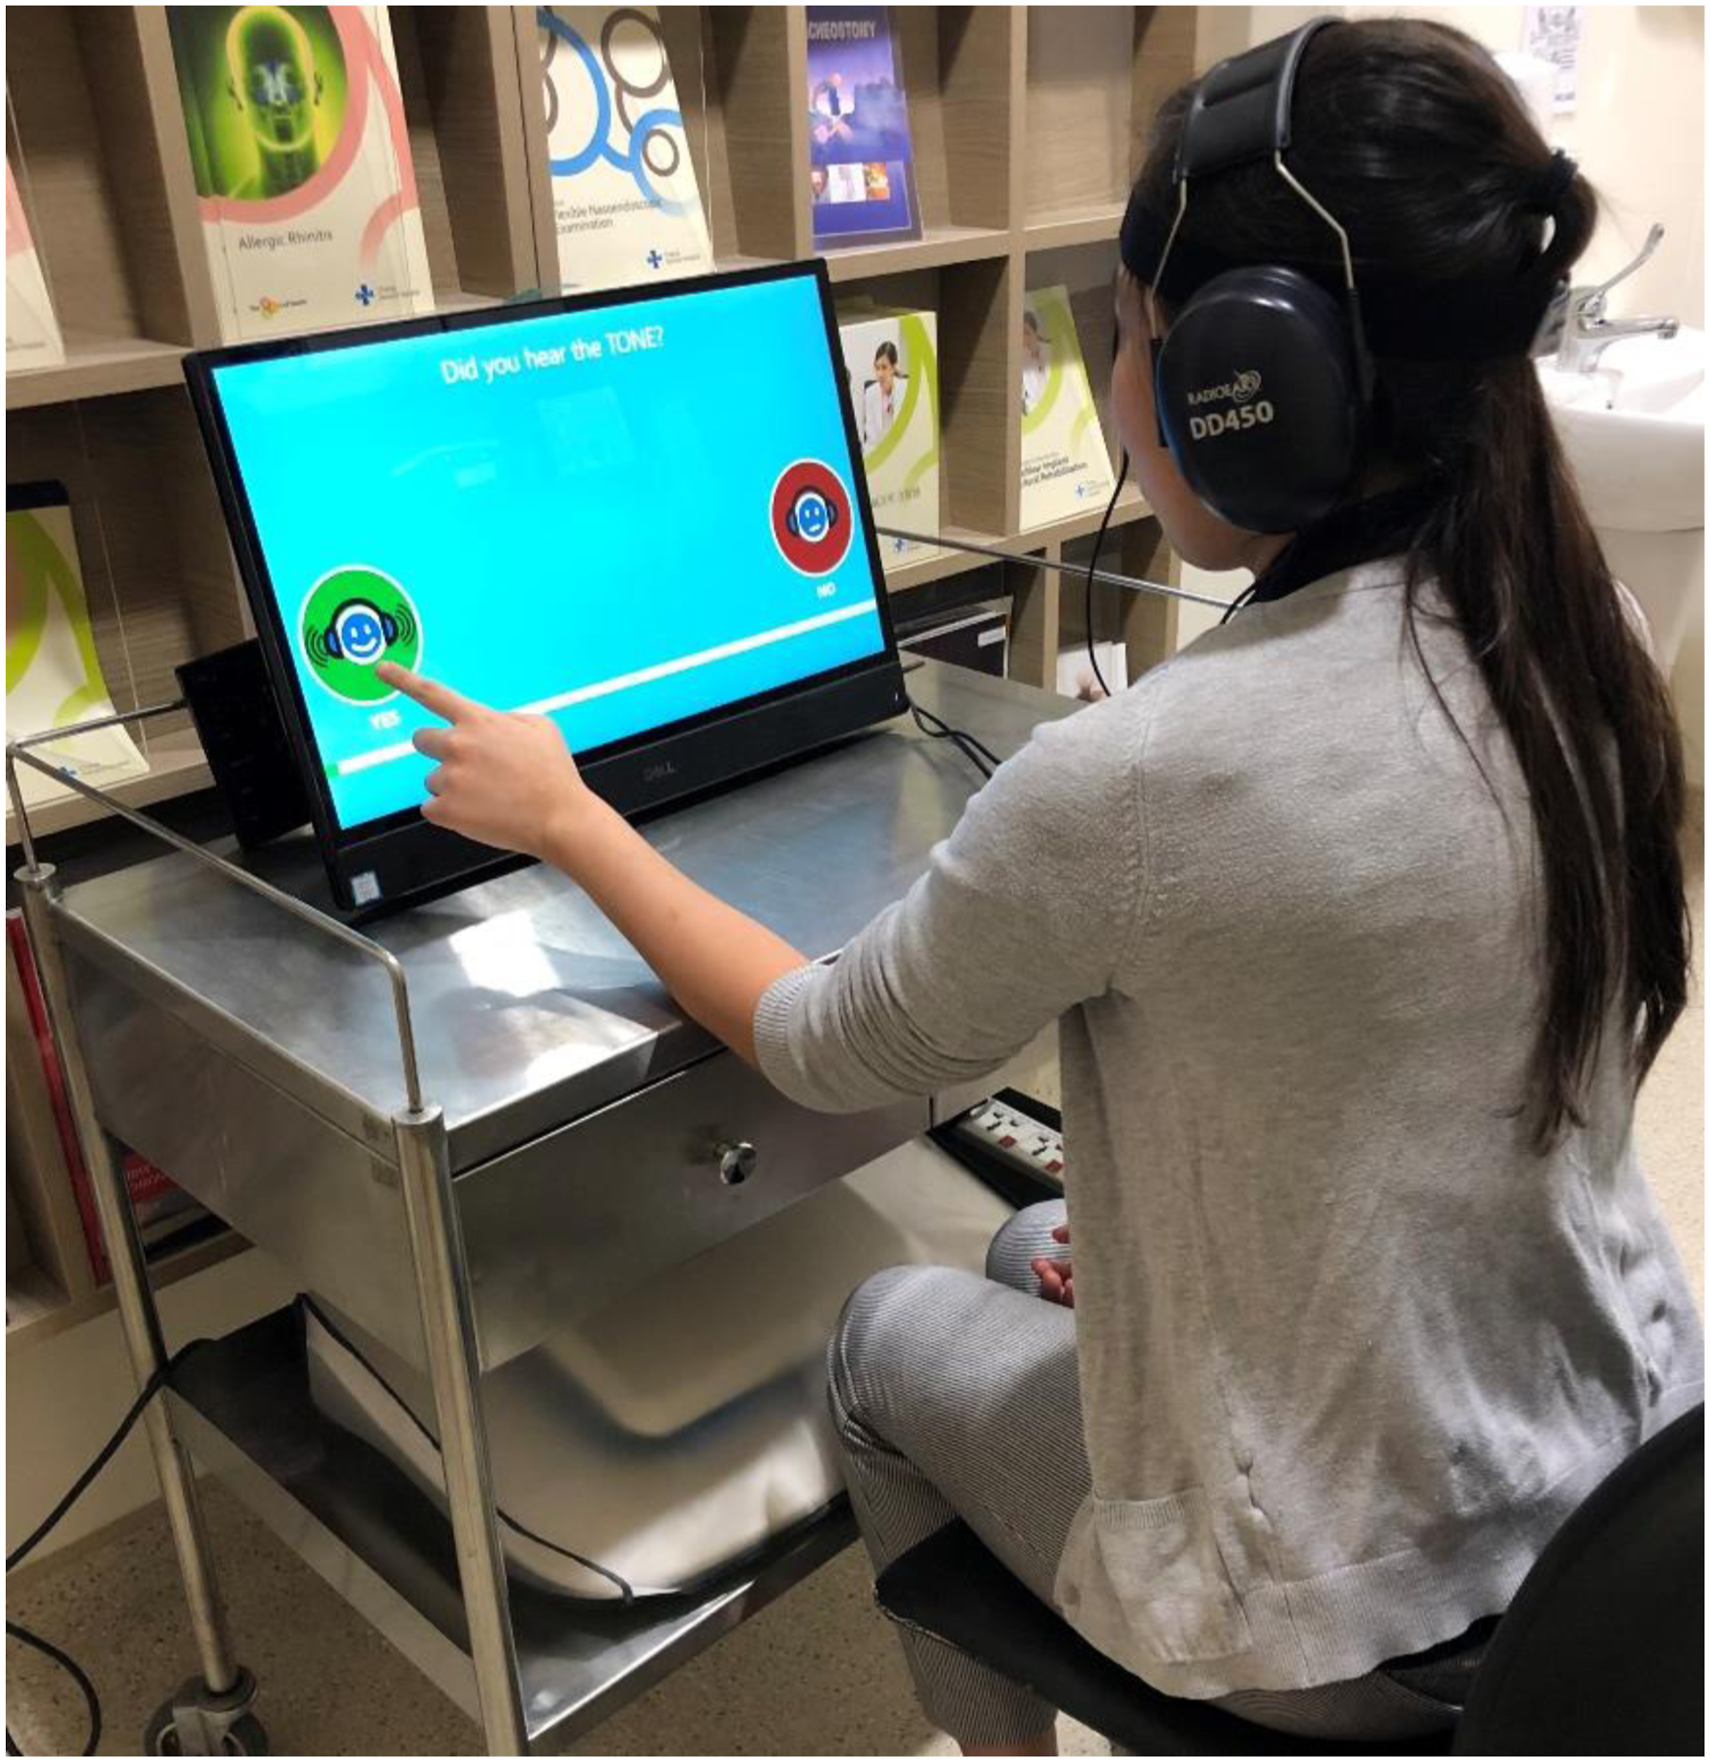

After transducer placement, study participants viewed an approximately three-minute animated video with English voiceover narration by a native speaker on hearing test instructions. They could adjust the volume to a comfortable level by using a slider at the bottom (centre) of the screen at any time. During testing, a forced choice method was used, and participants indicated whether they heard a tone or not by touching the corresponding icon on the computer screen. Masking noise was also always presented in the non-test ear for both air and bone conduction masking. Six air conduction frequencies (250 Hz, 500 Hz, 1 kHz, 2 kHz, 4 kHz, 8 kHz) and four bone conduction frequencies (500 Hz, 1 kHz, 2 kHz, 4 kHz) were tested and when two adjacent thresholds differed by 20 dB or more, the inter-octave frequencies were also tested. Results were presented graphically in an audiogram (Figure 3). Sample Audiogram generated via AMTAS.
Testing procedures
Outpatients referred for PTA were taken through the clinical protocol of history taking, otoscopy, and tympanometry. Eligible patients may be recruited after this or after they have done manual PTA. Depending on when the participants were recruited, they may either undergo AMTAS or manual PTA first. The timing of recruitment was dependent on the number of patients referred for PTA and availability of the AMTAS machine. No break was given between the two tests unless participants requested for one or if they were found to be tired. This was due to time constraints within the clinic.
AMTAS testing was done in a quiet room located in a corner of the clinic. The ambient noise level was measured three times on a typical weekday afternoon using a Class I sound level meter. The average of those readings was taken to be representative of the ambient noise level in the quiet room.
Statistical analysis
Hearing thresholds obtained via AMTAS and manual PTA were entered into a Microsoft Excel data sheet. Statistical analysis was conducted using the Statistical Package for Social Sciences (SPSS) for Windows, version 16.0 (SPSS Inc., Chicago, IL, USA). Hearing threshold data was classified according to air or bone conduction threshold and frequency. Exploratory data analyses were conducted to determine the use of parametric or non-parametric equivalent. This data was then summarized using the mean and standard deviation. The difference between hearing thresholds obtained via manual PTA and AMTAS was obtained by subtracting the hearing thresholds obtained via AMTAS from those obtained via manual PTA (Manual PTA hearing threshold – AMTAS hearing threshold). We analysed the absolute differences in the hearing thresholds.
Results
Study participants
Reasons for exclusion of participants.

Quality indicators considered in reliability rating by AMTAS (Taken from Margolis et al. 2007).

Of the 80 participants (159 ears), there were 52 females (65%), median age of 46 years (Range = 21–74 years) and 28 males (35%), median age of 55 years (Range = 21–78 years). There was no significant difference in the median age between gender (p = 0.377 >0.05). Age of study participants was not normally distributed (p-value = 0.00 <0.05, Shapiro-Wilk test).
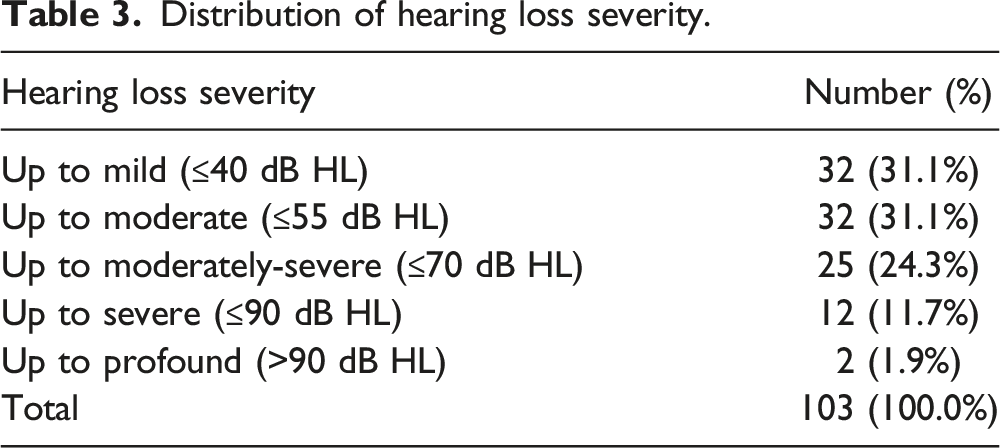
Distribution of hearing loss severity.
Air conduction thresholds
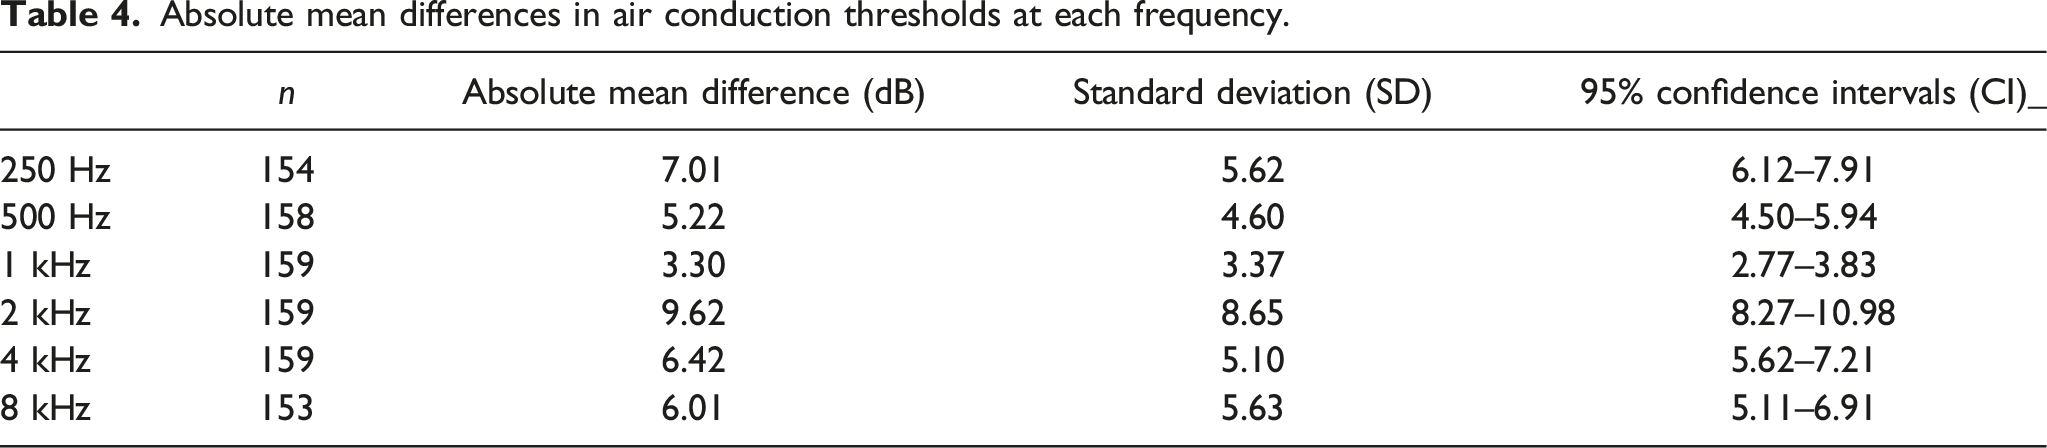
Absolute mean differences in air conduction thresholds at each frequency.
Differences in air conduction thresholds between manual audiometry and AMTAS (Manual – AMTAS).


Graph showing mean air conduction thresholds obtained via manual audiometry and AMTAS.
Bone conduction thresholds
Absolute mean differences in Bone conduction thresholds at each frequency.

Differences in bone conduction thresholds between manual audiometry and AMTAS (Manual – AMTAS).

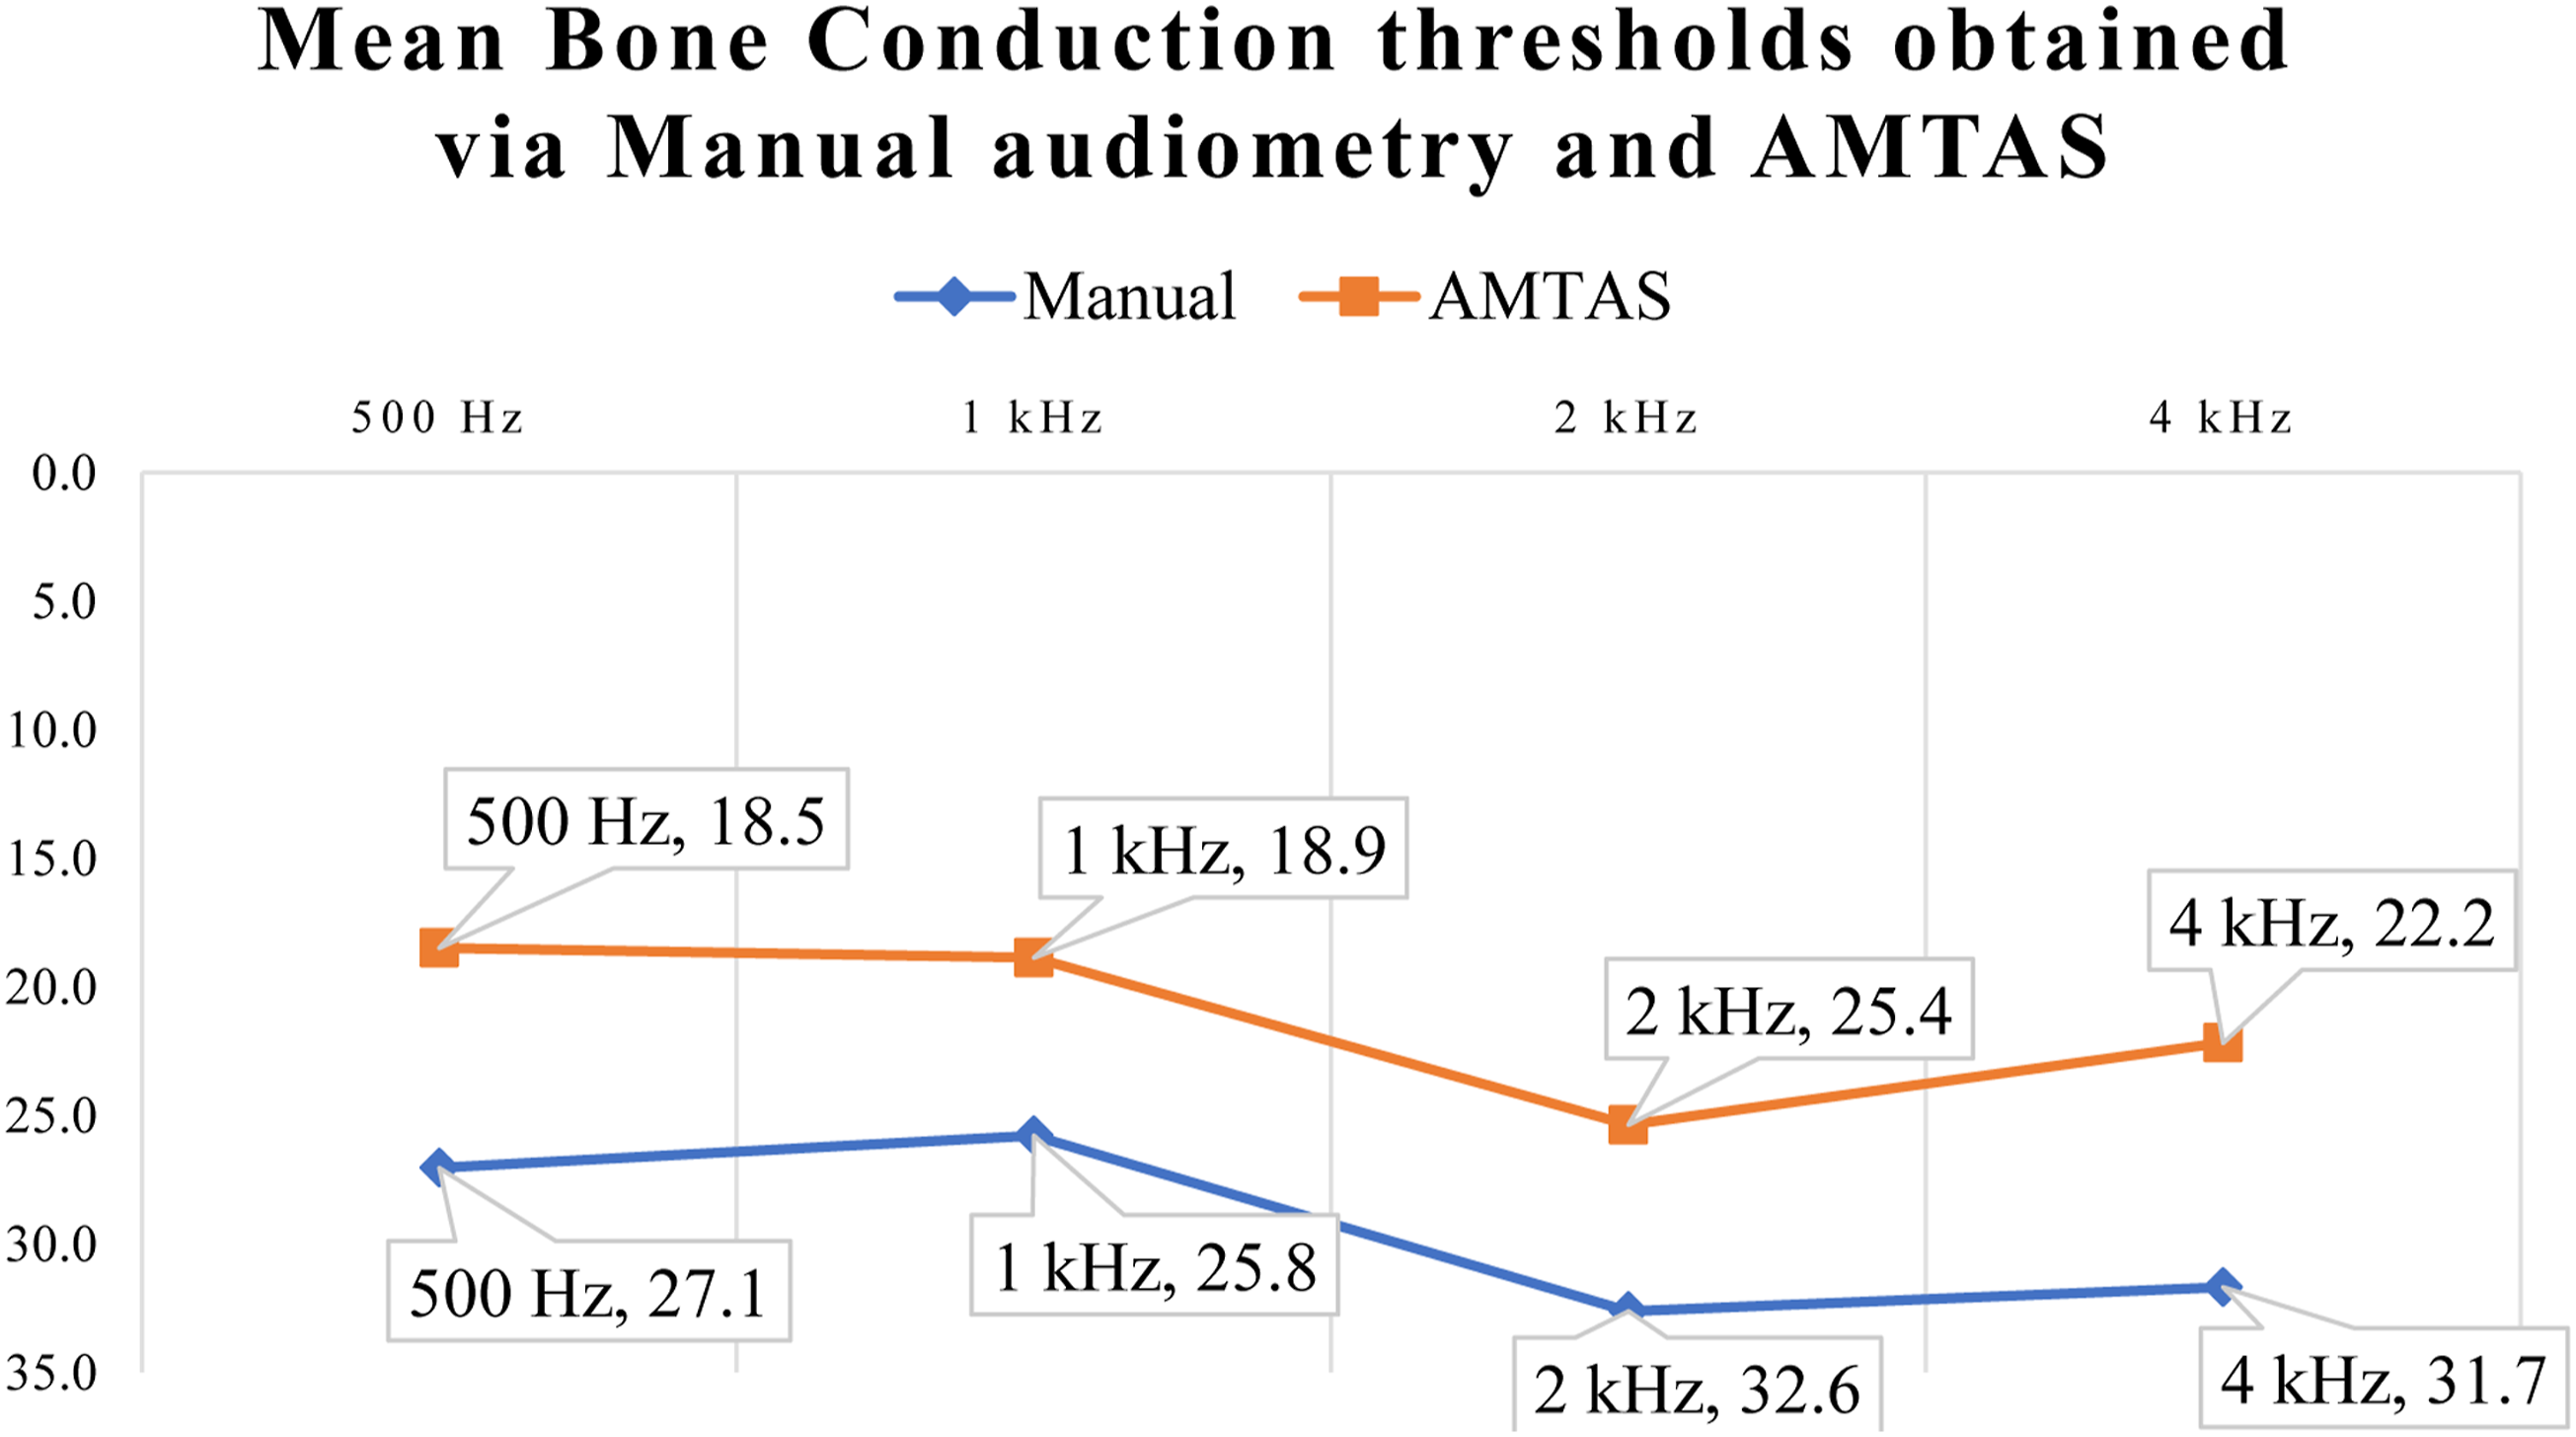
Graph showing mean bone conduction thresholds obtained via manual audiometry and AMTAS.
Changes in hearing profile
Hearing Profile of participants when tested via manual audiometry and AMTAS.

Feedback questionnaire
Summarized responses to questions from feedback questionnaire.

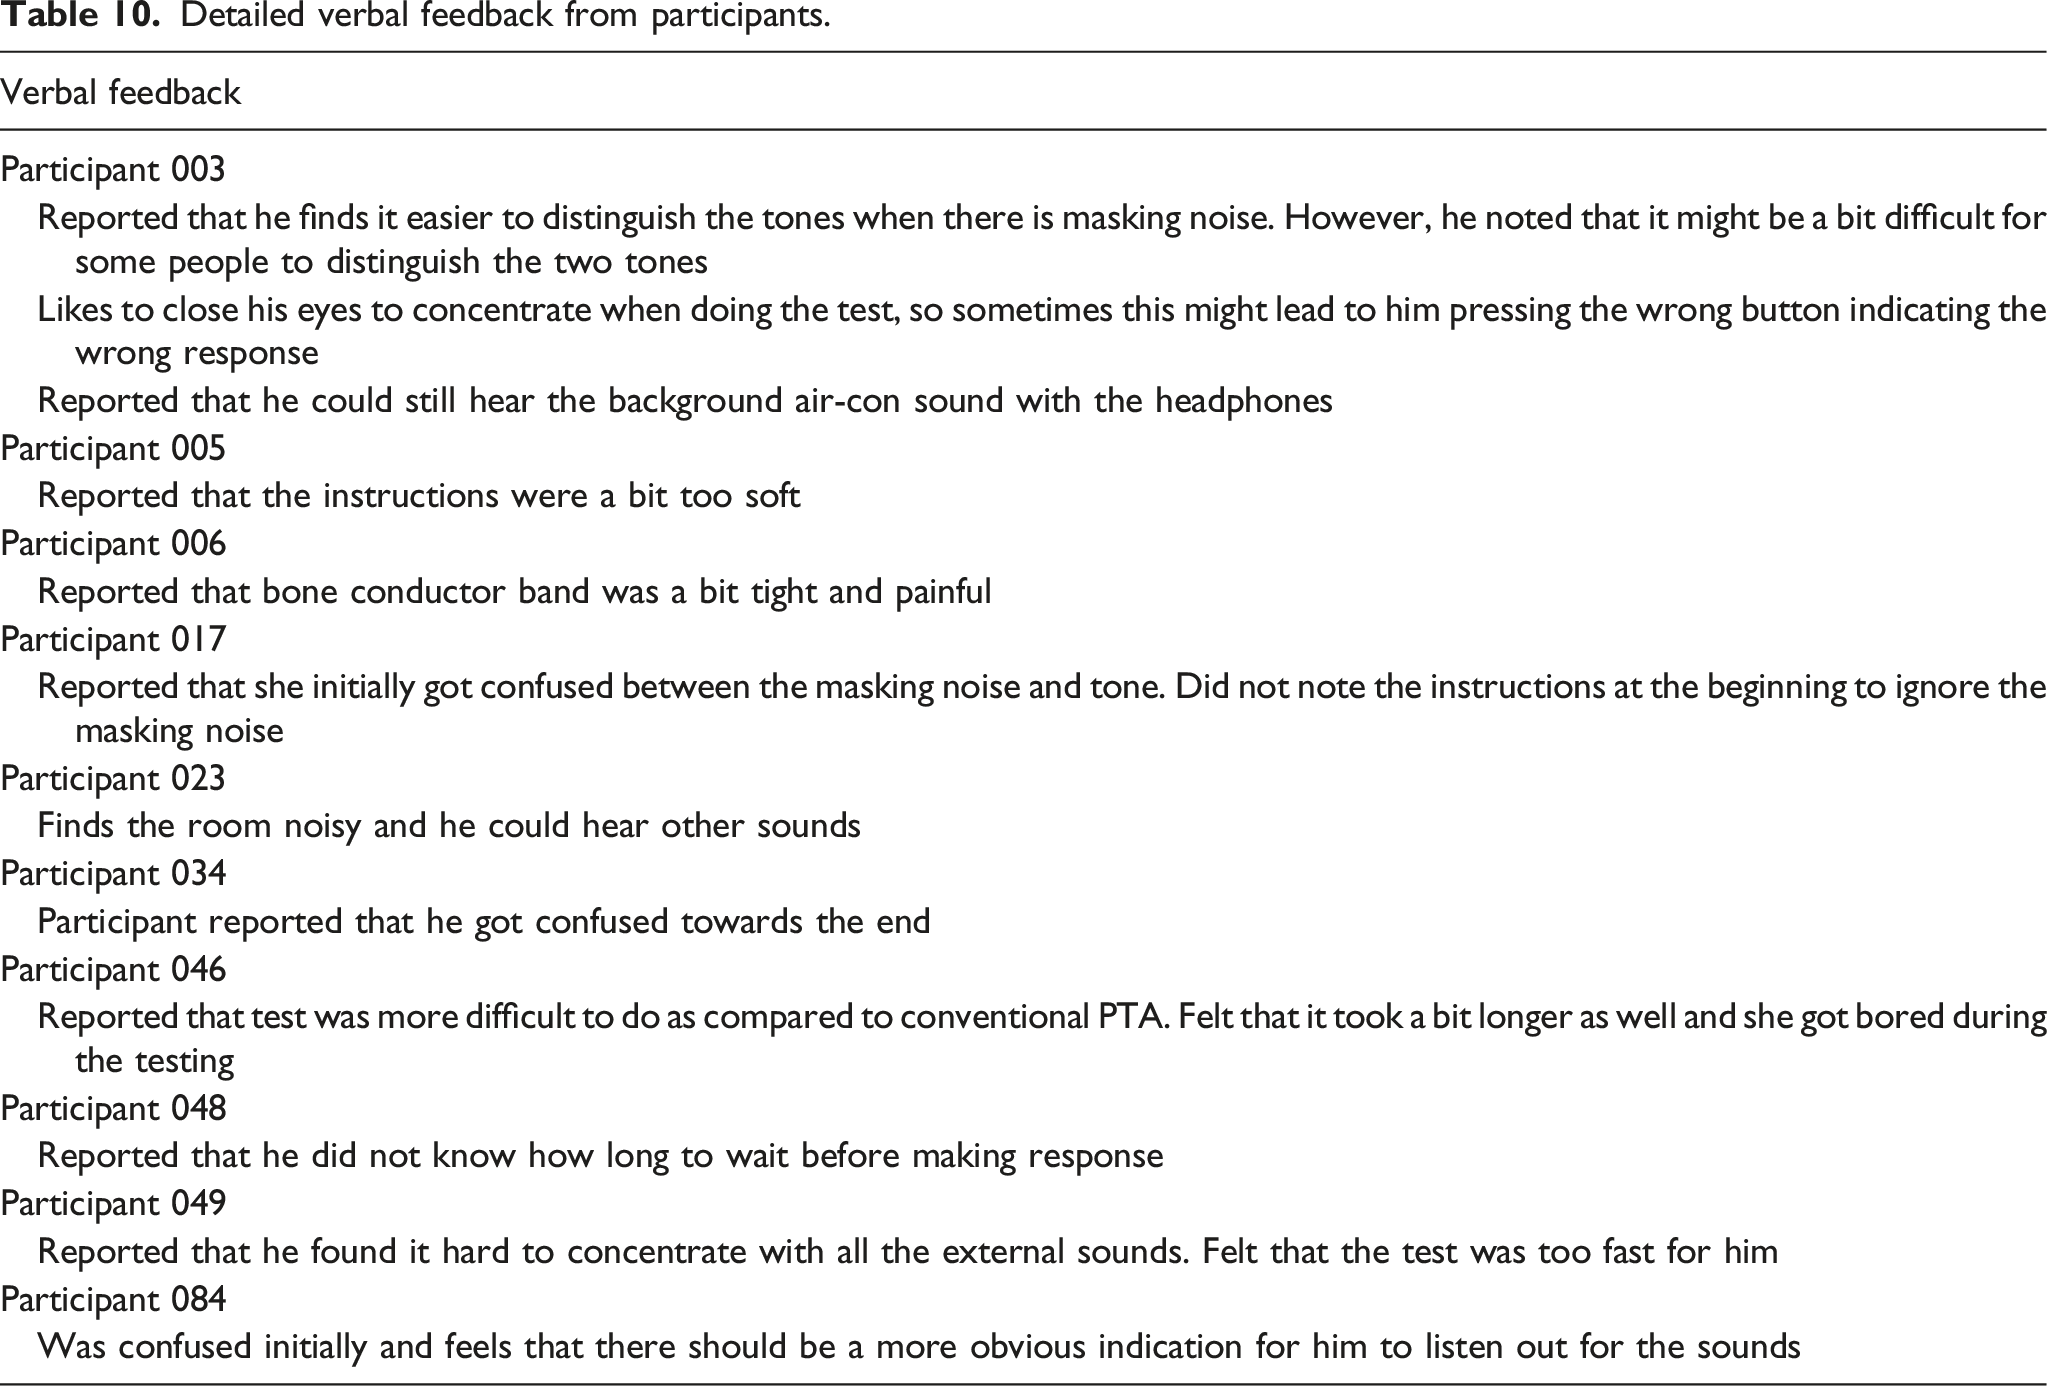
Detailed verbal feedback from participants.
Discussion
AMTAS is an automated method of conducting PTA that has been studied in various Western countries but never in a multi-ethnic Asian country like Singapore.9,11,13,17 Therefore, in this study, we aimed to validate the hearing thresholds of Singapore residents obtained via AMTAS by comparing them with those obtained via conventional PTA and to determine the feasibility of using AMTAS in a clinic within a restructured public hospital in Singapore.
This study showed that hearing thresholds obtained via AMTAS were largely similar to those obtained via conventional PTA. There is however greater variation in BC thresholds obtained via the two methods. In terms of feasibility of use in the clinic, patient feedback regarding the ease of use of the machine is encouraging but issues concerning noise levels during testing and differences in hearing profiles need to be addressed before AMTAS may be implemented.
Validation of hearing thresholds
In this validation study, we looked at absolute mean differences between the hearing thresholds obtained via the two methods instead of mean differences. This contrasts with other studies on automated audiometry which reported both.6,9,11 This is because both positive and negative differences in hearing thresholds obtained via the two methods are expected. These would cancel each other out in the calculation of mean differences which could artificially reduce the differences obtained. 9 Hence, in this study, we focused only on absolute mean differences, which resolves this issue.
Air conduction thresholds
The absolute mean differences in Air Conduction (AC) thresholds obtained in this study via the two methods are within 10 dB (3.30–9.62 dB) which is the accepted test-retest variability for pure tone audiometry. 19 These results corroborate those obtained by Eikelbloom’s group which found absolute mean differences in hearing thresholds from AMTAS and manual PTA ranging from 4.9 to 7.0 dB. 9
The greatest absolute mean difference observed in this study was at 2 kHz and it is noted that it is 71.7% larger than that obtained in the study by Eikelbloom’s group (9.62 dB vs 5.6 dB respectively). 9 This large absolute mean difference persisted even when outliers were excluded (Absolute mean difference = 8.96 dB). Moreover, the percentage of 2 kHz thresholds obtained via the two methods within 10 dB was also the lowest among the frequencies (79.2%). One proposed reason for the discrepancy observed at 2 kHz is the central masking effect. In AMTAS, masking noise is continuously presented in the non-test ear. This is unlike manual PTA whereby masking is done only when required. The masking noise in AMTAS could have contributed to the central masking effect which has been shown to affect the 2 kHz AC threshold more thereby resulting in a greater difference for the 2 kHz threshold obtained via the two methods. 20
The larger absolute difference at 2 kHz observed in this study as compared to the study by Eikelbloom’s group may be due to the different headphones used for manual PTA in the two studies. In this study, circum-aural headphones were used whereas in the study by Eikelbloom’s group, supra-aural headphones were used. It is postulated that the increased bulkiness of the circum-aural headphones used in this study could have affected the headphone placement. This may in turn alter the ear canal acoustics in some participants introducing greater variation at the 2 kHz AC threshold which was found to be more susceptible. 21
In this study, AC thresholds obtained via AMTAS were generally found to be better than those obtained via manual PTA except at 500 Hz. One reason for this may be the learning effect. As most study participants were tested via manual audiometry first, they may have learned to detect the tones better. In addition, the rate of stimuli presentation in AMTAS is determined by the user’s response time. 17 Thus, if participants responded at a consistent rate, the rate of stimuli presentation may become predictable. This could result in false responses and better hearing threshold results. Although this may be detected by AMTAS via “catch trials” or intervals whereby no tone is presented, the possibility of “misses” cannot be excluded.
Bone conduction thresholds
Overall, the absolute mean differences for Bone Conduction (BC) thresholds are greater than those for AC thresholds. This is also seen in Eikelbloom’s study and in a meta-analysis by Margolis’s group.9,11 One reason for this could be the variability of bone conduction thresholds obtained via mastoid placement of the bone conductor during manual PTA as a result of acoustic radiation which could result in better than actual BC thresholds.22,23 Another factor influencing the differences found between BC thresholds obtained via the two methods is the forehead placement of the bone conductor in AMTAS as compared to the ipsilateral mastoid placement of the bone conductor in conventional PTA. Various studies have shown that the two placement methods result in differences in the bone conduction thresholds obtained.24,25
Nonetheless, despite the variability, the absolute mean differences in BC thresholds obtained in this study is within 10 dB (8.16–9.38 dB). The results obtained here also closely corroborate the results obtained in Eikelbloom’s study which found absolute mean differences in BC ranging from 7.2 to 9.4 dB. 9 This suggests that the variability in BC thresholds obtained via the two methods are still within acceptable limits.
Feasibility of using AMTAS within the clinic
The main reason for conducting this study was to determine whether AMTAS was suitable for use within a quiet room at a clinic within a public restructured hospital in Singapore. This was premised on a prior study which showed that differences in AMTAS thresholds obtained in a quiet room compared to thresholds obtained manually were within the test-retest variation of 10 dB. 9
The AMTAS testing room had average ambient sound levels of 17.9 dB SPL at 8 kHz and this sound level increased steadily to 43.5 dB SPL as the frequency decreased. Of these readings, the average sound level at 250 and 500 Hz exceeded the MPANLs for the HDA200 headphones used. 26 This suggests that hearing thresholds at 250 and 500 Hz obtained via AMTAS may be poorer than expected given that the noise could mask out the tones. Six participants also gave feedback that the room was noisy. It is however unclear whether the noise they referred to was from the environment or from the masking noise presented continuously in the non-test ear. In addition, in this study a larger proportion of AC thresholds obtained at 500 Hz via AMTAS are poorer than those obtained via manual PTA (42.4%). Despite this, 96.1% of the 500 Hz AC thresholds obtained via the two methods were within 10 dB. Most of the bone conduction thresholds obtained via AMTAS are also better than those obtained via manual PTA. This suggests that the impact of ambient noise on hearing thresholds obtained via AMTAS may be limited.
Another consideration is consistency of hearing profiles when participants were tested via manual audiometry and AMTAS. In this study, 75.4% of the ears had unchanged hearing profiles when tested via AMTAS. However, 24.6% of the ears changed from normal/sensorineural hearing loss to conductive/mixed hearing loss. This could be due to better bone conduction thresholds obtained via AMTAS which widened air-bone gaps. Although this occurred in a minority of ears, the possible significant effects of this such as the wrong investigations being ordered, and the wasted resources means that it must be addressed before AMTAS may be used in the clinic.
In terms of ease of use, most study participants found the machine easy to use and the instructions easy to understand. Some issues identified are that the instructions were confusing and that the testing was a bit fast. Device failure also occurred in one instance. A recent update to the AMTAS software, which allowed the test to be paused and introduced written instructions, may resolve some of these issues. This has implications on future testing protocols as for example, we can continuously monitor the background noise levels and pause the test when noise levels exceed thresholds. The written instructions may be used for certain patients such as those with very poor hearing for whom the audio instructions in the video may be difficult for them to hear and understand. The visual written instructions may thus help clarify any doubts on test instructions if patients miss critical information from the video.
Future studies should look into the demographic details and hearing profiles of patients tested to adjust for the effects of covariates such as age, gender, educational levels, cognition, type, and degree of hearing loss. This may help clinicians better understand the profile of patients better suited for AMTAS testing thereby improving the accuracy of hearing test results obtained via AMTAS. These individuals can then be triaged and separated from the manual audiometry patient pool, to reduce wait time for patients and overall burden on PTA testing in audiometric booths.
Conclusion
This study finds that despite differences in hearing thresholds obtained via AMTAS and manual PTA, these differences are within the acceptable 10 dB test-retest variation. The results obtained are also similar to those obtained in other studies. Nonetheless, important existing issues related to maintaining background noise levels below permissible standards during AMTAS testing, ensuring consistency of hearing profiles obtained via AMTAS and manual audiometry, as well as the ease of use of AMTAS will need to be addressed before it is implemented in the clinic to ensure result accuracy. As AMTAS is a software, the ease of use issues may be resolved in future with software updates. Should AMTAS be implemented, clinics can save on labour cost, space, and financial constraints of needing a sound-treated audiometric booth.
Footnotes
Acknowledgements
First, we would like to thank all the audiologists and audiometric technicians who helped in recruiting study participants. Secondly, we would like to thank Mr Eros Zeus Lomboy for providing his technical expertise regarding the AMTAS software and hardware. Thirdly, we would like to thank Associate Prof. Yuen Heng Wai for his guidance in this study. Finally, we would like to thank Prof. William Hal Martin and Ms Esther Seah as well as the rest of the team from the National University of Singapore for their assistance in measuring the noise levels in this study.
Author contributions
SL conceptualised the study and came up with the study design. SK researched literature and directed the study. KC was involved in editing the manuscript, data analysis, and providing critical inputs. HY was involved in researching literature, protocol development, gaining ethical approval, patient recruitment, data analysis, and in writing the first draft of the manuscript. All authors reviewed and edited the manuscript and approved the final version of the manuscript.
Declaration of conflicting interests
The author(s) declared no potential conflicts of interest with respect to the research, authorship, and/or publication of this article.
Funding
The author(s) disclosed receipt of the following financial support for the research, authorship, and/or publication of this article: This work was supported by the Changi General Hospital Innovation Grant (COCHFINN1704).
Ethical approval
Singhealth Centralized Institutional Review Board (CIRB) (Reference number: 2017/3069).
Informed consent
Written informed consent was obtained from all subjects before the study.
Data availability
The datasets generated and/or analysed during the current study are available from Hazel Yeo Kai Hui.