
Abstract
Background
Metabolic syndrome (MetS) is defined as a cluster of risk factors for predicting type 2 diabetes mellitus and cardiovascular disease.
Objectives
This cross-sectional study aimed to develop a cut-off value for fat versus lean mass ratio (FLMR) in predicting MetS and to investigate the association between this indicator with MetS and its components.
Methods
Subjects comprised 238 Malay adolescents (79% female) aged 18–19 years old. Anthropometric assessment comprised weight, height and waist circumference (WC). Body composition was measured using bioelectrical impedance analysis techniques while blood pressure was measured using a blood pressure monitor. Fasting blood glucose, total cholesterol , triglycerides, high-density lipoprotein cholesterol (HDL-c), and low-density lipoprotein cholesterol were determined from an overnight fasting blood sample. MetS was determined based on International Diabetes Federation (2007) definition for adolescents aged 16-year-old and above.
Results
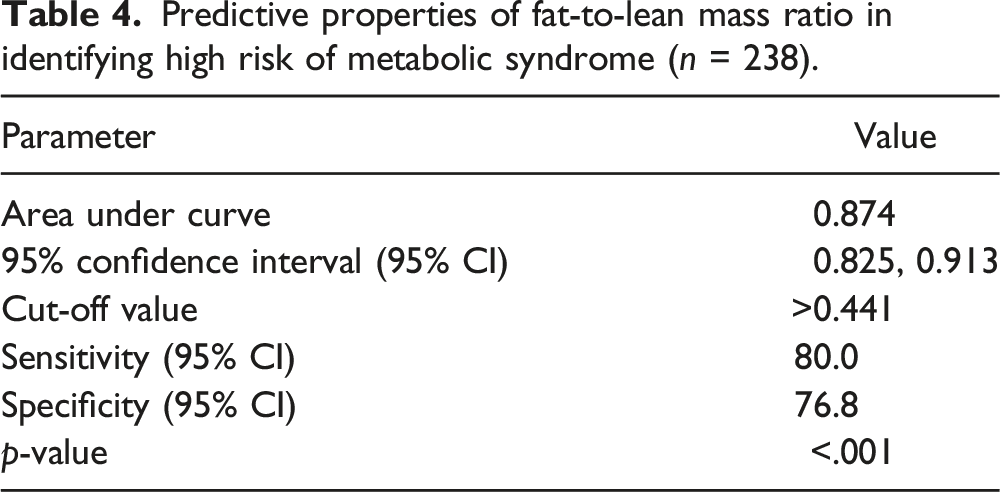
The prevalence of MetS was 2.1%. Receiver Operating Characteristics curve analysis revealed that the optimal cut-off value for FLMR was 0.441 with an Area Under the Curve of 0.874 (95% CI: 0.825, 0.913); with sensitivity of 80.0% and specificity of 71.0%. FLMR cut-off of 0.441 was associated with high WC (p < .001), low HDL-c (p < .001) and MetS (p < .05). Binary Logistic Regression analysis revealed that adolescents with high WC, low HDL-c and MetS had higher odds of developing increased FLMR than the cut-off value with an odds ratio (OR) of 43.4 (95% CI: 9.7,193.9), 4.7 (95% CI: 2.3,9.8) and 13.3 (95% CI: 1.5,121.2), respectively.
Conclusion
FLMR possesses fair discriminatory ability in identifying MetS among adolescents and significant association exists between FLMR and MetS and some of its components.
Introduction
Metabolic syndrome (MetS) is defined as a cluster of risk factors that includes central obesity, raised blood pressure, raised fasting plasma glucose, increased triglycerides, and decreased high-density lipoprotein-cholesterol (HDL-c) for predicting type 2 diabetes mellitus (T2DM) and cardiovascular disease. 1 Among all the risk factors, central obesity is positioned as the necessary parameter to diagnose MetS.1,2 In Malaysia, current literature revealed that 15–17% and 12–14.9% of adolescents were overweight and obese respectively; while the prevalence of MetS among adolescents was reported as 2.6%.3–5 Nevertheless, Wee and colleagues found no significant association between age and gender with the MetS among children living in metropolitan Kuala Lumpur. 6 In recent years, data from several studies have proven that a higher rate of MetS was found among overweight and obese Malaysian adolescents compared to their normal-weight counterparts.4,6,7
As obesity have a close relationship with MetS, it is important to deeply investigate the relationship between body composition; which divides our body into fat mass (FM) and lean body mass (LBM) with MetS. This is because although body mass index (BMI) provides a useful index for measuring body weight status, it does not estimate the proportion of FM and lean LBM. 8 Since the FM compartment is composed of adipose tissue while the LBM compartment is composed of water, organs and muscles, it is important to understand the roles of body composition in regulating energy metabolism, glucose and lipid metabolism which are closely related to metabolic disorders such as T2DM, hypertension and dyslipidemia.9,10 This was supported by a systematic review which concluded that the risk of cardiovascular risk factors increases simultaneously with the increase in central body fat deposition. 11 As such, body composition indices are known to be the best tools to define the risk of having MetS. Several international studies had established that body composition indices such as waist circumference (WC), waist-height ratio, the sum of four skinfolds, fat mass index (FMI) and fat free mass index were shown to have the high discriminatory ability (area under the curve (AUC) >0.7) in predicting MetS among adolescents.12–18 Nevertheless, there are some shortfalls behind these indicators as they only focused on the effect on fat and non-fat component independently and do not consider the antagonistic effects of FM and LBM on MetS.
In this study, we aim to integrate these two variables into a single anthropometric tool by expressing them into a ratio which is the fat-to-lean mass ratio (FLMR). Existing research recognised the role of FLMR in predicting MetS among adults.19,20 This indicator had also been employed in the clinical setting where higher FLMR was significantly associated with metabolic dysfunction among women with polycystic ovary syndrome, suggesting the clinically relevant utility of this indicator. 21 Although some research had been carried out on FLMR among young adults and adults, there have been no attempts to develop a cut-off value for FLMR among Malaysian adolescents. To address the literature gap, this paper aims to develop a cut-off value for FLMR in predicting the risk of MetS and to study the association between FLMR with MetS and its components among Malay adolescents in Terengganu.
Methods
Study design and sample selection
A cross-sectional study was conducted from 1st January to 31st May 2019 at a local university in Terengganu. Malay adolescents aged 18–19-year-old from the foundation centre and all the diploma programmes were recruited as participants as this study was conducted in a university setting with pre-university programme. Adolescents who were aged above 19-year-old, non-Malay ethnic and were diagnosed with chronic diseases related to MetS including hypertension, diabetes mellitus, heart disease, hypothyroidism or hyperthyroidism or endocrine disorder as well as cannot undergo fasting before blood sample withdrawal were excluded.
Sampling method
Systematic random sampling was used as the sampling method where the participants were chosen based on a fixed interval according to their number in the name list. The sample size was calculated using EpiInfo software by using a prevalence of 3.8% and an odds ratio (OR) of 4.93 which was adapted from a recent cross-sectional study in Malaysia. 7 By considering a 20% drop-out rate, the final sample size calculated was 254.
Data collection
Firstly, students who were interested to participate in this study were asked to fill in the consent form and also the socio-demographic form prior to the day of data collection. After all the socio-demographic forms were collected, the students were screened based on their personal information to ensure they were free of diseases related to MetS as mentioned in the exclusion criteria above and fulfilled the age criteria.
Measurement of variables
Socio-demographic information
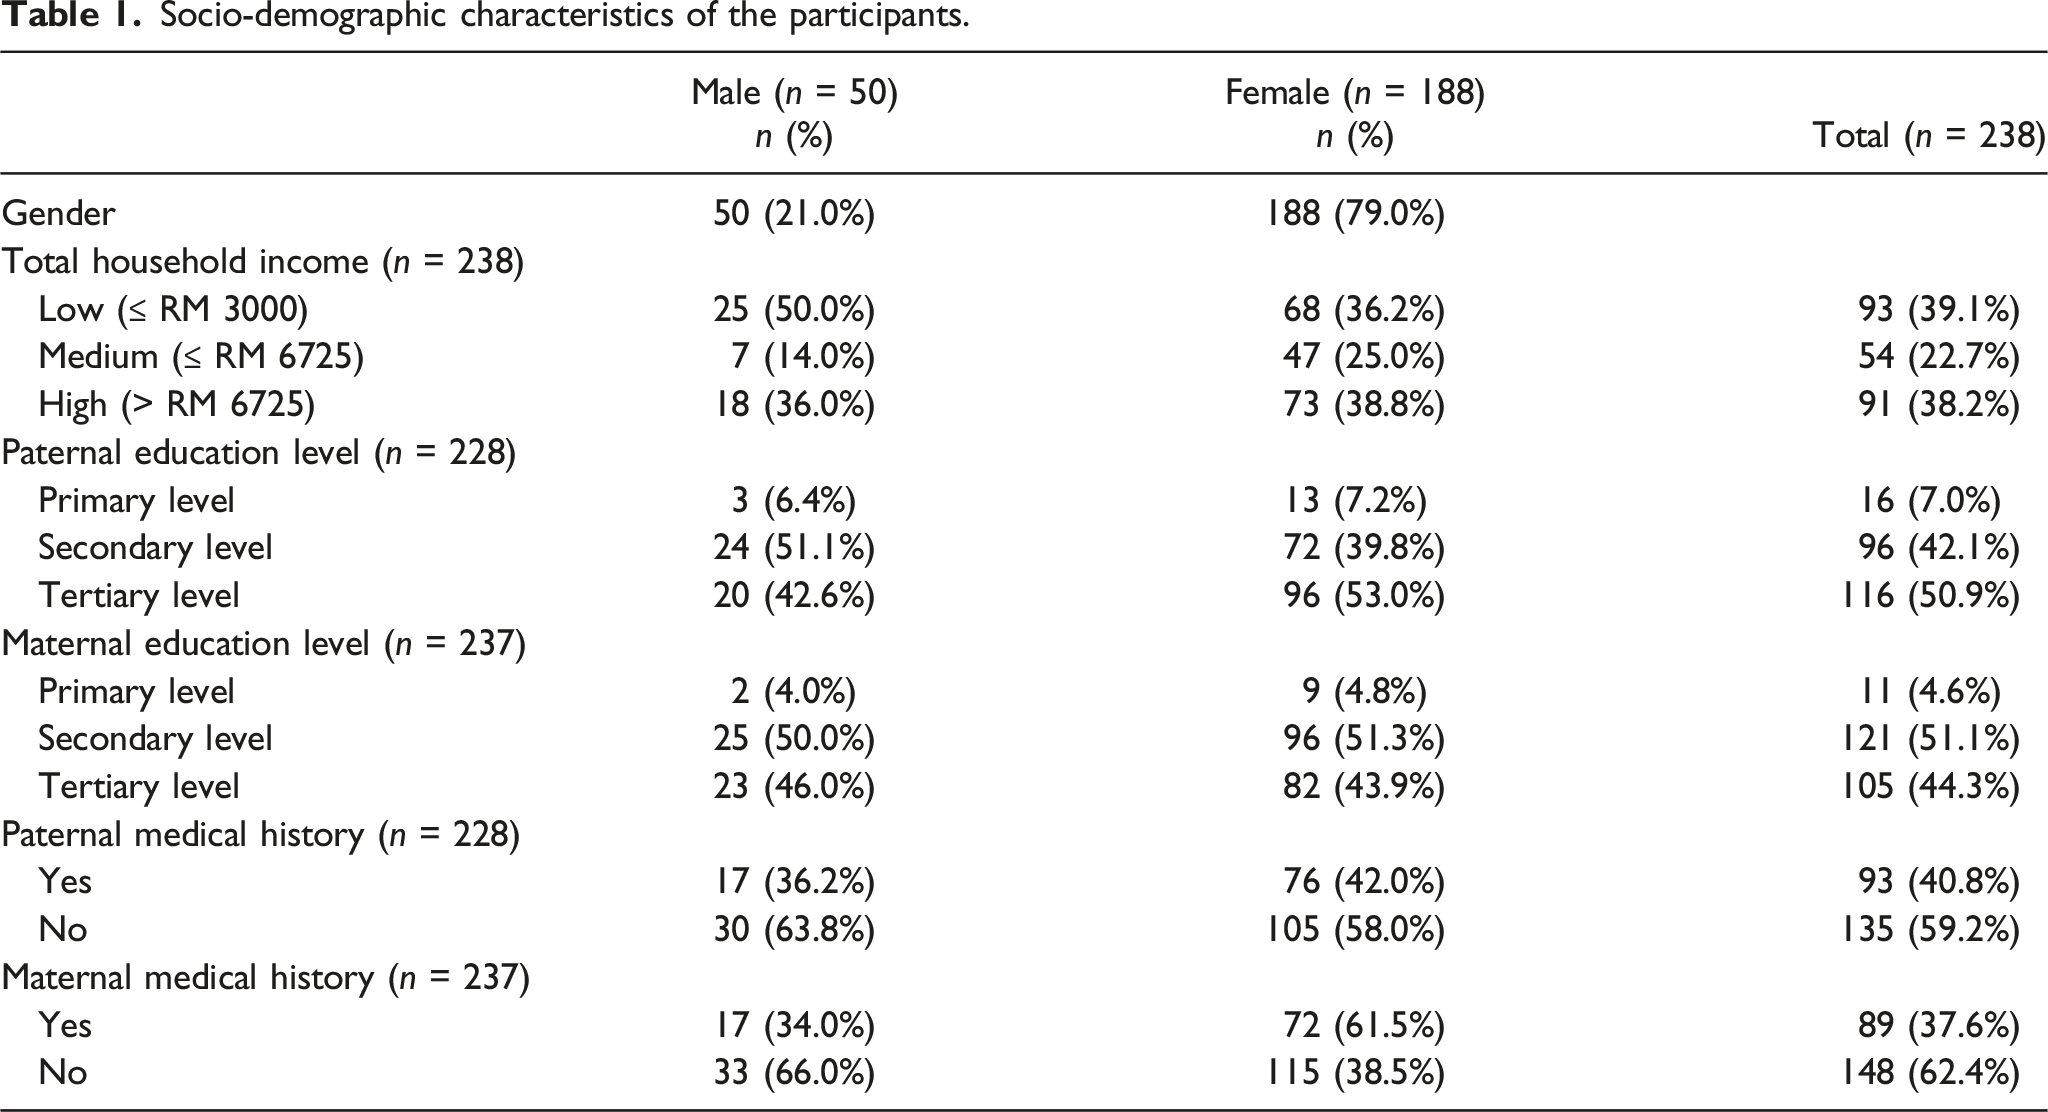
The socio-demographic questionnaire consists of three sections: personal information, and paternal and maternal information. Personal information such as age, history of disease related to MetS including hypertension, diabetes mellitus, heart disease, hypothyroidism or hyperthyroidism, paternal and maternal medical history as well as household income were obtained. For household income, categorization was done according to the latest definition released by the Department of Statistics Malaysia (2017): less than or equal to RM3000 considered as B40 (low), less than or equal to RM6275 considered as M40 (moderate), more than RM6275 considered as T20 (high).
Anthropometric measurement
The height and weight of the participants were measured to the nearest 0.1 using SECA Stadiometer 217 (SECA, Germany) and weighing scale SECA Clara 803 (SECA, Germany) respectively. All of them were informed to wear light clothes before the measurement and removed all the things such as keys, loose change, jewellery and jackets which will affect the final results. 22 The height and weight were measured three times and the average reading was recorded. The BMI was calculated and the body weight was categorized based on WHO classification 23 : (1) <-3SD: severe thinness; (2) <-3SD - <-2SD: thinness; (3) ≥-2SD - <1SD: normal; (4) 1SD-2SD: overweight; (5) >2SD: obesity.
Waist circumference was measured using an anthropometric tape (Rosscraft Anthrotape, Washington, USA) to the nearest 0.1 cm. The tape was passed around the body at the point midway between the iliac crest and the costal margin. The measurement was taken at the end of a normal expiration22,24 and was taken three times and the average reading was calculated.
Body composition measurement
The participants’ FM and LBM were measured using the bioelectrical impedance analysis (BIA) technique. The instrument used was Bodystat Quadscan 4000 (Isle of Man, United Kingdom) which is a type of direct segmental multifrequency bioelectrical impedance analysis (DSM-BIA). Prior to the measurement, the participants were asked to have overnight fasting, not to drink water and not to carry out any exercise. Besides that, the participants were asked to wear light clothing and empty their bladders prior to the assessment. During the measurement, the participants were asked to lie down in a supine position with both of their legs and arm spreading out. The skin sides were rubbed with alcohol before placement of the electrode to ensure proper electrical conduction. 25
Blood pressure measurement
Blood pressure was measured using a blood pressure monitor (Omron HEM 7203, Kyoto, Japan). Before the measurement was taken, the participant was asked not to talk during the measurement process, not to drink caffeine 30 min before the measurement, not to carry out exercises and was advised to stay calm to ensure accurate measurement. Blood pressure was taken twice and the mean blood pressure was calculated. 26
Biochemical measurement
All participants were reminded to undergo a 10–12 h of fasting before the blood sample is collected. A venous blood sample was withdrawn by a trained phlebotomist to determine the fasting glucose level and lipid profiles. The blood was centrifuged and the serum was assayed for triglycerides, and plasma glucose was assayed using a colorimetric test using Cobas 8000 instrument (Roche Diagnostics, Selangor, Malaysia) by a private laboratory with ISO qualification.
Diagnostic criteria
Metabolic syndrome is diagnosed based on the criteria published by International Diabetes Federation (IDF 2007). The participant is diagnosed when there is the presence of central obesity (WC ≥90 cm for male; ≥80 cm for female) and the other two out of four following criteria: (1) increased triglycerides (TC): ≥1.7 mmol/L or specific treatment for high triglycerides; (2) decreased HDL-c level: <1.03 mmol/L in males and <1.29 mmol/L in females; (3) ≥130/85 mmHg or treatment of previously diagnosed hypertension; (4) hyperglycaemia: fasting plasma glucose ≥5.6 mmol/L2.
Statistical analysis
Data obtained from this study were analysed using IBM SPSS for Windows, Version 22.0 (IBM Corp, 2013, Armonk, NY) and MedCalc for Windows Version 15. (MedCalc Software, Ostend, Belgium). The parametric test was used to analyse normally distributed data while the non-parametric test was used to analyse skewed data. Mann-Whitney U Test or independent t-test was used to compare the differences between values of anthropometric and metabolic parameters between gender. The significant level was set at p < .05. The cut-off value for FLMR and the reliability of this cut-off value was determined by performing Receiver Operating Characteristics (ROC) curve analysis. Binary logistic regression was used to analyse the raw data as metabolic syndrome will be classified as “MetS” or “Non-MetS” while FLMR will be classified as “higher than the threshold” or “lower than the threshold”. The threshold value was obtained after the ROC was carried out.
Results
A total of 290 participants were recruited from the sampling frame to participate in this study. All of the screened participants met the inclusion criteria and hence were invited to participate in this study. Fifty-two respondents withdrew due to personal reasons such as being unwell, needing to attend other activities, or having family matters hence the final sample achieved was 238 people which was equal to an 82.8% response rate.
Socio-demographic characteristics of the participants.
Anthropometric measurements
Anthropometric characteristics of the participants.

BMI: body mass index; WC: waist circumference; FM: fat mass; LBM: lean body mass; BF: body fat percentage; FLMR: fat-to-lean mass ratio; SD: standard deviation; IQR: inter-quartile range.
aMann-Whitney U-test was applied. Median and IQR were reported.
bIndependent t-test was applied. Mean and SD were reported.

Body weight status of the participants.
Metabolic syndrome components
Metabolic parameters of the participants.

TC: total cholesterol; HDL-c: high-density lipoprotein-cholesterol; LDL-c: low-density lipoprotein cholesterol; TG: total triglycerides; FBG: fasting blood glucose; SBP: systolic blood pressure; DBP: diastolic blood pressure; MetS: Metabolic syndrome.
aMann-Whitney U-test was applied. Median and IQR were reported.
bIndependent t-test was applied. Mean and SD were reported.
Fat to lean mass ratio as a screening tool for metabolic syndrome using receiver operating characteristics curve
Predictive properties of fat-to-lean mass ratio in identifying high risk of metabolic syndrome (n = 238).

Receiver operating characteristics curve analysis of fat-to-lean mass ratio in predicting metabolic syndrome (n = 238).
Predictive properties of fat-to-lean mass ratio in identifying high risk of metabolic syndrome among female (n = 188).

Association between fat to lean mass ratio with metabolic syndrome and its components
Association between fat versus lean mass ratio (FLMR) with MetS and its components.

aBinary logistic regression was applied using Enter method.
*value was obtained from ROC curve analysis.
**FLMR as independent variable, metabolic syndrome components as dependent variables.
B: Beta Coefficient; S.E: Standard Error; CI: Confidence Interval; OR: Odd Ratio.
Discussion
This study showed that 2.1% of the adolescents had MetS while 97.9% of them did not have MetS. This study showed a lower prevalence of MetS compared with data from Asia and Western countries which ranges from 2.4–10.1%.16,27–34 This inconsistency may be due to the difference in the definition used in diagnosing MetS as some of the studies applied the NCEP-ATP III 35 definition while some of them applied the IDF criteria which are similar to our study. Another possible explanation could be due to the age difference. In this study, subjects aged between 18 and 19-year-old where most of them are within the late puberty or post-puberty stage while the subjects in previous studies had a wider age range ranging from 7 to 19 years old. In addition, the youngest age of students enrolled in the university programme is at age 18, as such, the researchers were not able to reach the younger population which possibly skewed the final results. Several studies have demonstrated that some of the prevalence of cardiometabolic risk factors increased significantly during pre-puberty and puberty stage36–38 as adolescents entering puberty stage is associated with drastic changes in sex hormones secretion and a rapid increase in total body fat as well as BMI.37,39 Hence, it can interfere as previous studies involved subjects of younger age that are more prone to have MetS compared to this study. In addition to that, the finding of the current study is contrary to the previous research as none of the male subjects had MetS while all the MetS cases come from female subjects as our sample size for males is relatively low compared to the previous studies.
It was hypothesized that FLMR can be employed as an anthropometric tool in predicting the risk of MetS among Malaysian adolescents. This hypothesis was confirmed in our current study where the ROC curve analyses demonstrated that FLMR possessed fair discriminatory capacity as shown by the AUC value (>0.8). In addition to that, our study also confirmed the hypothesis that there was a significant association between FLMR with MetS and some of its components. The present finding is in agreement with the work of other studies. These studies revealed that FLMR was highly predictive of MetS which can be employed as useful predictors of metabolic risk in early adulthood.19,20,40,41 Interestingly, when compared with other international studies, it was found that the FLMR value obtained from the current study was higher than the cut-off value among males but lower than the value among females.19,20,41 The discrepancy could be attributed to the cut-off value developed in this study representing the whole sample size regardless of gender. As such, it is urged that study involving a larger sample size to be carried out in the future in order to develop a gender-specific cut-off value as female typically presents with higher body fat compared to male. 42 Besides that, due to the recruitment issues, our study only managed to include adolescents aged 18–19-year-old; which resulted in a higher cut-off value compared to the previous studies with adolescents aged 10–15-year-old. 43 It has been demonstrated that FLMR varies across age groups which might be due to the progressive increase of FM as age increases. 44
One of the more significant findings to emerge from this study is that adolescents who have FLMR higher than the threshold will have 13.26 times of odds of having MetS. This statistic raised an important theoretical issue about the mechanism of FLMR that have a bearing on MetS among adolescents. FM and LBM are considered two contrasting traits in maintaining homeostasis of the body. FM is characterized as “metabolic load” since it is influenced by behavioural changes such as dietary intake, sedentary behaviour and high level of adiposity which will burden or disrupt the body’s natural homeostasis mechanism. On the other hand, LBM which is made up of organs, tissues and muscles is resembled as “metabolic capacity” as all of these components are responsible for maintaining normal homeostasis processes such as regulating glucose and lipid metabolism in the body.10,45,46 Our study has successfully translated this load-capacity model into a specific predictive model for MetS by developing a specific cut-off value for FLMR. This cut-off value acts as an indicator in categorizing individuals into different body phenotypes in the way that adolescents with higher FLMR are considered to have a higher risk of having MetS. A high FLMR means the individual has a high percentage of body fat while less amount of LBM. Muscle mass or known as bone-free lean tissue is the largest component of LBM. It plays a vital role in regulating resting energy expenditure (REE) and also muscle glucose uptake. 46 In another word, an individual with low muscle mass will have lower REE which increases the risk of having obesity since REE is the largest component of energy expenditure.47,48 At the same time, a decrease in muscle mass will decrease the normal rate of glucose uptake due to insulin resistance and leads to hyperglycaemia.46,48 Since obesity and insulin resistance are the main culprits in the pathophysiology pathway of MetS, 49 it is not surprising to find that an individual with higher FLMR will have a higher risk of having MetS and its components.
Besides that, the values of FM and LBM can be easily and accurately obtained from the BIA machine, suggesting that FLMR can be used as a screening tool for MetS without performing a full physical examination. 20 The BIA machine used in this study is a segmental multi-frequency BIA (SMF-BIA) which measures impedance at five segments of the body. The accuracy of this tool in assessing body composition has been validated against dual-energy X-ray absorptiometry which is well known as a gold standard in measuring body composition. 50 Our study suggested that this safe, non-invasive and simple method can be used by healthcare professionals to determine the nutritional status of an individual. 51
The main limitation of this study is we are unable to develop a gender-specific cut-off value for FLMR among adolescents. As the prevalence of the MetS is 0% among male subjects, the ROC analysis cannot be carried out. In addition to that, our subjects are university students and have a narrowed age range. As such, the cut-off value might not be generalized and represented to the whole adolescents population. Thirdly, there are some very high odds ratios (OR) and 95% Confidence Interval (CI). This is because, following the principles of sampling theory, the width of the CI increases when the sample size decreases. The decrease in precision (high CI) is due to the variance of a statistic which is expressed by its standard error. 52 Besides that, the occurrence of outliers further increases the width of the CI. Hence, it is very difficult to draw meaningful inferences from the results of this study alone due to the width CI.
Nevertheless, this study has its strength. This is the first study conducted among Malaysian adolescents to propose a cut-off value for FLMR in predicting MetS. The cut-off value is of great significance in providing public health professionals in predicting MetS among adolescents. It acts as an indicator in categorizing individuals into different body phenotypes. Furthermore, this is also the first study to investigate the association between FLMR with MetS among Malaysian adolescents. Another significance of this study is it has identified the odds posed by adolescents with metabolic abnormalities such as abdominal obesity, dyslipidaemia and hypertension in developing FLMR higher than threshold values.
In summary, the findings from this cross-sectional study demonstrated that FLMR had a good discriminatory ability in identifying MetS among adolescents and can be used as a predictive tool in the future. This study also highlighted the high prevalence of MetS components among the adolescents with FLMR higher than the threshold value. Hence, intervention strategies such as nutrition educational talks, health screening and also booth exhibitions should be carried out in universities frequently to provide health information to the students thus preventing the progression of the risk factors among adolescents.
Footnotes
Acknowledgements
The authors would like to thank all subjects involved for their participation and cooperation during the course of this study. The effort of the researchers, data collection team, and all those involved in this project are also acknowledged.
Author contributions
J.Y.L was involved in data collection, data analysis and drafting the manuscript; B.S.W chief investigator of the research grant, development of main study design and research protocol, supervision of data collection, interpretation of results and editing of manuscript; A.M.M.J, M.R.S, M.M and P.L.L involved in manuscript editing. All authors involved in manuscript revision and have accepted responsibility for the entire content of this manuscript and approved its submission.
Data availability
The data sets generated and/or analysed during the current study are available from the corresponding author.
Ethical approval
Ethics approval was obtained from UniSZA Human Research and Ethics Committee (UHREC) with a study protocol UniSZA/UHREC/2018/64.
Informed consent
Written informed consent was obtained from all subjects before the study.
Declaration of conflicting interests
The author(s) declared no potential conflicts of interest with respect to the research, authorship, and/or publication of this article.
Funding
The author(s) disclosed receipt of the following financial support for the research, authorship, and/or publication of this article: This study was funded by UniSZA Research Project Grant (UniSZA/2017/DPU43, Project Code: R0018 – R347).