
Abstract
Individuals who are more motivated to avoid pathogenic infection tend to be more opposed to immigrants. Explanations for this relation emphasize lack of familiarity, with people who are more unfamiliar with ethnic outgroups being more likely to perceive them as a possible infection risk and therefore oppose immigration. Exposure to immigrants can increase familiarity with outgroup members. This suggests that exposure to immigrants attenuates the relationship between pathogen avoidance motivation and opposition to immigration. We tested this prediction in four studies using country-level ethnic fractionalization and segregation (Study 1) and proportion of immigrants at the local neighborhood level (Studies 2–4) as indicators of exposure to immigrants. Results showed that intergroup exposure did not attenuate the relation between pathogen avoidance motivation and opposition to immigration. This suggests that long-term exposure to ethnic outgroups is insufficient to make them and their customs nonthreatening for those with strong worries about pathogenic threats.
Keywords
Introduction
Humans have a motivational system for pathogen avoidance, often referred to as a behavioral immune system (Ackerman et al., 2018; Lieberman & Patrick, 2014; Schaller & Park, 2011; Tybur et al., 2013). The system works partially outside of conscious awareness and responds with disgust and avoidance when detecting potentially infectious people and objects (Tybur & Lieberman, 2016). Importantly, a large body of research has found that pathogen avoidance motivation—often measured with individual differences in disgust sensitivity (Tybur et al., 2009)—increases opposition to immigration (Aarøe et al., 2017; Clifford et al., 2022; Faulkner et al., 2004; Huang et al., 2011; Karinen et al., 2019).
Why would disgust sensitivity relate to opposition to immigration? Several explanations in the literature on disgust sensitivity point to a role for lack of familiarity. Studies have found that the relationship between pathogen avoidance motivation and anti-immigration attitudes seems to be specific to immigration from unfamiliar (i.e., subjectively foreign) countries (Aarøe et al., 2017; Faulkner et al., 2004). Furthermore, Karinen et al. (2019) found that the relation between pathogen avoidance motivation and anti-immigration attitudes was stronger when immigrants were described as not assimilating to local customs than when they were described as assimilating to local customs. These results highlight how the link between pathogen avoidance and opposition to immigrants depends on the perception of immigrants and their customs as unfamiliar and foreign.
Prior studies emphasize that due to the difficulty of detecting pathogens and the potentially lethal consequences of getting infected, psychological mechanisms for pathogen avoidance “evolved to be hyper-vigilant against unfamiliar stimuli, including unfamiliar individuals” (Aarøe et al., 2017, p. 278; see also Schaller & Park, 2011; Tybur & Lieberman, 2016). Simple exposure, even though it does not involve active interaction, is a way of generating some increased familiarity with another individual (Moreland & Beach, 1992). In this way, simple exposure to immigrants in the local environment should generate some increased familiarity with them and their appearance even without active interaction. 1 Given the emphasis in research on unfamiliarity as a key factor in the psychological mechanism linking hypervigilant pathogen avoidance motivation to opposition to immigration, it is possible that exposure to immigrants attenuates this relationship. This study provides an empirical assessment of this prediction.
The behavioral immune system operates based on indirect cues of the presence of pathogen threat as pathogens are not visible to the naked eye. “Given the asymmetry in costs of false alarm versus misses” (Tybur & Lieberman, 2016, p. 7), the system operates in a “better safe than sorry” logic treating a number of noninfectious deviations from the standard prototype (e.g., large facial birthmarks, disfigurements, deformities; Ryan et al., 2012) as cues of potential pathogen risk (Schaller & Park, 2011). Disgust responses can be learned through classical conditioning and by observing the reactions of other individuals (Tybur & Lieberman, 2016). This raises the possibility that the familiarity generated from repeated simple exposure leads individuals to be more inclined to see immigrants and their norms as part of the standard prototype.
We here examine the hypothesis that simple exposure may decrease the propensity of pathogen avoidance mechanisms to tag ethnic differences as a pathogen cue. On this hypothesis, familiarity with immigrants generated from repeated simple exposure should attenuate the correlation between pathogen avoidance motivations and opposition to immigration. The current study is—to our knowledge—the first to theoretically develop and empirically test this claim directly. We operationalized exposure to immigrants as country-level ethnic fractionalization and segregation (Study 1) and proportion of (non-Western) immigrants at the local neighborhood level (Studies 2–4). We discuss the implications of the findings for the effect of long-term exposure to ethnic outgroups on pathogen avoidance motivated outgroup prejudice and xenophobia.
Study 1
The aim of Study 1 was to conduct a general test of the prediction. Specifically, we used data from Tybur et al. (2016). In terms of both sample size and number of countries, this is currently the largest existing cross-cultural survey that includes individual difference measures of pathogen avoidance motivation and opposition to immigration to which we added measures of exposure to immigrants.
Method
The total sample included respondents from 31 countries (those reported by Tybur et al., 2016, plus a sample from Italy, N = 360, 182 women, 178 men). Surveys were administered in the official or native language in all countries except Sweden (where English fluency is high). We included all adult respondents (18 years or older) in the analysis, which resulted in a total sample of N = 11,848 (6,769 women, 4,974 men, 105 gender unknown). Some country samples consisted of university students; other samples were diverse samples from the general population. For further details of the samples and method, see Tybur et al. (2016). Due to missing data, the models for the primary analysis had N = 11,694 with an average sample size per country of 377.2 (range = 115–1,078).
The survey included one item measuring views about immigration: “Should your country be more open to immigrants?” (answer options: no, yes). We coded responses so that 1 reflected opposition to immigration and 0 a lack of opposition. There was substantial variation across the subsamples in the responses to this item (see Figure S1 in the Supplementary Materials; for additional descriptive statistics, see Table S1 in the Supplementary Materials).
Regression Coefficients for Predicting Opposition to Immigration From Disgust Sensitivity and Fractionalization (Study 1)
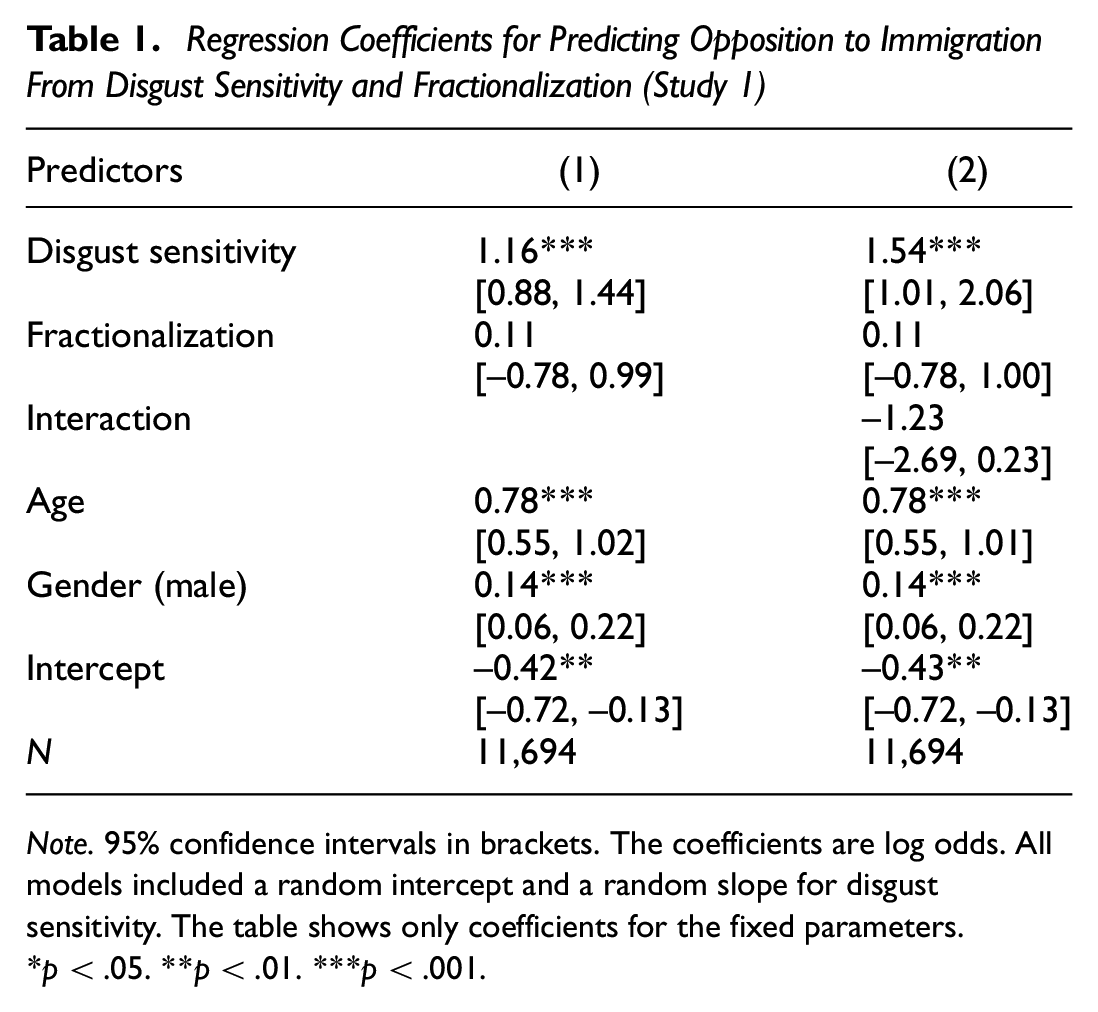
Note. 95% confidence intervals in brackets. The coefficients are log odds. All models included a random intercept and a random slope for disgust sensitivity. The table shows only coefficients for the fixed parameters.
p < .05. **p < .01. ***p < .001.
To measure disgust sensitivity, we used the seven-item pathogen disgust sensitivity scale, which is one of the most widely used measures of individual differences in pathogen avoidance motivation (Cronbach’s α = .75) (Tybur et al., 2009). Respondents indicated how disgusting they find seven different situations (e.g., “Stepping in dog poop”, 0 = not at all disgusting, 6 = extremely disgusting). Figure S1 in the Supplementary Materials shows the variation in disgust sensitivity across countries.
The moderator, exposure to immigrants, was measured using three country-level measures of ethnic diversity, that is, ethnic fractionalization and segregation. As our primary measure, we used ethnic fractionalization (Alesina et al., 2003), which expresses the probability that two randomly chosen individuals are of different ethnic origin (higher values indicate more ethnic fractionalization and presumably higher exposure). In secondary analyses, we examined two alternative measures: Fearon’s index of ethnic fractionalization (Fearon, 2003) and an index of ethnic segregation (Alesina & Zhuravskaya, 2011). Fearon’s index has no estimate for Serbia and the segregation index has no estimates for Poland, Serbia, Bosnia, and Singapore. For the segregation index, higher values reflect more segregation, and thus indicate lower levels of exposure.
Results
We analyzed the association between disgust sensitivity and opposition to immigration using multilevel logistic regressions, in which individuals (Level 1) were nested within countries (Level 2). We scaled all predictors to range from 0 to 1 for comparability, and predictors were centered within clusters (Enders & Tofighi, 2007) to remove differences between countries. All models included random intercepts and random slopes for disgust sensitivity. The country-level measures of exposure to immigrants were included as Level 2 variables.
We first regressed opposition to immigration on disgust sensitivity, age, gender, and ethnic fractionalization (see Table 1, Model 1). Higher disgust sensitivity was associated with stronger opposition to immigration, p < .001. In Model 2, we added the interaction between disgust sensitivity and ethnic fractionalization. The point estimate for the interaction coefficient was negative as predicted, but not significant, p = .099. To allow for a nonlinear interaction and to safeguard against lacking common support (Hainmueller et al., 2019), we also estimated a model with a trichotomized measure of fractionalization (low, medium, and high fractionalization; cutoffs were set at the 33rd and 66th percentile). This analysis did not suggest a nonlinear interaction (see Figure 1).
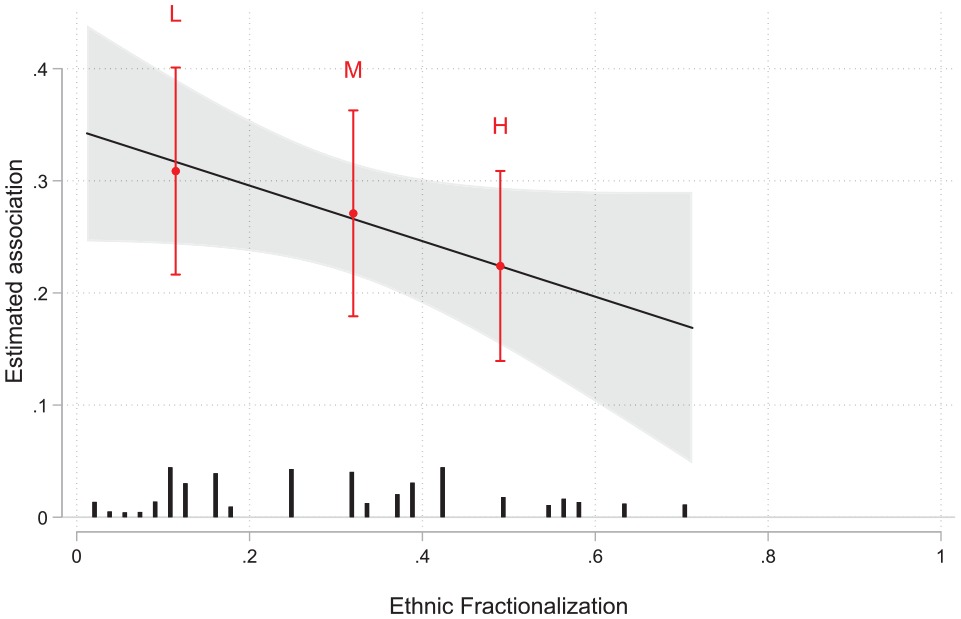
Estimated Association Between Disgust Sensitivity and Opposition to Immigration Across Levels of Ethnic Fractionalization (Study 1)
We repeated these analyses with the two alternative indexes of intergroup exposure (see Supplementary Materials, Table S2 and Figures S2 and S3). This showed similar results; the signs of the interaction terms indicated that the association between disgust sensitivity and opposition to immigration was weaker at higher levels of fractionalization and stronger at higher levels of segregation, but as in the main analysis, these interactions were not significant.
Regression Coefficients for Predicting Opposition to Immigration From Disgust Sensitivity and Zip Code Proportions of Immigrants and NW Immigrants (Study 2)
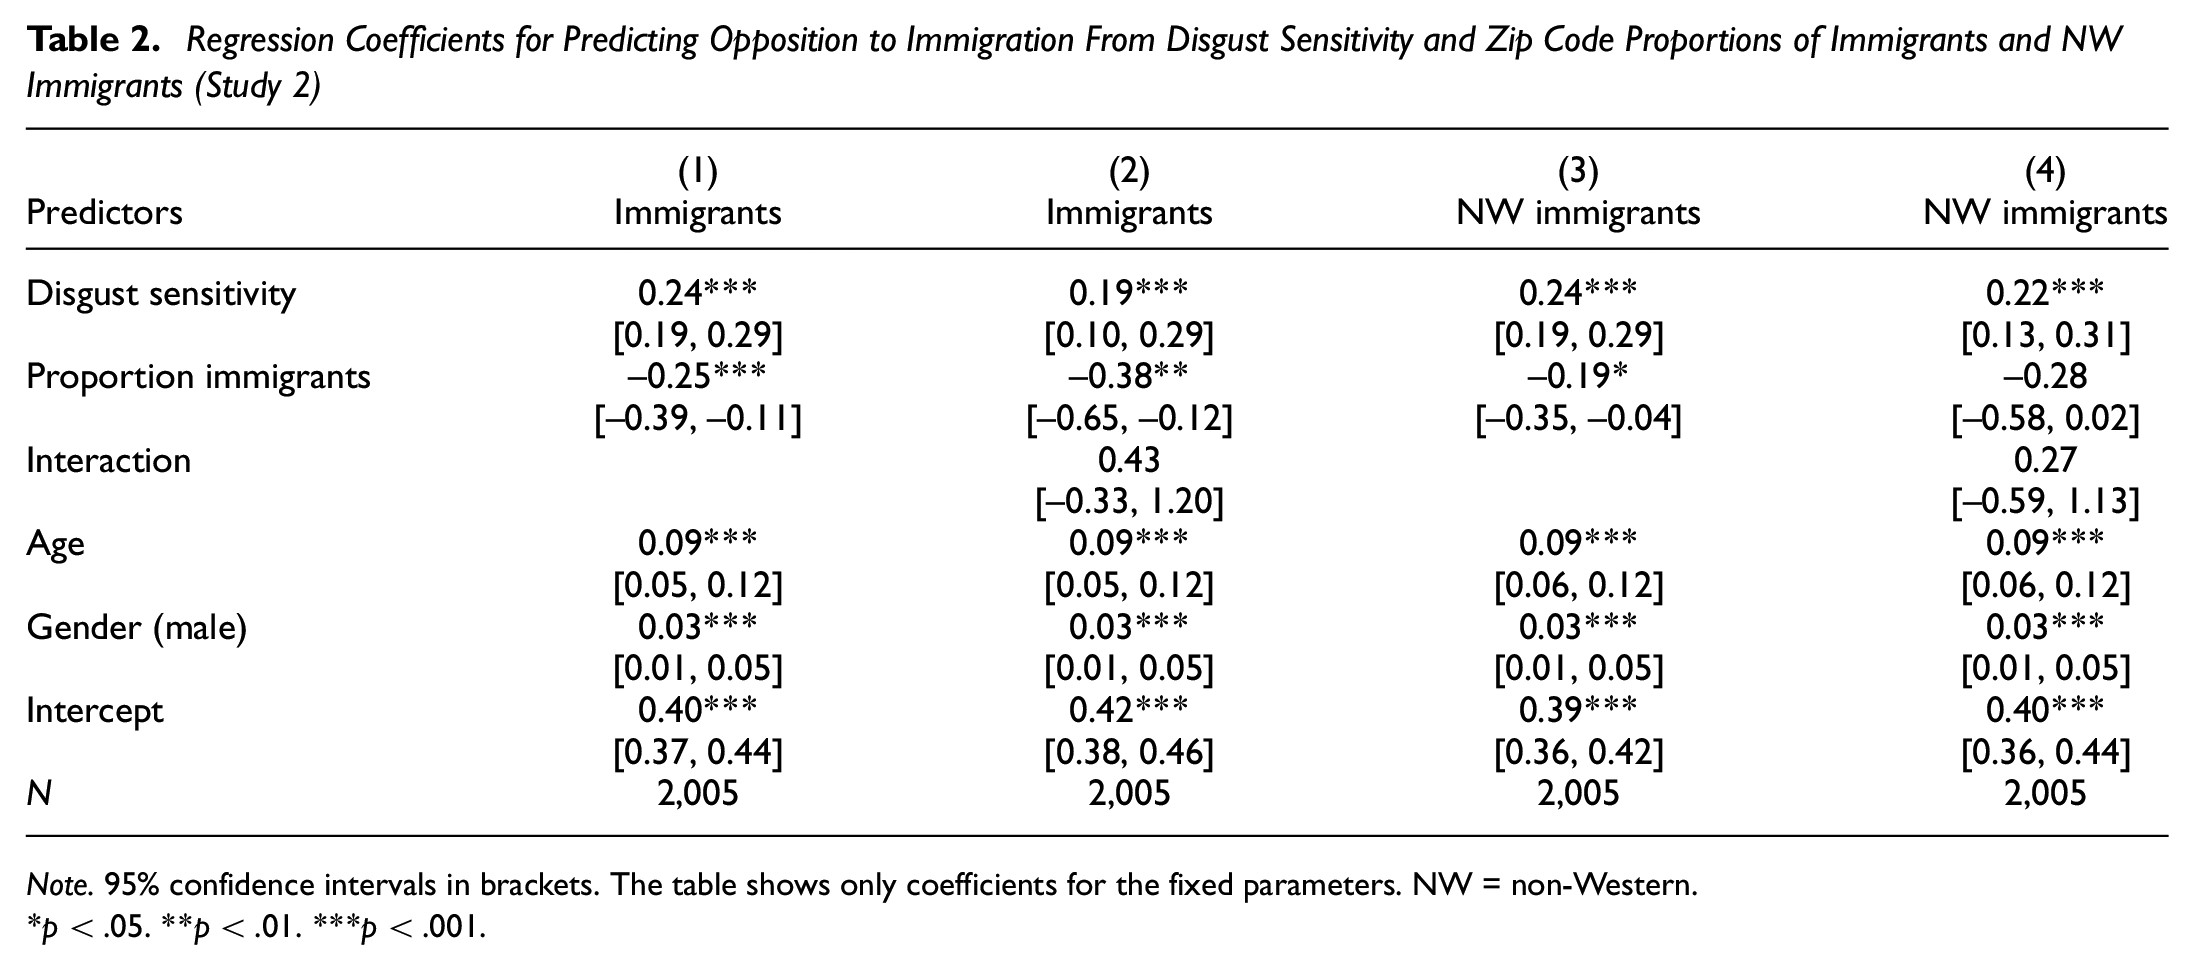
Note. 95% confidence intervals in brackets. The table shows only coefficients for the fixed parameters. NW = non-Western.
p < .05. **p < .01. ***p < .001.
Discussion
The analysis replicated that pathogen avoidance motivation related to opposition to immigration. This finding is in line with previous work (Aarøe et al., 2017; Clifford et al., 2022; Ji et al., 2019; Karinen et al., 2019). However, the analysis did not support the hypothesis that the relation between disgust sensitivity and opposition to immigration is moderated by nation-level measures of intergroup exposure as indexed by either ethnic fractionalization or ethnic segregation.
The results are qualified by the following limitations. The nonsignificant interaction term could be a false negative (i.e., Type II error) due to insufficient power to detect a small cross-level interaction. We estimated the achieved power of our analysis with the method developed by Olvera Astivia et al. (2019). This analysis showed that given the sample size and the parameters observed for the other predictor variables, power was .86 to observe a negative interaction with a small effect size (i.e., equivalent to d = −0.20) (for details, see Supplementary Materials). Hence, the nonsignificant interaction is unlikely to be the result of low power.
However, the country-level variables of fractionalization and segregation were crude measures of individuals’ exposure to immigrants and the dichotomous measure of opposition to immigration was not fine-grained. Also, the samples were not representative of national populations and immigration policy differs across countries, which could result in measurement invariance across countries. Finally, opposition to immigration may be influenced by unobserved country-level variables. To address these concerns, we conducted three additional tests.
Study 2
The aim of Study 2 was to test the prediction using (a) a more direct measure of exposure to immigrants, (b) a more fine-grained measure of opposition to immigration, and (c) a nationally representative sample. Specifically, Study 2 analyzed survey data with information about the proportion of immigrants in the residential zip code area for each respondent.
Method
We reanalyzed survey data from Sample 2 reported in Aarøe et al. (2017). These data were collected as an online survey collected in Denmark and include measures of disgust sensitivity, attitudes toward immigration, and the respondent’s local zip code. Respondents were recruited by the survey agency YouGov in 2013 (N = 2,005). The survey agency used quota sampling to generate an approximate representative sample of the adult population with respect to gender, age, education, and geography. The data did not include information on immigration status (i.e., respondents may have been born in another country). The survey was administered in Danish. For details on the survey and sample, see Aarøe et al. (2017).
The survey included a validated measure of disgust sensitivity, the Disgust Scale–Revised (Olatunji et al., 2008). Following the original study, we focused the analysis on the contamination disgust subscale (five items, Cronbach’s α = .61) as this subscale most directly measures individual differences in pathogen avoidance motivation. The survey also included six items to measure opposition to immigration (e.g., “Immigrants improve Danish society by bringing in new ideas and cultures” [reverse scored], Cronbach’s α = .84) rated on 7-point scales from strongly disagree (0) to strongly agree (6).
To measure exposure to immigrants, we merged data on the respondents’ zip code with administrative data from 2013 on the proportion of the population that consisted of (a) immigrants and (b) non-Western immigrants. Denmark is divided into 1,459 zip codes. The survey included respondents from 427 zip codes. Across these zip codes, the population size ranged from 35 to 114,047 (median = 22,325), the number of immigrants ranged from seven to 23,746 (median = 2,223), and the number of non-Western immigrants ranged from three to 17,522 (median = 1,813). The primary analysis below showed that the number of respondents per zip code ranged from one to 47 (M = 4.7). For each respondent, this generated measures of (a) the proportion of immigrants in their local zip code area and (b) the proportion of non-Western immigrants in their local zip code area. Both measures were heavily right skewed (see histograms in Figure 2), so we also used transformed measures. Specifically, we used the square root of the proportion, which implies putting more weight on changes at low proportions (see Supplemental Figures S4 and S5). Like in Study 1, we also estimated models using trichotomized versions of the exposure variables.
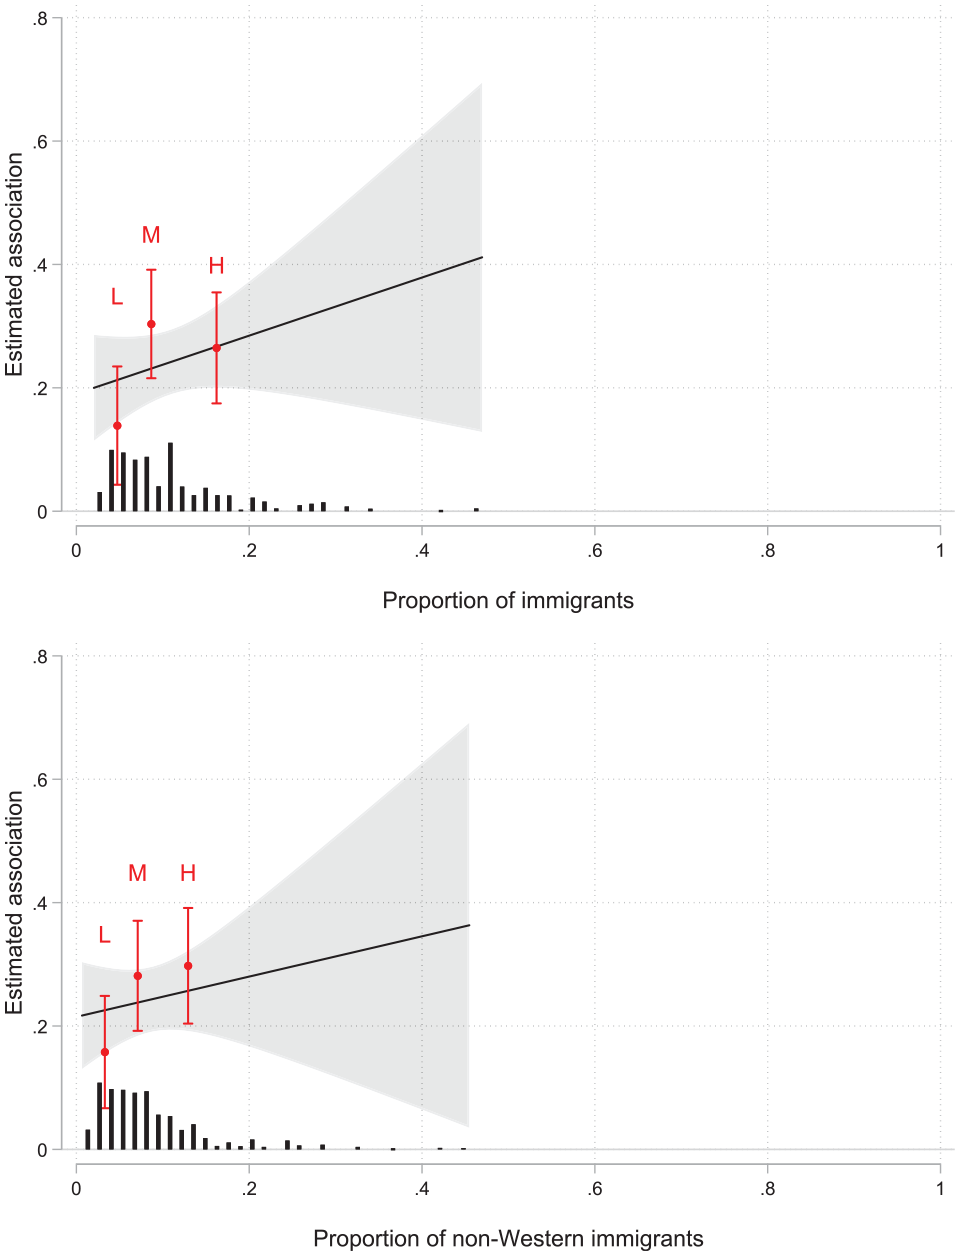
Estimated Association Between Disgust Sensitivity and Opposition to Immigration Across the Proportion of Immigrants (Top Panel) and Non-Western Immigrants (Bottom Panel) Per Zip Code (Study 2)
Results
We fitted multilevel regression models to examine the relation between opposition to immigration, contamination disgust sensitivity, and proportion of immigrants in the respondent’s local zip code area. To ease the interpretation of the unstandardized regression coefficients, all Level 1 variables were rescaled to range from 0 to 1. 2 Respondents (Level 1) were nested in zip codes (Level 2). In Model 1, reported in Table 2, we regressed opposition to immigration on contamination disgust sensitivity, age, respondent gender (Level 1), and proportion of immigrants in the local zip code area (Level 2). The intercept and slope of disgust sensitivity were allowed to vary across zip codes. 3 In Model 2, we added the interaction between disgust sensitivity and the local proportion of immigrants. Figure 2 illustrates the interaction results from Model 2. Disgust sensitivity had a significant and positive relation with opposition to immigration, but its interaction with the proportion of immigrants was not significant, p = .269. We also fitted models that included the local proportion of non-Western immigrants. These models showed similar results (see Table 2, Model 4 and bottom panel of Figure 2). While the linear interactions in Study 2 were not significant, it is possible that the interaction between disgust sensitivity and exposure to immigrants is nonlinear. Figure 2 suggests that the strongest association between disgust sensitivity and opposition to immigration is observed at intermediate levels of local presence of immigrants (for the Danish context).
We examined the robustness of these results. To evaluate whether the results were due to skew in the proportions of immigrants, we estimated models with square-root-transformed proportions (see Supplemental Table S5 and Figures S4 and S5). To evaluate whether the results were specific to the measure of disgust sensitivity, we fitted models that included the full Disgust Sensitivity–Revised scale instead of the contamination disgust subscale. To verify that the results were not an artifact of particular specifications of the multilevel models, we fitted regular OLS models. All these analyses showed that the interactions between disgust sensitivity and proportion of immigrants had positive signs but were not significant.
We estimated the power of this study with regard to the interaction effect (for details, see Supplementary Materials). The power analysis estimated that power > .99 to detect an interaction when r = –.20, power = .99 when r = –.15, and power = .82 when r = –.10.
Discussion
Using a more local measure of exposure to immigrants and a more fine-grained measure of opposition to immigrants, the overall conclusion from Study 2 is similar to that of Study 1: There was no evidence that more exposure to immigrants reduced the association between disgust sensitivity and opposition to immigration.
One limitation was that some respondents might have been immigrants themselves and therefore may not perceive immigrants as unfamiliar in the first place. This limitation would likely attenuate the association between disgust sensitivity and opposition to immigration, which in turn would reduce power to observe an interaction effect for the majority population. Study 3 addresses this concern.
Study 3
Study 3 was a replication of Study 2, using a different measure of disgust sensitivity (the same as in Study 1) and a different measure of opposition to immigration. In Study 3, we were able to exclude immigrants and descendants.
Method
We analyzed data from an online survey with inhabitants of Denmark (N = 552) recruited by the survey agency YouGov in December 2016. The survey agency used quota sampling to generate an approximate representative sample of the adult population with respect to gender, age, education, and geography. The survey was administered in Danish and included additional questions for other research projects. Five-hundred forty-five respondents had answered at least one question on immigration views (see below). We excluded 43 respondents who indicated that they or their parents were not born in Denmark, resulting in N = 502. As in Study 1, the survey included the seven-item pathogen disgust scale from the Three-Domain Disgust Scale (Tybur et al., 2009), which we used to measure disgust sensitivity (Cronbach’s α = .81). The survey included three items that explicitly asked for attitudes about immigration: “Immigrants who are sentenced to jail for crime should be expelled immediately,”“Foreigners should only be eligible for Danish citizenship once they have learned to behave like Danes,” and “Immigration poses a serious threat to our national identity.” Participants indicated agreement with these statements on a 5-point scale from strongly disagree (1) to strongly agree (5). Don’t know responses were coded as missing. We used the average response to these three items as a measure of opposition to immigration (Cronbach’s α = .83).
As in Study 2, we merged the information on the respondents’ zip code with administrative data (from 2013) on the proportion of the population that consisted of immigrants and non-Western immigrants. The survey included respondents from 236 zip codes. Across these zip codes, the population size ranged from 70 to 114,047 (median = 21,292), the number of immigrants ranged from 10 to 23,746 (median = 2,062), the number of non-Western immigrants ranged from six to 17,522 (median = 1,769). The primary model included respondents from 236 zip codes, with the number of respondents per zip code ranging from one to 13 (M = 2.1).
Results
We used the same analytic approach as in Study 2. However, the model with the interaction between disgust sensitivity and local proportion of immigrants did not converge, so we refrained from estimating the random slopes for disgust sensitivity. Table 3 shows the key results and Figure 3 illustrates the interaction. Disgust sensitivity had a significant and positive relation with opposition to immigration (see Table 3, Model 1), but its interaction with proportion of immigrants was not significant, p = .388 (Model 2). Models that included the proportion of non-Western immigrants showed similar results (see Table 3, Models 3 and 4, and Figure 3).
Regression Coefficients for Predicting Opposition to Immigration From Disgust Sensitivity and Proportions of Immigrants and NW Immigrants (Study 3)
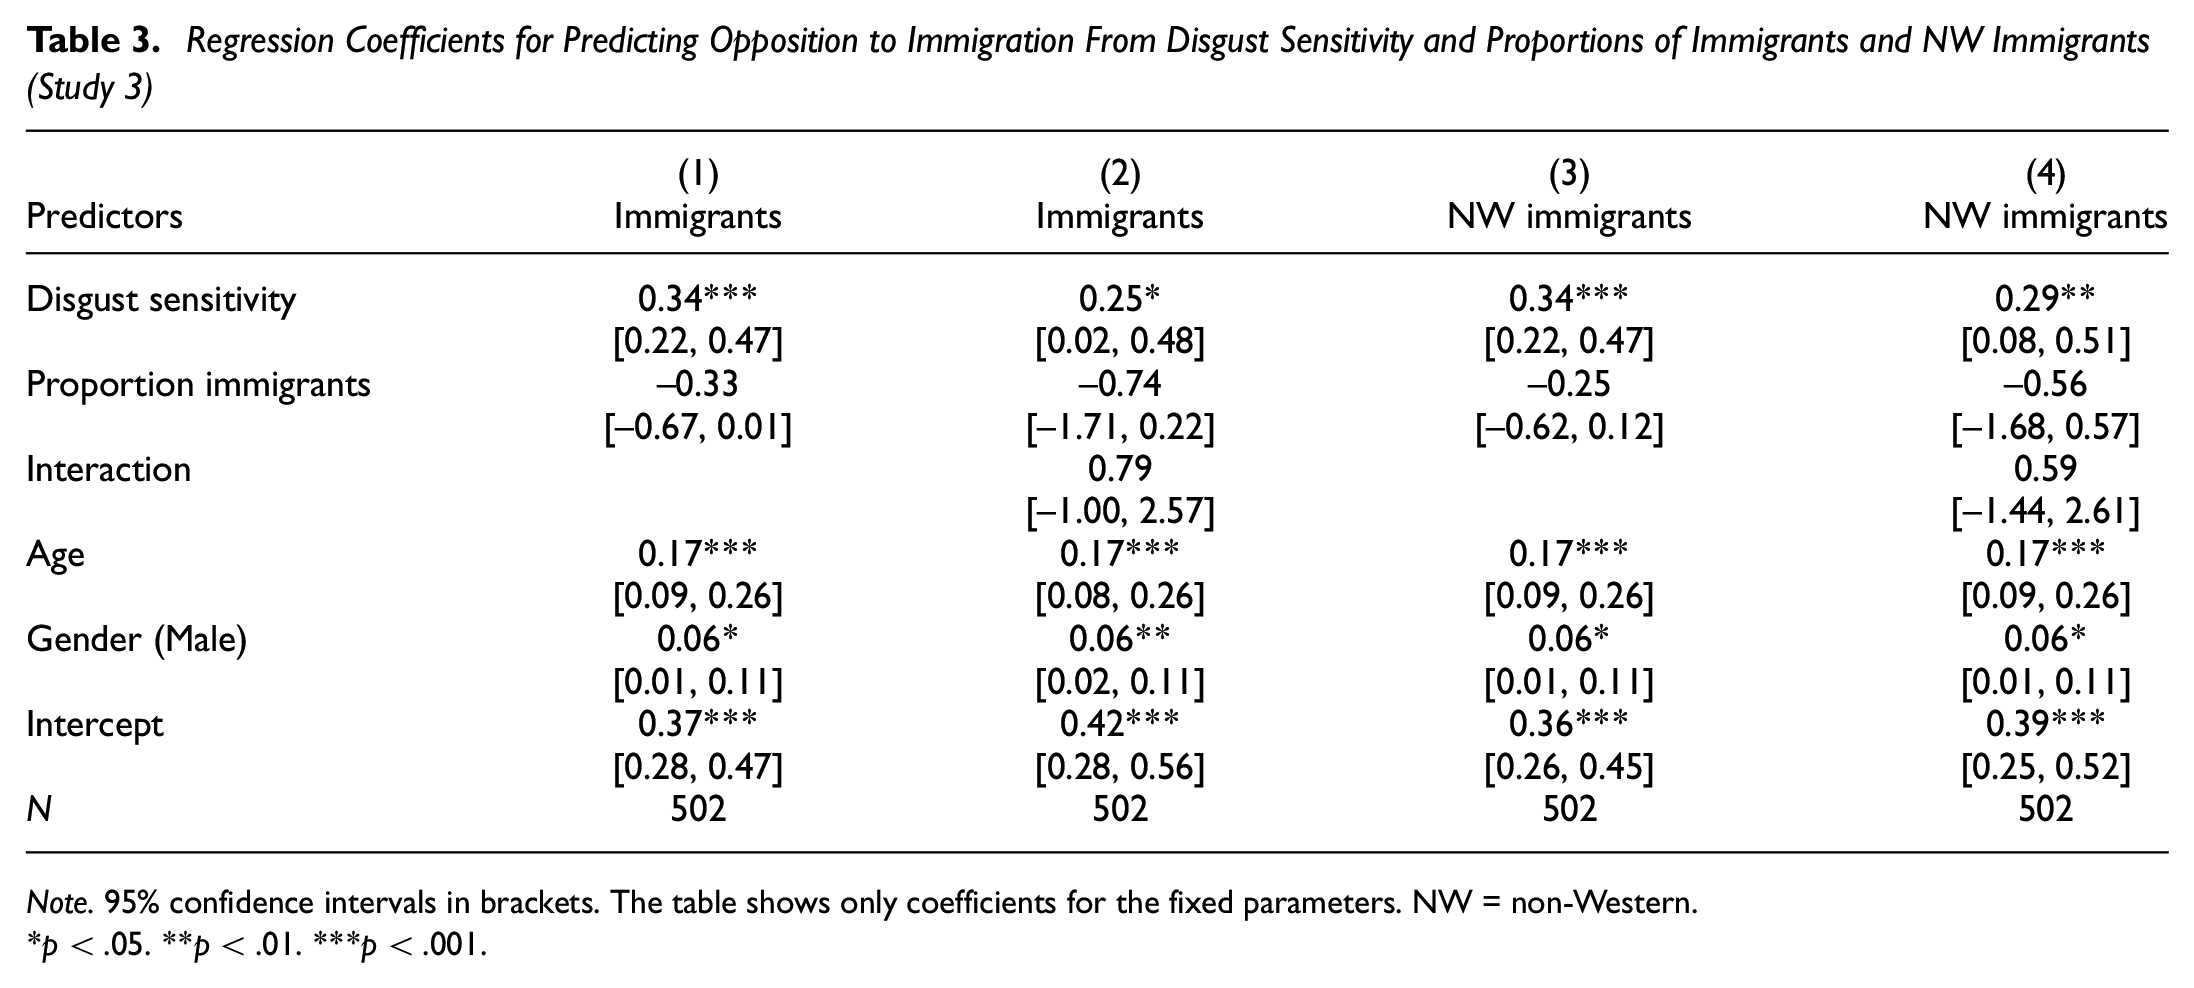
Note. 95% confidence intervals in brackets. The table shows only coefficients for the fixed parameters. NW = non-Western.
p < .05. **p < .01. ***p < .001.
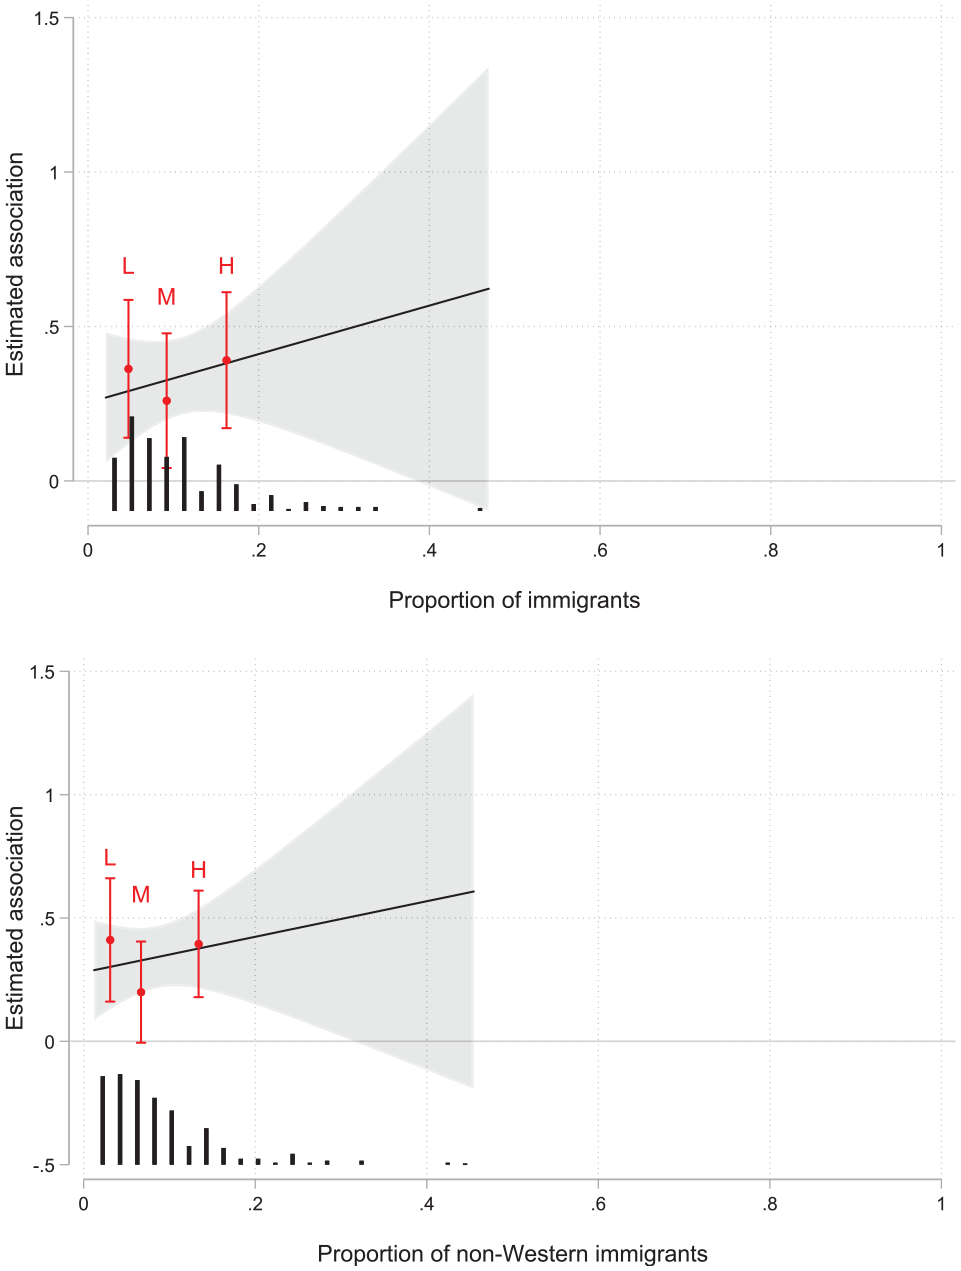
Estimated Association Between Disgust Sensitivity and Opposition to Immigration Across the Proportion of Immigrants (Top Panel) and Non-Western Immigrants (Bottom Panel) Per Postcode (Study 3)
We examined the robustness of the results. Models with square-root-transformed proportions (see Supplemental Table S8 and Figures S6 and S7) showed that the interaction between disgust sensitivity and proportion of immigrants had a positive sign but was not significant. We estimated the power to detect a small attenuating interaction effect with the same procedure as in Study 2 (for details see Supplementary Materials). The power analysis estimated that for detecting an interaction effect, the study had power = .94, .73, and .42, to detect true effects of r = −.20, −.15, and −.10, respectively.
Discussion
Consistent with Study 2, Study 3 showed no evidence that exposure to immigrants as indexed by the proportion of immigrants in the local zip code area moderated the relation between disgust sensitivity and opposition to immigration. Regarding the possibility of a nonlinear interaction, Study 2 pointed (tentatively) to a stronger association in areas with an intermediate proportion of immigrants. However, Study 3 pointed (tentatively) to the opposite pattern, with slightly weaker associations for respondents living in areas with a middle-range proportion of immigrants.
Study 4
The aim of Study 4 was to provide a final test of the prediction using even more fine-grained measures of exposure to immigrants. As indicated by the variation in inhabitants in each zip code area, some areas are quite large and, hence, there may be significant differences between daily exposure within zip code areas. Accordingly, in Study 4 we made use of a possibility to calculate the proportion of immigrants and the proportion of non-Western immigrants living within a radius of 250 m from each respondent, that is, their immediate neighborhood (cf. Dinesen & Sønderskov, 2015).
Method
We analyzed data from the Danish National Election Study, a combined online/face-to-face survey among eligible Danish voters aged 18 to 76 (response rate = 48.6 %, N = 2,001). The sample was prestratified on age, gender, and geographical region. The survey was collected between June and October 2015 and was administered in Danish (Hansen & Stubager, 2016). We excluded from the analysis 210 respondents who themselves or their parents were not born in Denmark, had missing information on one or more covariates, and/or had fewer than 10 neighbors living within 250 m from their residence, resulting in N = 1,791. A power analysis based on the effect sizes observed in the previous studies estimated that with this sample size, the study had power = .99, .99, and .87, for detecting interaction effects of r = −.20, −.15, and −.10, respectively.
To measure disgust sensitivity, respondents were presented with brief statements from a discussion between two individuals, A and B, and asked whether they agreed most with individual A or B. Specifically, they read “A says, ‘I never touch the toilet with any part of my body in a public restroom.’ B says, ‘I don’t think it is disgusting to sit on the toilet seat on a public toilet.’” Respondents were asked to provide their response on an 11-point scale ranging from agree most with A (0) to agree most with B (10). Answers were rescaled from 0 to 1 with higher values indicating higher disgust sensitivity (M = 0.52, SD = 0.31). This question wording was developed by Aarøe and Petersen (2017) and has (with a dichotomous response format) been validated as a measure of disgust sensitivity (Fournier et al., 2021). To measure opposition to immigration, we used the average response to four items. Specifically, respondents were asked (a) whether the public sector spends “too many, appropriate or too little money on ... refugees and immigrants,” (b) whether they agreed that “Immigration poses a serious threat against our national identity,” (c) whether they agreed that “Refugees and immigrants should have the same right to social assistance as Danes, even if they are not Danish citizens,” and (d) where they would place themselves on a scale from 1 to 5 “where 1 stands for us to receive far fewer refugees than now, 2 stands for slightly fewer refugees, 3 stands for the same number as now, 4 stands for a little more refugees, and 5 stands for us to receive many more refugees than we do now.” Answers were reversed coded where appropriate and summed to form a scale (rescaled 0–1) with higher values indicating more opposition to immigration (M = 0.59, SD = 0.29; Cronbach’s α = .84). The association between these measures has previously been reported in Aarøe and Petersen (2017).
Importantly, to measure exposure to immigrants, we follow the approach introduced by Dinesen and Sønderskov (2015) and calculated the proportion of immigrants (M = 0.11, SD = 0.10) and the proportion of non-Western immigrants (M = 0.07, SD = 0.09) living within a radius of 250 m from each respondent, that is, their immediate neighborhood. Both measures were heavily right skewed (see Figure 4), so we also used measures transformed with the square-root as in Study 2 and 3; Supplemental Figures S8 and S9 show the transformed distribution). As in the studies above, we also used trichotomized versions of the exposure variables (low, medium, and high exposure; cutoffs were set at the 33rd and 66th percentile).
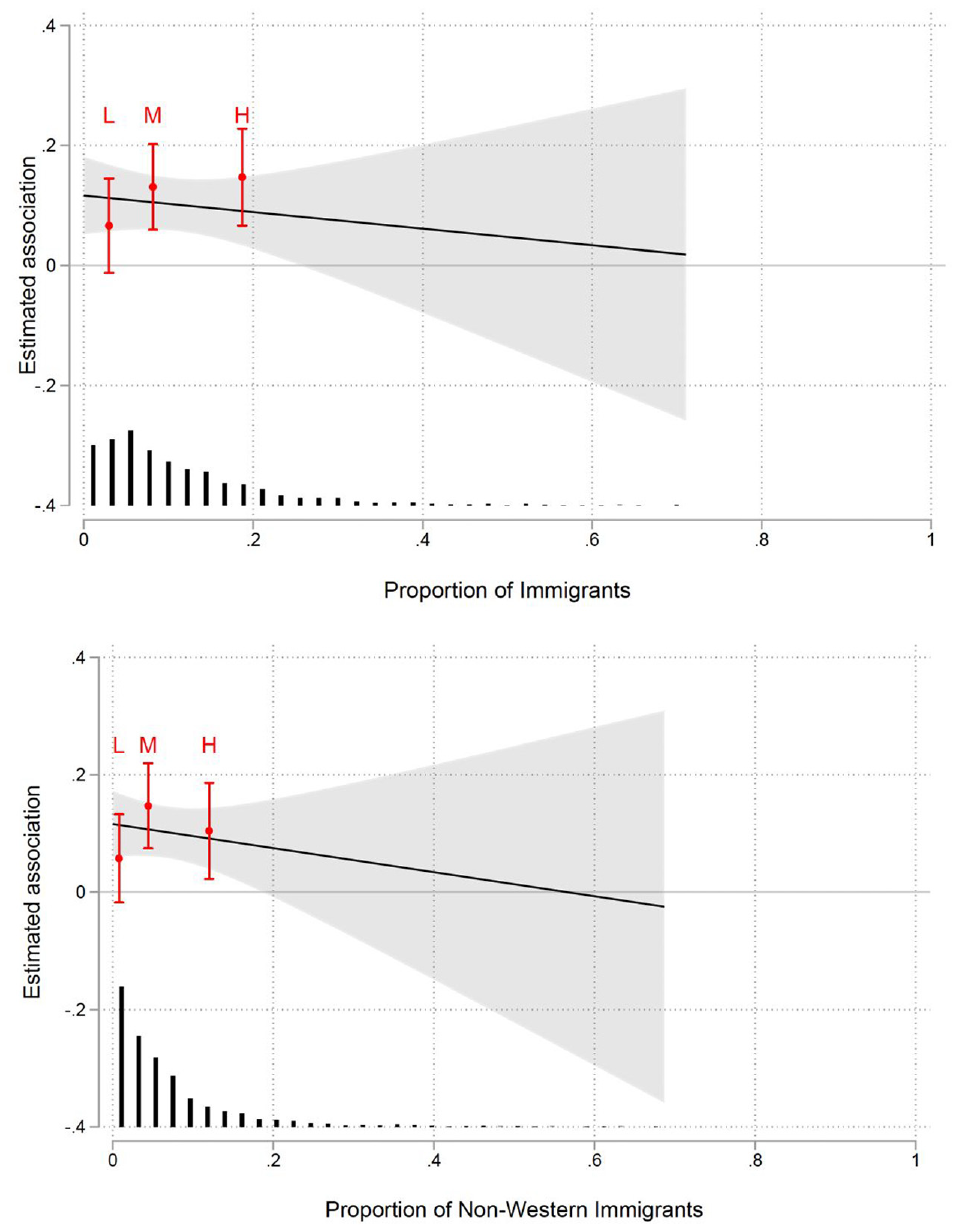
Estimated Association Between Disgust Sensitivity and Opposition to Immigration Across the Proportion of Immigrants (Top Panel) and Non-Western Immigrants (Bottom Panel) in Neighborhood (Study 4)
Regression Coefficients for Predicting Opposition to Immigration (Study 4)
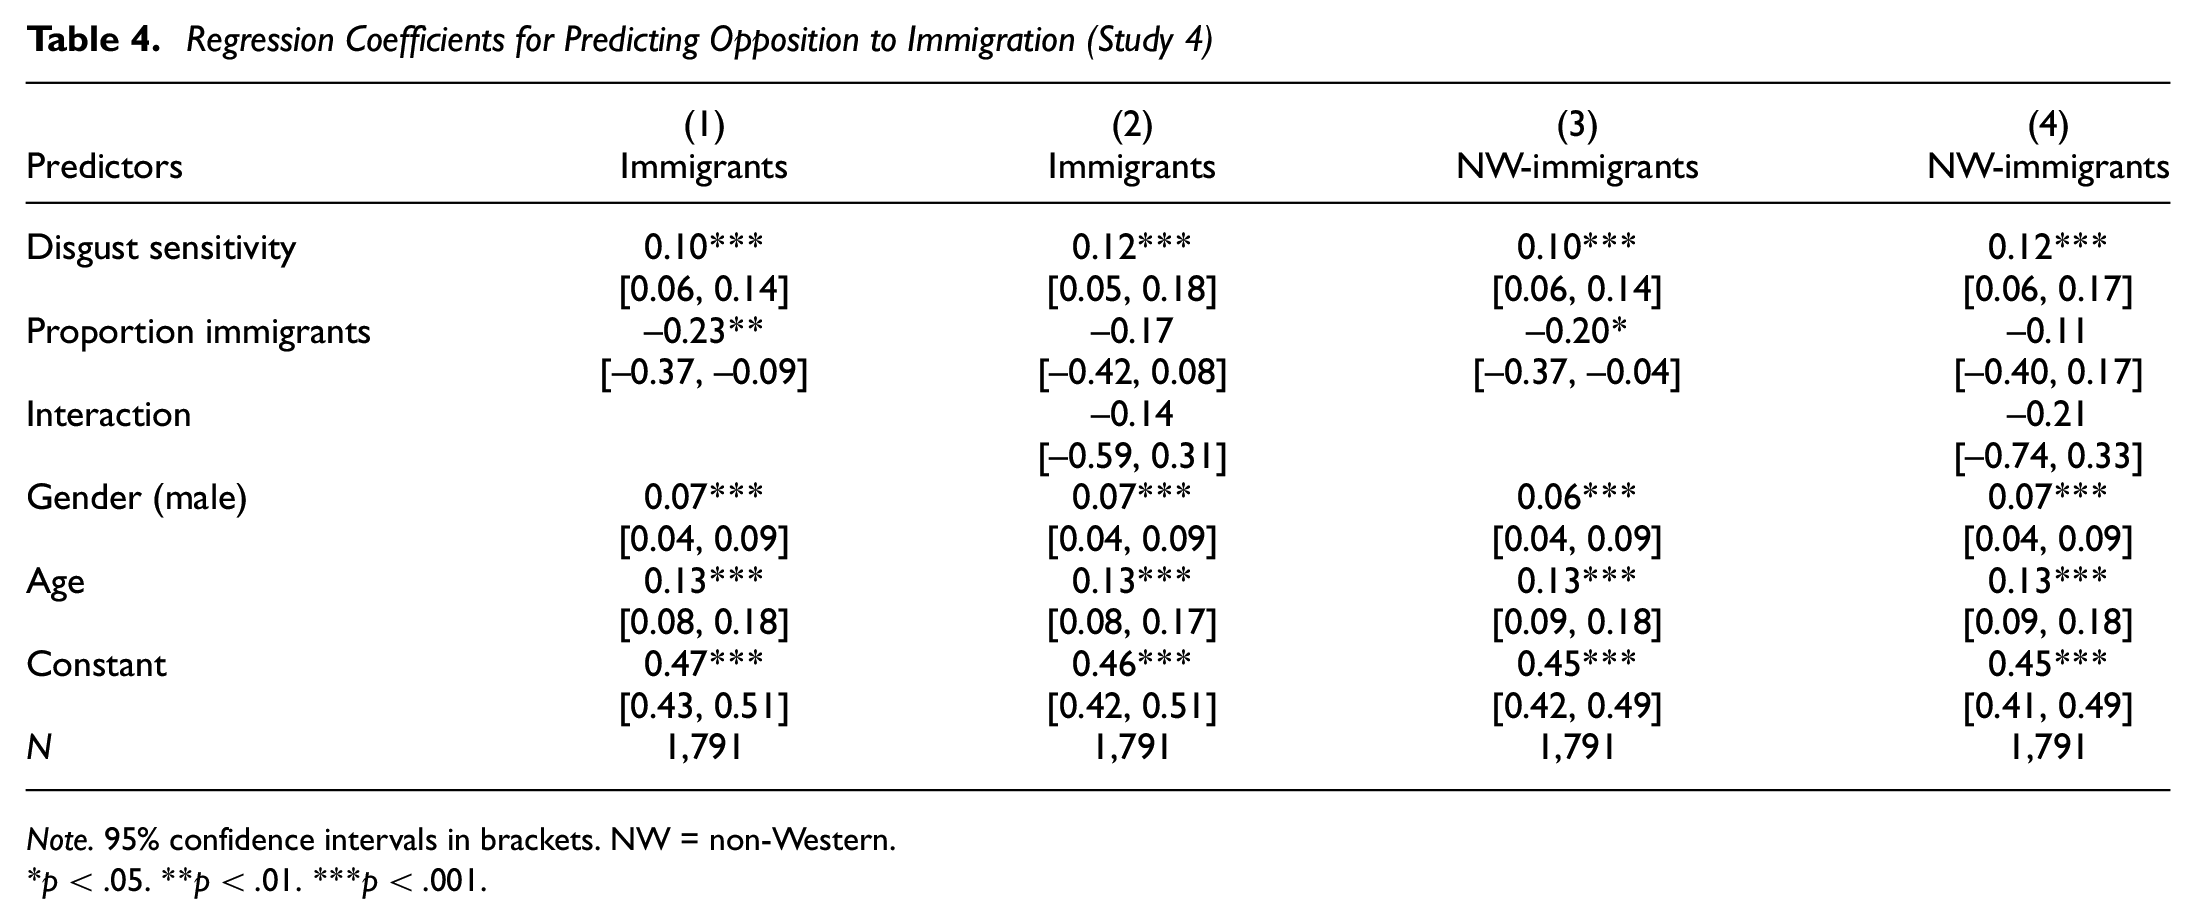
Note. 95% confidence intervals in brackets. NW = non-Western.
p < .05. **p < .01. ***p < .001.
To evaluate the potential moderating effect of exposure to immigrants, we followed the same approach as in Study 2, except that we fitted regular OLS models instead of multilevel models given the absence of clustering because each respondent had a personalized context. The correlations between all variables are shown in Table S10 in the Supplementary Materials.
Results
In Model 1, we regressed opposition to immigration on disgust sensitivity, age, respondent gender, and proportion of immigrants. In Model 2, we added the interaction between disgust sensitivity and proportion of immigrants. Table 4 shows the results. Disgust sensitivity had a significant and positive relation with opposition to immigration, but its interactions with the proportion of immigrants were not significant. Figure 4 illustrates the interaction. The figure and the interaction coefficient indicate a substantial (albeit insignificant) negative interaction effect in that the positive relationship between disgust sensitivity and opposition to immigration was substantially reduced for respondents living in areas with a higher proportion of immigrants. However, when using the trichotomized measure of exposure (illustrated in red in Figure 4), it is evident that the negative interaction effect was an artifact of the skewed exposure measure, and that the interaction effect is trivial in the area with common support. This is corroborated using the transformed measure of the proportion of immigrants in the immediate neighborhood. As shown in Model 2 of Table S11 (see Supplementary Materials), the interaction term using the square-root was close to zero (and still insignificant). The results using exposure to non-Western immigrants yielded very similar results (see Models 3 and 4 in Table 4 and Figure 4).
General Discussion
In four studies, we tested a prediction derived from lack-of-familiarity accounts of the relation between disgust sensitivity and opposition to immigration. Specifically, we examined whether the association between pathogen avoidance motivation and opposition to immigration is attenuated (i.e., moderated with a negative sign) among individuals who are more exposed to immigrants. We operationalized familiarity with immigrants as living in a country with high ethnic fractionalization (Study 1) and living in a local area with a relatively high proportion of immigrants (Studies 2–4). In line with previous work (e.g., Aarøe et al., 2017), we consistently found that higher disgust sensitivity was associated with more opposition to immigration. But, despite increasingly more accurate measurement of exposure to immigrants, we found no evidence that more exposure to immigrants attenuates the relation between pathogen avoidance motivation and opposition to immigration.
These results suggest that repeated simple exposure to ethnic diversity, as indexed by the objective number of immigrants in people’s countries, local zip code areas, and neighborhoods, is not enough to render immigrants and their customs nonthreatening for those higher in fear of pathogenic threats. Given the presumed importance of familiarity in driving the link between disgust and opposition toward immigration, this may be because simple exposure that does not involve direct positive interaction is not in itself enough to generate sufficient cultural familiarity to deactivate disgust responses to immigrants. But it may also reflect that lack of familiarity is not the exact causal factor linking disgust sensitivity and anti-immigrant views. For example, even if familiar, customs may still be perceived with negativity.
Our findings point to three suggestions relevant to immigration policy. First, the findings suggest that increased ethnic diversity generated by globalization does not by itself mitigate pathogen avoidance–driven anti-immigration attitudes. At the same time, the finding of a null effect also implies that this cleavage may not gain in importance as diversity increases. Second, in line with previous research, opposition to immigration was associated with emotion-based worries about infectious disease. Hence, interventions that alleviate such worries might have some effect on attitudes toward immigration. Third, our findings suggest that more immigrants do not necessarily lead to more opposition to immigration. On average, individuals in zip codes or neighborhoods with more immigrants were less opposed to immigrants.
When interpreting the current findings, some limitations should be taken into account. First, the current results indicate the absence of an attenuating interaction. Such nonsignificant interactions could be false negatives—the interaction exists but was not detected, for example, due to inaccurate measurement or small sample size. Our power analyses suggest that Studies 1, 2, and 4 had power > .80 to detect a small interaction effect and that study 3 had power > .70 to detect a small-to-medium interaction effect of r = −.15. Taken together, this suggests that it is unlikely that the true effect size for the interaction is small-to-medium and that not observing it was a false negative. It is possible, however, that the nonsignificant interactions were due to the true effect size being non-zero but very small and inconsequential. The current results in part speak against the interpretation that the nonsignificant interactions are false negatives. Study 4 had a substantial sample size (nearly 1,800) and arguably had better measurement of both intergroup exposure and opposition to immigration than the other studies. However, rather than approaching the hypothesized effect, the estimate of the interaction effect in Study 4 is close to zero. Furthermore, across the many results, only few indicated a negative interaction, so it is unlikely that more power would have provided substantial support for attenuation. That said, it is also worth noticing that most of the results are based on Danish data. Future studies should therefore test the hypothesis in other populations.
Finally, the current results do not provide a direct explanation for why exposure to immigrants does not attenuate the relationship between disgust sensitivity and anti-immigrant views. First, our studies did not directly measure (subjective) familiarity with ethnic outgroups, and it is possible that exposure to immigrants, as indexed by nation-level ethnic fractionalization and segregation or the proportion of immigrants living in people’s local area, does not increase familiarity. Hence, it is possible that these objective indicators are not sufficiently strong proxies for subjective experience of familiarity. Second, although we used objective measures of exposure to immigrants in Studies 2 to 4, these could have been influenced by attitudes toward immigrants. It is possible that the negative association between proportion of immigrants and opposition to immigration is in part due to individuals who are strongly opposed to immigration choosing to live in areas with fewer immigrants. Third, already in his early work on contact theory, Allport (1954, p. 262) noted that “[o]bviously, the effect of contact will depend upon the kind of association that occur,” where structured, extensive, and cooperative interactions provide the most optimal conditions for reducing prejudice (Pettigrew & Tropp, 2006; see also Malpass, 1990), while superficial contact such as direct exposure to refugee arrivals can create adverse effects (Andersson & Dehdari, 2021; Hangartner et al., 2019). These results thus suggest that a key focus for further research should be to understand the precise role of extensive and cooperative interactions with immigrants in mitigating the undesirable consequences of disgust responses.
Supplemental Material
sj-pdf-1-spp-10.1177_19485506231164206 – Supplemental material for Exposure to Immigrants Does Not Moderate the Relationship Between Disgust Sensitivity and Opposition to Immigration
Supplemental material, sj-pdf-1-spp-10.1177_19485506231164206 for Exposure to Immigrants Does Not Moderate the Relationship Between Disgust Sensitivity and Opposition to Immigration by Florian van Leeuwen, Lene Aarøe, Michael Bang Petersen and Kim Mannemar Sønderskov in Social Psychological and Personality Science
Footnotes
Acknowledgements
The authors thank Kevin Arceneaux for sharing the data for Study 2 and thank Peter Thisted Dinesen for contribution to data acquisition for Study 4.
Handling Editor: Malgorzata Kossowska
Declaration of Conflicting Interests
The author(s) declared no potential conflicts of interest with respect to the research, authorship, and/or publication of this article.
Funding
The author(s) disclosed receipt of the following financial support for the research, authorship, and/or publication of this article: K.M.S. and M.B.P. are supported by a grant from the Danish National Research Foundation (Grant No. DNRF144). The collection of the sample for Study 2 was funded by a grant from the Danish Council for Independent Research (Grant No. 10-081886) awarded to L.A. The collection of the sample for Study 3 was facilitated by a Small Research Grant (2016) from the Department of Political Science, Aarhus University, awarded to F.V.L.
Ethics Statement
Study 1 concerns analysis of openly available data, which was exempt from approval. The research in Study 2, 3, and 4 complied with Aarhus University Code of Conduct as well as the Committee Act of the Danish National Committee of Health Research Ethics, which stated that “Surveys using questionnaires and interviews that do not involve human biological material (section 14(2) of the Committee Act) are exempted from approval” (![]() ).
).
Data Availability Statement
The analysis of Study 1 is based on publicly available data; the code for reproducing the results is available via the Open Science Framework at ![]()
The analyses of Studies 2 and 3 are based on a combination of survey and administrative registry data. Due to the small number of respondents per post code, these combined data are nonanonymous and we cannot make them available. We have anonymized the combined data (by anonymizing post codes and grouping on the proportion of immigrants variables) which allows for a close reproduction of the results. These data and the code are available via the Open Science Framework at ![]()
The analyses of Study 4 are based on administrative registry data. These data contain confidential information and are therefore not publicly available. The combined survey and registry data are stored at Statistics Denmark and can only be accessed by researchers affiliated with a permanent Danish research institution/environment using Statistics Denmark remote server system (for further information about the Danish administrative registries, including access, see ![]() ). Accordingly, we cannot make replication data for our analyses available.
). Accordingly, we cannot make replication data for our analyses available.
Supplemental Material
Supplemental material is available in the online version of the article.
Notes
Author Biographies
References
Supplementary Material
Please find the following supplemental material available below.
For Open Access articles published under a Creative Commons License, all supplemental material carries the same license as the article it is associated with.
For non-Open Access articles published, all supplemental material carries a non-exclusive license, and permission requests for re-use of supplemental material or any part of supplemental material shall be sent directly to the copyright owner as specified in the copyright notice associated with the article.