
Abstract
Mountains—mythic and majestic—have fueled widespread speculation about their effects on character. Emerging empirical evidence has begun to show that physical topography is indeed associated with personality traits, especially heightened openness. Here, we extend this work to the domain of personal values, linking novel large-scale individual values data (n = 32,666) to objective indicators of altitude and mountainousness derived from satellite radar data. Partial correlations and conditional random forest machine-learning algorithms demonstrate that altitude and mountainousness are related to increased conservation values and decreased hedonism. Effect sizes are generally small (|r| < .031) but comparable to other socio-ecological predictors, such as population density and latitude. The findings align with the dual-pressure model of ecological stress, suggesting that it might be most adaptive in the mountains to have an open personality to effectively deal with threats and endorse conservative values that promote a social order that minimizes threats.
Mountains are among the most majestic and defining landmarks of our environment. For thousands of years, they have been subject of legends and religious reverence: Mount Olympus was regarded as home of the 12 gods in Ancient Greece, Mount Sinai is the site at which God gives Moses the Ten Commandments according to the Torah and the Old Testament of the Bible, Tibet’s Mount Kailash is a sacred place to both, Buddhists and Hinduists, and Māori people worship Mount Taranaki as a life force.
Given their outstanding ecological and cultural significance, many people have assumed that mountains can shape human character and have consequently ascribed specific traits to the people living in these environments. The resulting stereotypes about mountain people have varied over time and across places (Harkins, 2003; Hathaway, 2014; Williamson, 1995) but also show remarkable consistency in certain elements. Indeed, from the Appalachians (Lewis & Billings, 1997; Williamson, 1995) to the Swiss Alps and the Balkan mountains (Debarbieux & Rudaz, 2008) to the Sierra Madre mountain range in the Philippines (Howell, 1989)—and from the noble frontiersman (Howell, 1989) to the southern hillbilly (Otto, 2002) and the wildlings, or free folk, in HBO’s series Game of Thrones, mountain people are typically depicted as independent, resilient, and—most famously—free. The latter is even reflected in West Virginia’s official state motto: “montani semper liberi” (mountaineers are always free).
However, despite the widespread proliferation of these perceptions and their continuous popularity in folk psychology, direct empirical evidence on how mountainous areas might affect the identity of their inhabitants is scarce. In a series of small-scale field experiments, Oishi and colleagues showed that introverted (Oishi et al., 2015) and emotionally stable individuals (Oishi & Choi, 2020) prefer hilly and mountain-like environments over open and ocean-like environments. Extending the results of Oishi and colleagues, a recent study of 3 million U.S. residents used topographical data to construct an objective measure of the mountainousness of people’s living environments. The results indicated that mountainousness was associated with heightened openness and decreased agreeableness, conscientiousness, extroversion, and neuroticism (Götz, Stieger, et al., 2020). In the current research, we expand this work by introducing a new large sample to study the associations between mountainousness and personal values.
Personal Values
Values are broad, trans-situational goals, and guiding principles that reflect what is important to people (Sagiv et al., 2017; Schwartz, 1992). Personal values get expressed in individuals’ thoughts and actions. They are directly related to attitudes, such as readiness for out-group contact (Sagiv & Schwartz, 1995), pro-environmentalism (Boer & Fischer, 2013), prejudice toward immigrants (Wolf et al., 2019), and approval of homosexuality (Kuntz et al., 2015), behaviors such as voting (Caprara et al., 2006), prosociality (Caprara et al., 2012), fair trade consumption (Doran, 2009), military participation and charitable donations (Bardi et al., 2008), and mental health outcomes, such as life satisfaction and depressive affect (Sortheix & Schwartz, 2017).
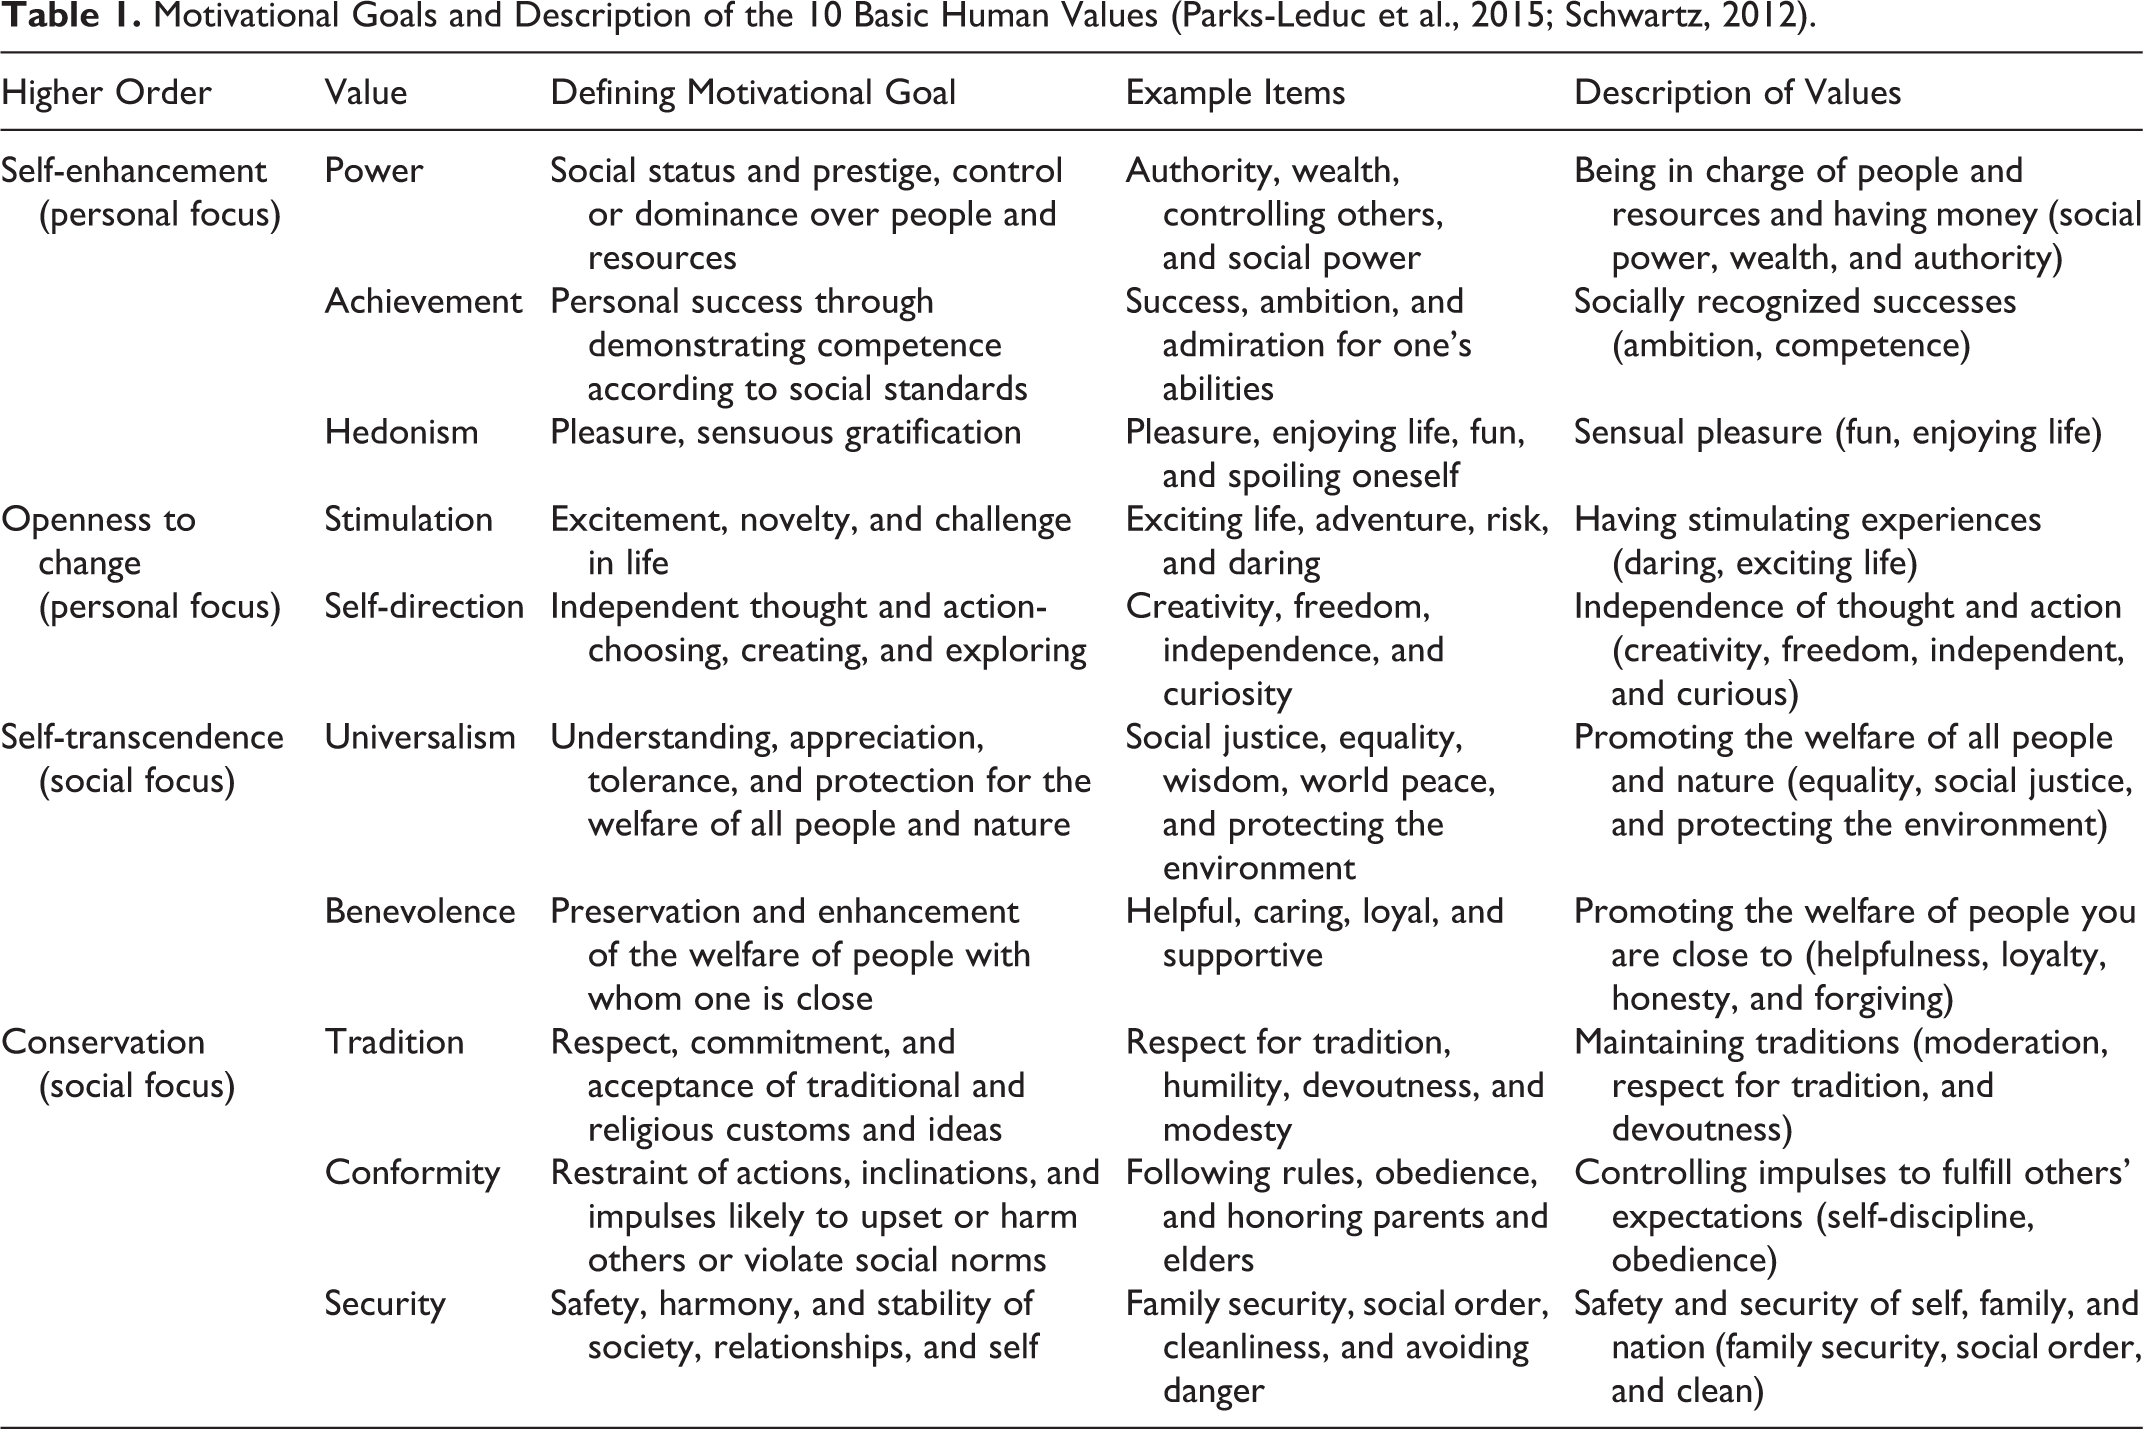
The most widely used value taxonomy is Schwartz’s circumplex model (Schwartz, 1992; Schwartz et al., 2012), which has received support in more than 80 countries (Sagiv et al., 2017). Schwartz’s circumplex model arranges 10 basic values (i.e., power, achievement, hedonism, stimulation, self-direction, universalism, benevolence, tradition, conformity, and security) in a circular, two-dimensional space that captures their conflicts and compatibilities. Values that are compatible with each other are sorted into the same higher order value category and positioned closely together. In contrast, conflicting values are positioned further apart, in opposing positions in the circumplex. The four higher order dimensions span two basic conflict dimensions: Self-transcendence (benevolence, universalism) versus self-enhancement (achievement, power) contrasts values that emphasize concern for others with values that emphasize the promotion of personal interests even at the expense of others. Openness to change (self-direction, stimulation) versus conservation (conformity, security, and tradition) contrasts values that emphasize novelty and autonomy with values that emphasize stability and self-restriction. Self-enhancement and openness to change values have a personal focus, whereas self-transcendence and conservation values have a social focus (Schwartz et al., 2012). Likewise, self-enhancement and conservation values are considered to drive self-protection, whereas self-transcendence and openness to change values are considered to drive growth. Except for hedonism, all values are exclusively aligned with one higher order dimension. Hedonism shares elements of both self-enhancement and openness to change (Sagiv et al., 2017; Schwartz, 1992, 2012). The circumplex model is exhibited in Figure 1, and all personal values are summarized in Table 1.
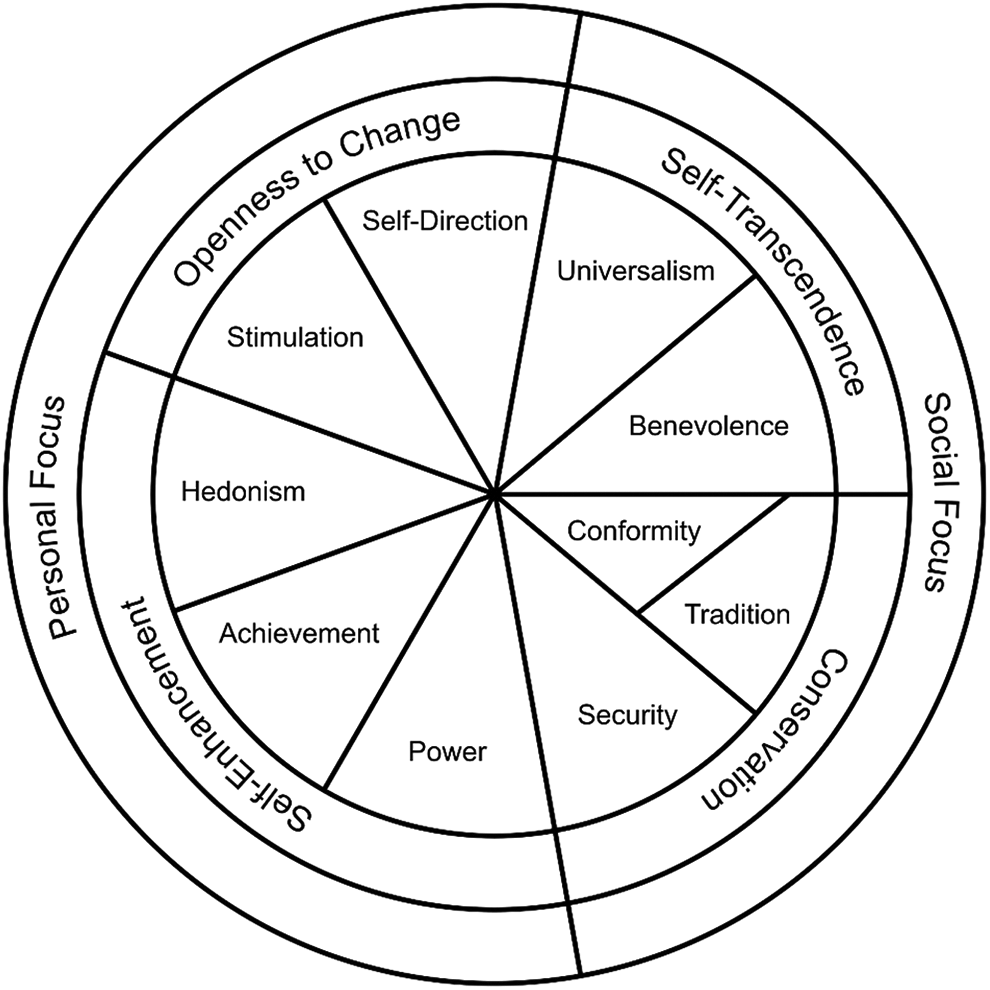
Circumplex structure of the 10 basic human values from Schwartz (1992).
Motivational Goals and Description of the 10 Basic Human Values (Parks-Leduc et al., 2015; Schwartz, 2012).
While the cross-cultural validity and expression of personal values are increasingly well-understood, comparatively little is known about their origins (Sagiv et al., 2017). Genetic factors and social and cultural influences have been acknowledged, although it is unclear how they interact (Sagiv et al., 2017). Moreover, while it has been suggested that values adapt to environmental demands and affordances (Fischer & Boer, 2016), no research has examined the role that the physical environment may play in the formation or change of values.
Thus, in examining the association between mountainousness and personal values, the present study extends previous research on the links between mountainous terrains and human identity and adds to our understanding of the ways in which macro-environmental factors relate to personal values.
The Current Research
To examine the relationship between mountainousness and personal values, we combine a large data set containing personal values of 32,666 U.S. residents with topographical information derived from satellite radar data, which provides a granular, objective assessment of mountainousness. The observed mountainousness effects are compared against an array of individual demographic (i.e., age, gender, income) and socio-ecological (population density, latitude) predictors to provide a benchmark for evaluating the results. In the absence of prior theorizing or empirical findings on the association between mountainousness and personal values, we refrain from making a priori predictions and instead adopt an exploratory, data-driven approach.
However, drawing on previous research (Parks-Leduc et al., 2015; Schwartz, 1992), we predict systematic relationship patterns between mountainousness and personal values that reflect the compatibilities and conflicts between individual values. Specifically, because the value circumplex represents a motivational continuum, as one moves around the circle and away from the value that is most strongly positively related to the variable of interest—in our case mountainousness—the correlations should shift from positive to negative. The negative correlations should peak with the value on the circle that is directly opposite the value with the strongest positive correlation. When graphing the coefficients, with the values arranged on the horizontal axis from left to right in order around the circle, and the correlations between values and mountainousness shown on the vertical axis, the emerging line is expected to form a sinusoid curve (i.e., a sine wave, with one major peak and one major valley).
Method
Participants and Procedure
The current research utilizes the TIME Magazine Basic Human Values Dataset (Götz et al., in prep). The data collection was conducted in collaboration with TIME Magazine (see Online Supplement for procedural details) and received ethical clearance from the Psychology Research Ethics Committee of the University of Cambridge (application number: PRE.2017.094). In accordance therewith, the collected data may not be made publicly accessible but can be shared with fellow researchers upon request.
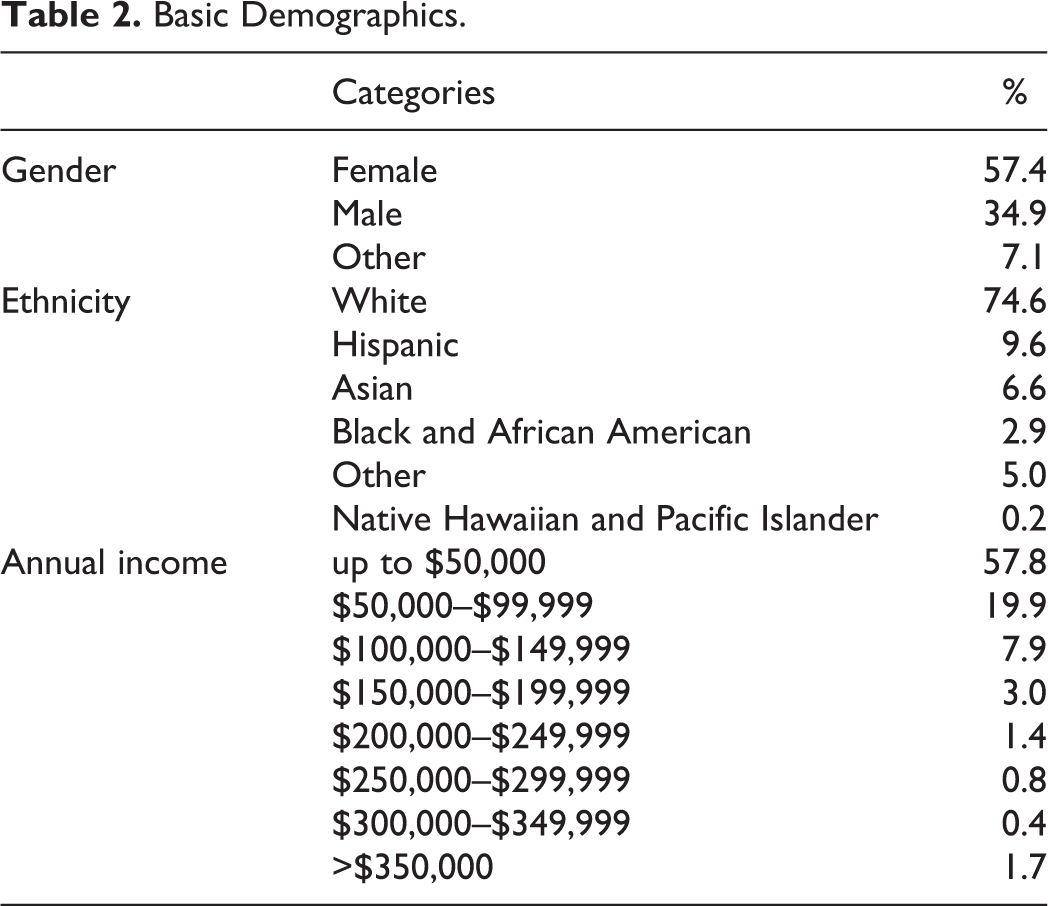
Between December 2017 and October 2018, 92,886 individuals took part in the survey and donated their data. In the current research, we included all participants who (1) reported living in the contiguous United States and provided their ZIP code of living 1 and (2) were between 18 and 99 years old. This resulted in a final sample of 32,666 individuals (agemean = 28.0, age SD = 11.3; see Table 2 for further demographic information).
Basic Demographics.
Measures
Twenty-item values inventory (TwIVI)
Values were measured via the TwIVI (Sandy et al., 2017), a short scale based on the 40-item Portrait Values Questionnaire (Schwartz, 2003). Each personal value is assessed through two portrait-type items which describe a fictional person (e.g., “Getting ahead in life is important to this person. This person strives to do better than others.” and “This person really wants to enjoy life. Having a good time is very important to them.”) and ask participants to rate the extent to which the described person is like themselves on a 6-point Likert-type scale (1 = not at all like me; 6 = very much like me). In the current study, nine of 10 Conbach’s α ranged from .51 to .78 (see Tables S1 and S2 in the Online Supplement), which is acceptable for two-item scales (Gosling et al., 2003) and in line with previous findings (Sandy et al., 2017; Schwartz et al., 2001). The only exception occurred for security (α = .28), which is also consistent with past research (original publication of the TwIVI: Sandy et al., 2017: α = .33). For each value, the two corresponding items were averaged to calculate a value score.
Mountainousness
Following the Nordic Centre for Spatial Development (Nordregio, 2004), we independently considered two aspects of physical topography: shape (i.e., hilliness/mountainousness) and altitude (i.e., elevation). To assess mountainousness, for each ZIP code in our sample, we calculated the standard deviation in elevation above sea level within a 20-mile (default measure) as well as 50-mile radius from that ZIP code’s centroid (see also Götz, Stieger, et al., 2020; for more details, see Online Supplement). A standard deviation of 0 reflects no mountains at all and thus flat land. In contrast, a large standard deviation indicates a hilly, mountainous area (see Figure 2, Figure S1 [Online Supplement], and Götz, Stieger, et al., 2020, for further validation of this measure).
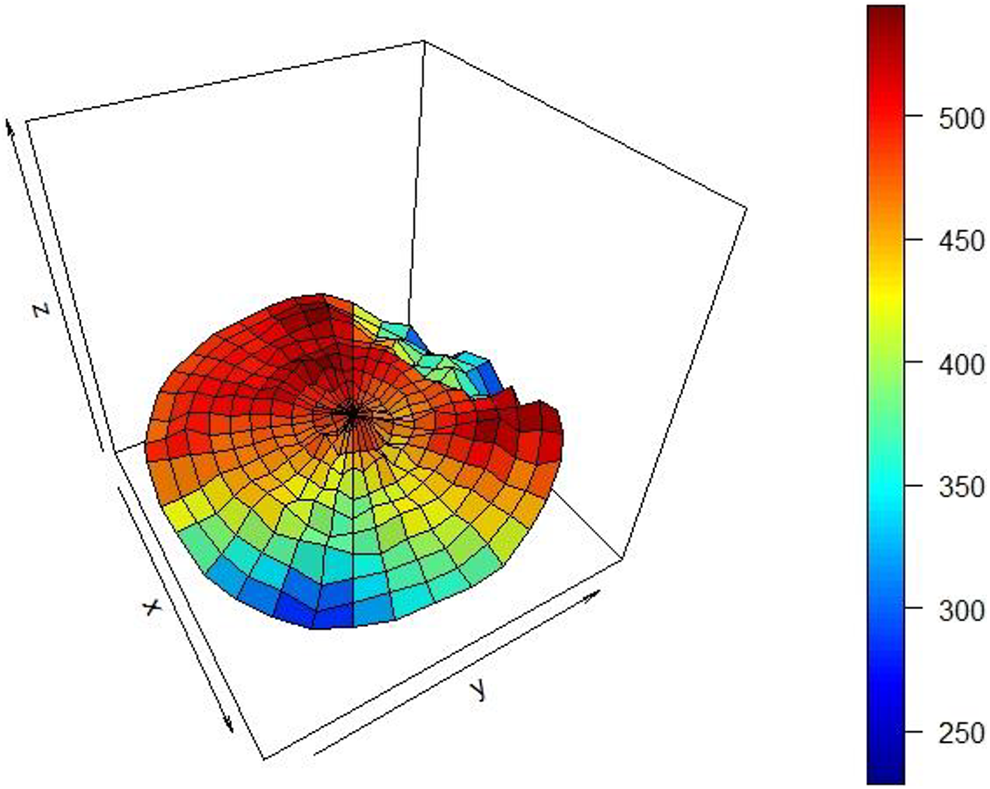
Example grid of elevations across 50-mile radius from ZIP code centroid.
However, while the mountainousness index is sensitive to changes in elevation and thus shape, it is a relative measure that does not account for absolute elevation (e.g., hilly area at low elevation versus hilly area at high elevation). Therefore, we also calculated mean elevation across people’s living environments (i.e., within a 20/50 mile radius from their ZIP code of living) to capture altitude as the second component of physical topography (Nordregio, 2004).
Climatic condition
We also considered latitude as an index of climatic stress, which has been linked to personality in prior research (e.g., Fincher et al., 2008; Götz, Stieger, et al., 2020; van de Vliert & van Lange, 2019). A lower latitude represents southern (warmer) areas, whereas higher latitude (up to 90 degrees, which is on the North Pole) represents northern (colder) areas.
Population density per square mile
Population density per square mile for each ZIP code was obtained from American Community Survey (U.S. Census Bureau, 2012).
Demographic variables
As part of the online survey, participants reported their age, annual income, ethnicity, and gender.
Analysis Strategy
Based on past research, we expected an effect size of r ∼ .016 (mean of zero-order correlations between personality and mountainousness in Götz, Stieger, et al., 2020). A power analysis suggested that at least 30,658 participants are necessary to reach a power of 80% (two sided; α = 5%; ρ under H0 = 0). We adopted a two-pronged analysis strategy. In the first step, we conducted correlation analysis to investigate systematic patterns between mountainousness and personal values (Table S3 in the Online Supplement). Following previous work (Parks-Leduc et al., 2015; Schwartz, 1992, 1996), we depicted the zero-order relationships visually as a sinusoidal curve; values are listed on the horizontal axis in their original order (i.e., moving around the circle), while their correlations with mountainousness are plotted on the vertical axis (Figure S2, Online Supplement). In the second step, we sought to contextualize the mountainousness findings by controlling for and comparing them to other relevant demographic and socio-ecological predictors of personal values. As 40.9% of our participants were the only participants in their respective ZIP codes, our sample did not afford the recommended threshold of five Level 1 units per Level 2 unit (in our case, individuals per ZIP code; Aarts et al., 2014; Arend & Schäfer, 2019; Maas & Hox, 2004, 2005). So we decided not to employ multilevel modeling. While a classical multivariate linear regression approach offered one feasible alternative, it was likely to produce biased results due to multicollinearity (i.e., high intercorrelations among predictors, e.g., mountainousness, mean elevation; see Table S4 in the Online Supplement), which would deprive each variable of its predictive power when entering all predictors at once. To circumvent this issue, we first replicated the correlation analyses individually for all predictors to allow for benchmarking and direct comparison of the resulting relationship patterns by calculating partial correlations (controlling for gender, age, and income). Second, mirroring recent geo-psychological studies (Ebert et al., 2020; Wei et al., 2017), we conducted conditional random forest machine-learning analyses (Strobl et al., 2009; for more details, see Online Supplement). All analyses were conducted in R, and the accompanying code is available from our Open Science Framework (OSF) project page (https://osf.io/287ad).
Results
Correlations between all predictors and the 10 personal values are displayed in Table 3 (global and local area–specific variables were controlled for age, gender, and income by calculating partial correlations). 2 Mountainousness indices were most consistently related to conservation values (see Table 3). Specifically, mountainousness showed significant positive associations with all conservation values (security: r = .022, p < .001; tradition: r = .019, p = .001; and conformity: r = .013, p = .030) and the self-enhancement value of achievement (r = .012, p = .039), while mean elevation was most strongly related to heightened tradition (r = .031, p < .001) and also exhibited a negative relationship with hedonism (r = −.013, p = .021).
Correlations Between Predictors and Personal Values.
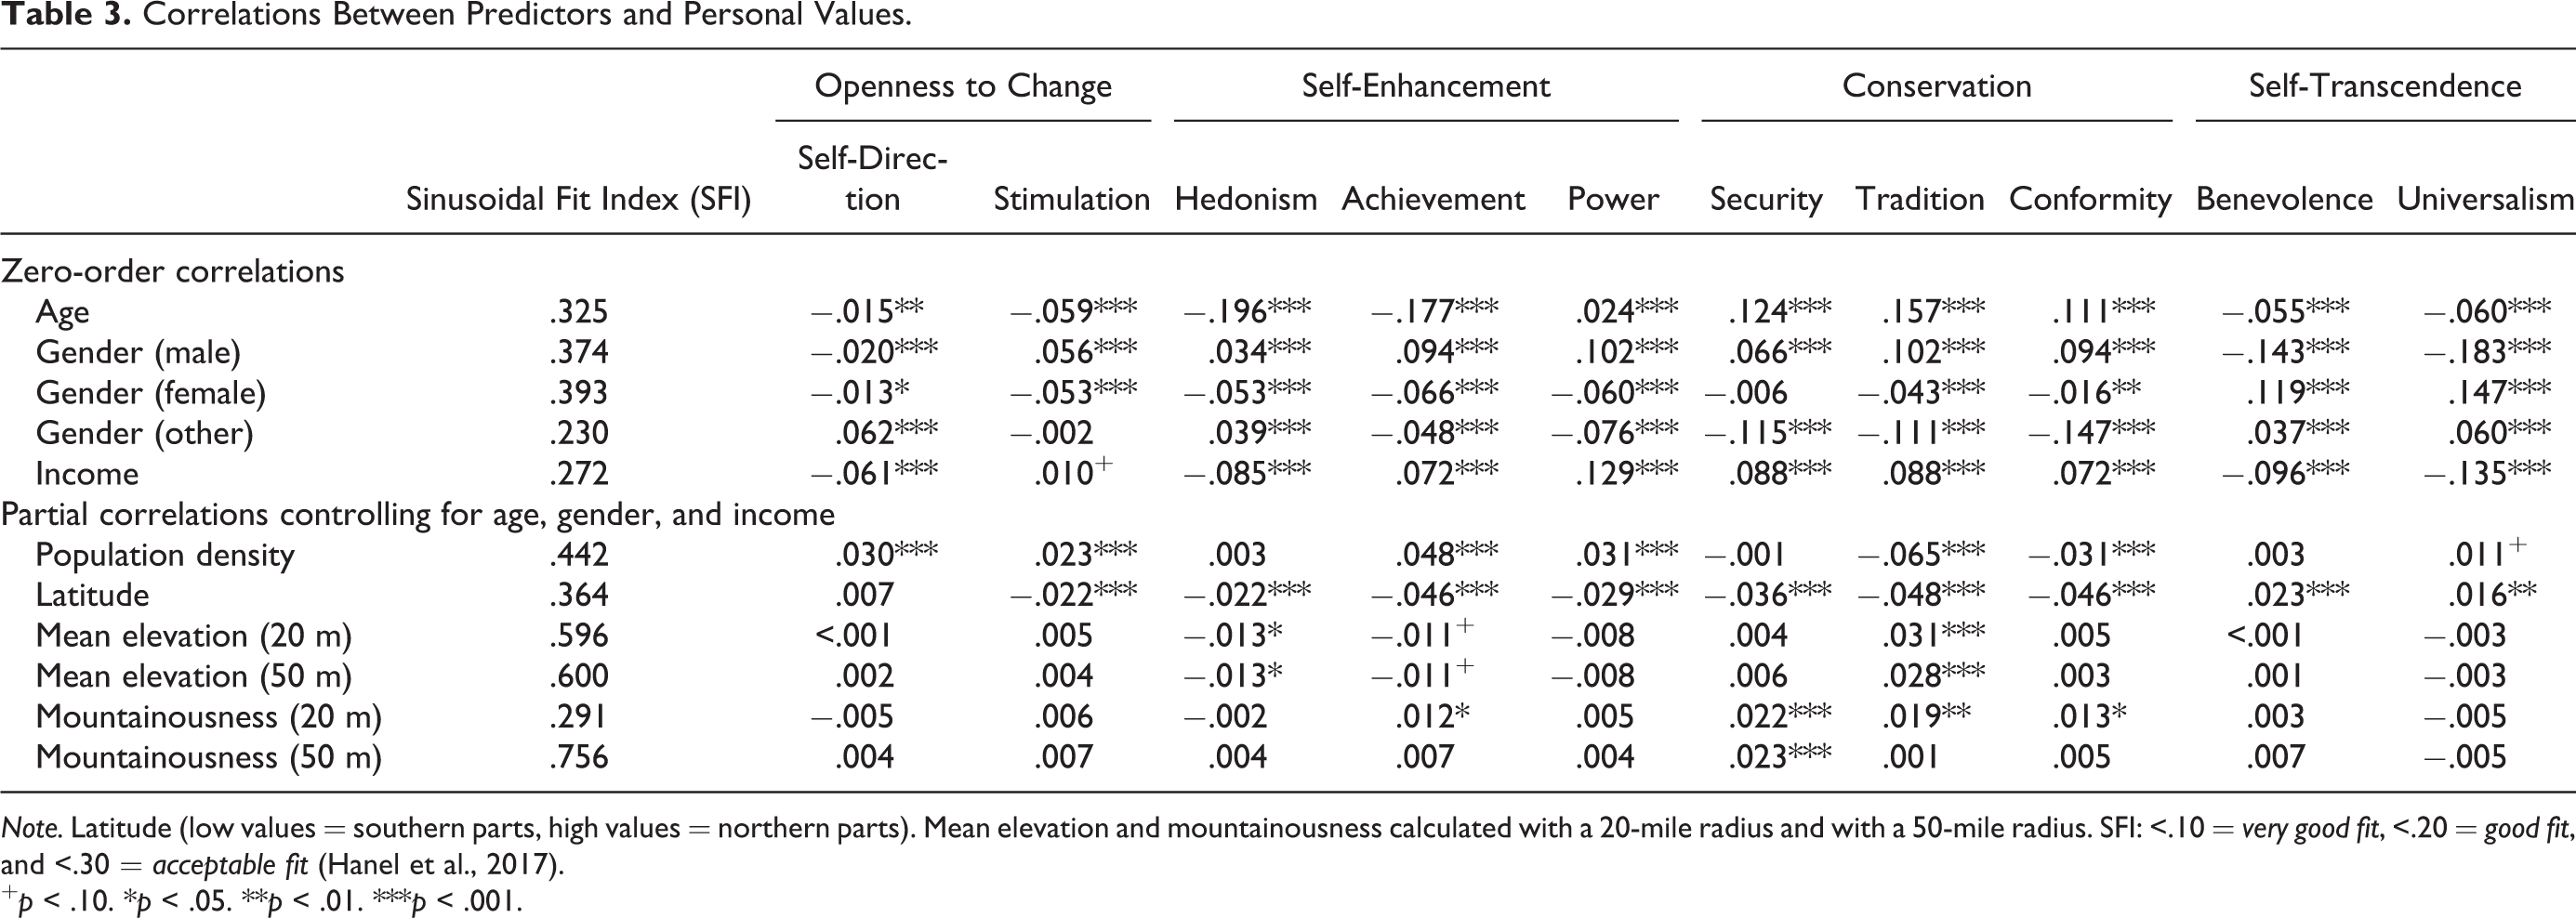
Note. Latitude (low values = southern parts, high values = northern parts). Mean elevation and mountainousness calculated with a 20-mile radius and with a 50-mile radius. SFI: <.10 = very good fit, <.20 = good fit, and <.30 = acceptable fit (Hanel et al., 2017).
+ p < .10. *p < .05. **p < .01. ***p < .001.
Figure 3 visualizes the correlation patterns to facilitate the detection of sinusoidal curves (Parks-Leduc et al., 2015; Schwartz, 1992, 1996). As shown in Panel C, the partial correlation curves of mean elevation and—to a lesser extent—mountainousness approximated sinusoidal shapes. Compared to the other two ecological variables under consideration, population density, and latitude, a similar picture emerged with the correlation curve of population density conforming more to a sinusoidal shape than the curve of latitude (see Figure 3, Panel B). Specifically, participants living in densely populated areas tended to score higher on self-enhancement values and lower on conservation values. In contrast, individuals living in colder climates (i.e., higher latitudes) tended to score lower on self-enhancement and conservation values and higher on self-transcendence. While the amplitude of the curves for mountainousness and mean elevation (|r| < .031) was smaller than those of population density and latitude (|r| < .065), overall, it supported consistent small effects for all ecological variables under study. Lastly, as shown in Panel A, the correlation curves of the demographic variables also all tended to form sinusoidal curves, albeit to varying degrees. For men, an upper peak was observed at self-enhancement and conservation values and a lower peak at self-transcendence values, whereas this pattern was reversed for women. Older participants put greater emphasis on conservation values and scored lower on self-enhancement values. Individuals who reported earning higher incomes scored higher on self-enhancement and conservation values and lower on self-transcendence values. Across all demographic variables, the amplitude of the correlation curve (|r| < .20) was decidedly larger than for the socio-ecological variables (i.e., mean elevation, mountainousness, latitude, population density). This finding indicates that the proximal personal demographic factors were more strongly associated with personal values than the distal socio-ecological factors. The sinusoidal pattern was also quantified with the sinusoidal fit index (Hanel et al., 2017), which indicates how well a correlational pattern reflects a sinusoidal curve. As can be seen in Table 3, gender (other), income, and mountainousness (20-mile radius) displayed acceptable fit to a sinusoidal form. All the other sinusoidal patterns were less pronounced.
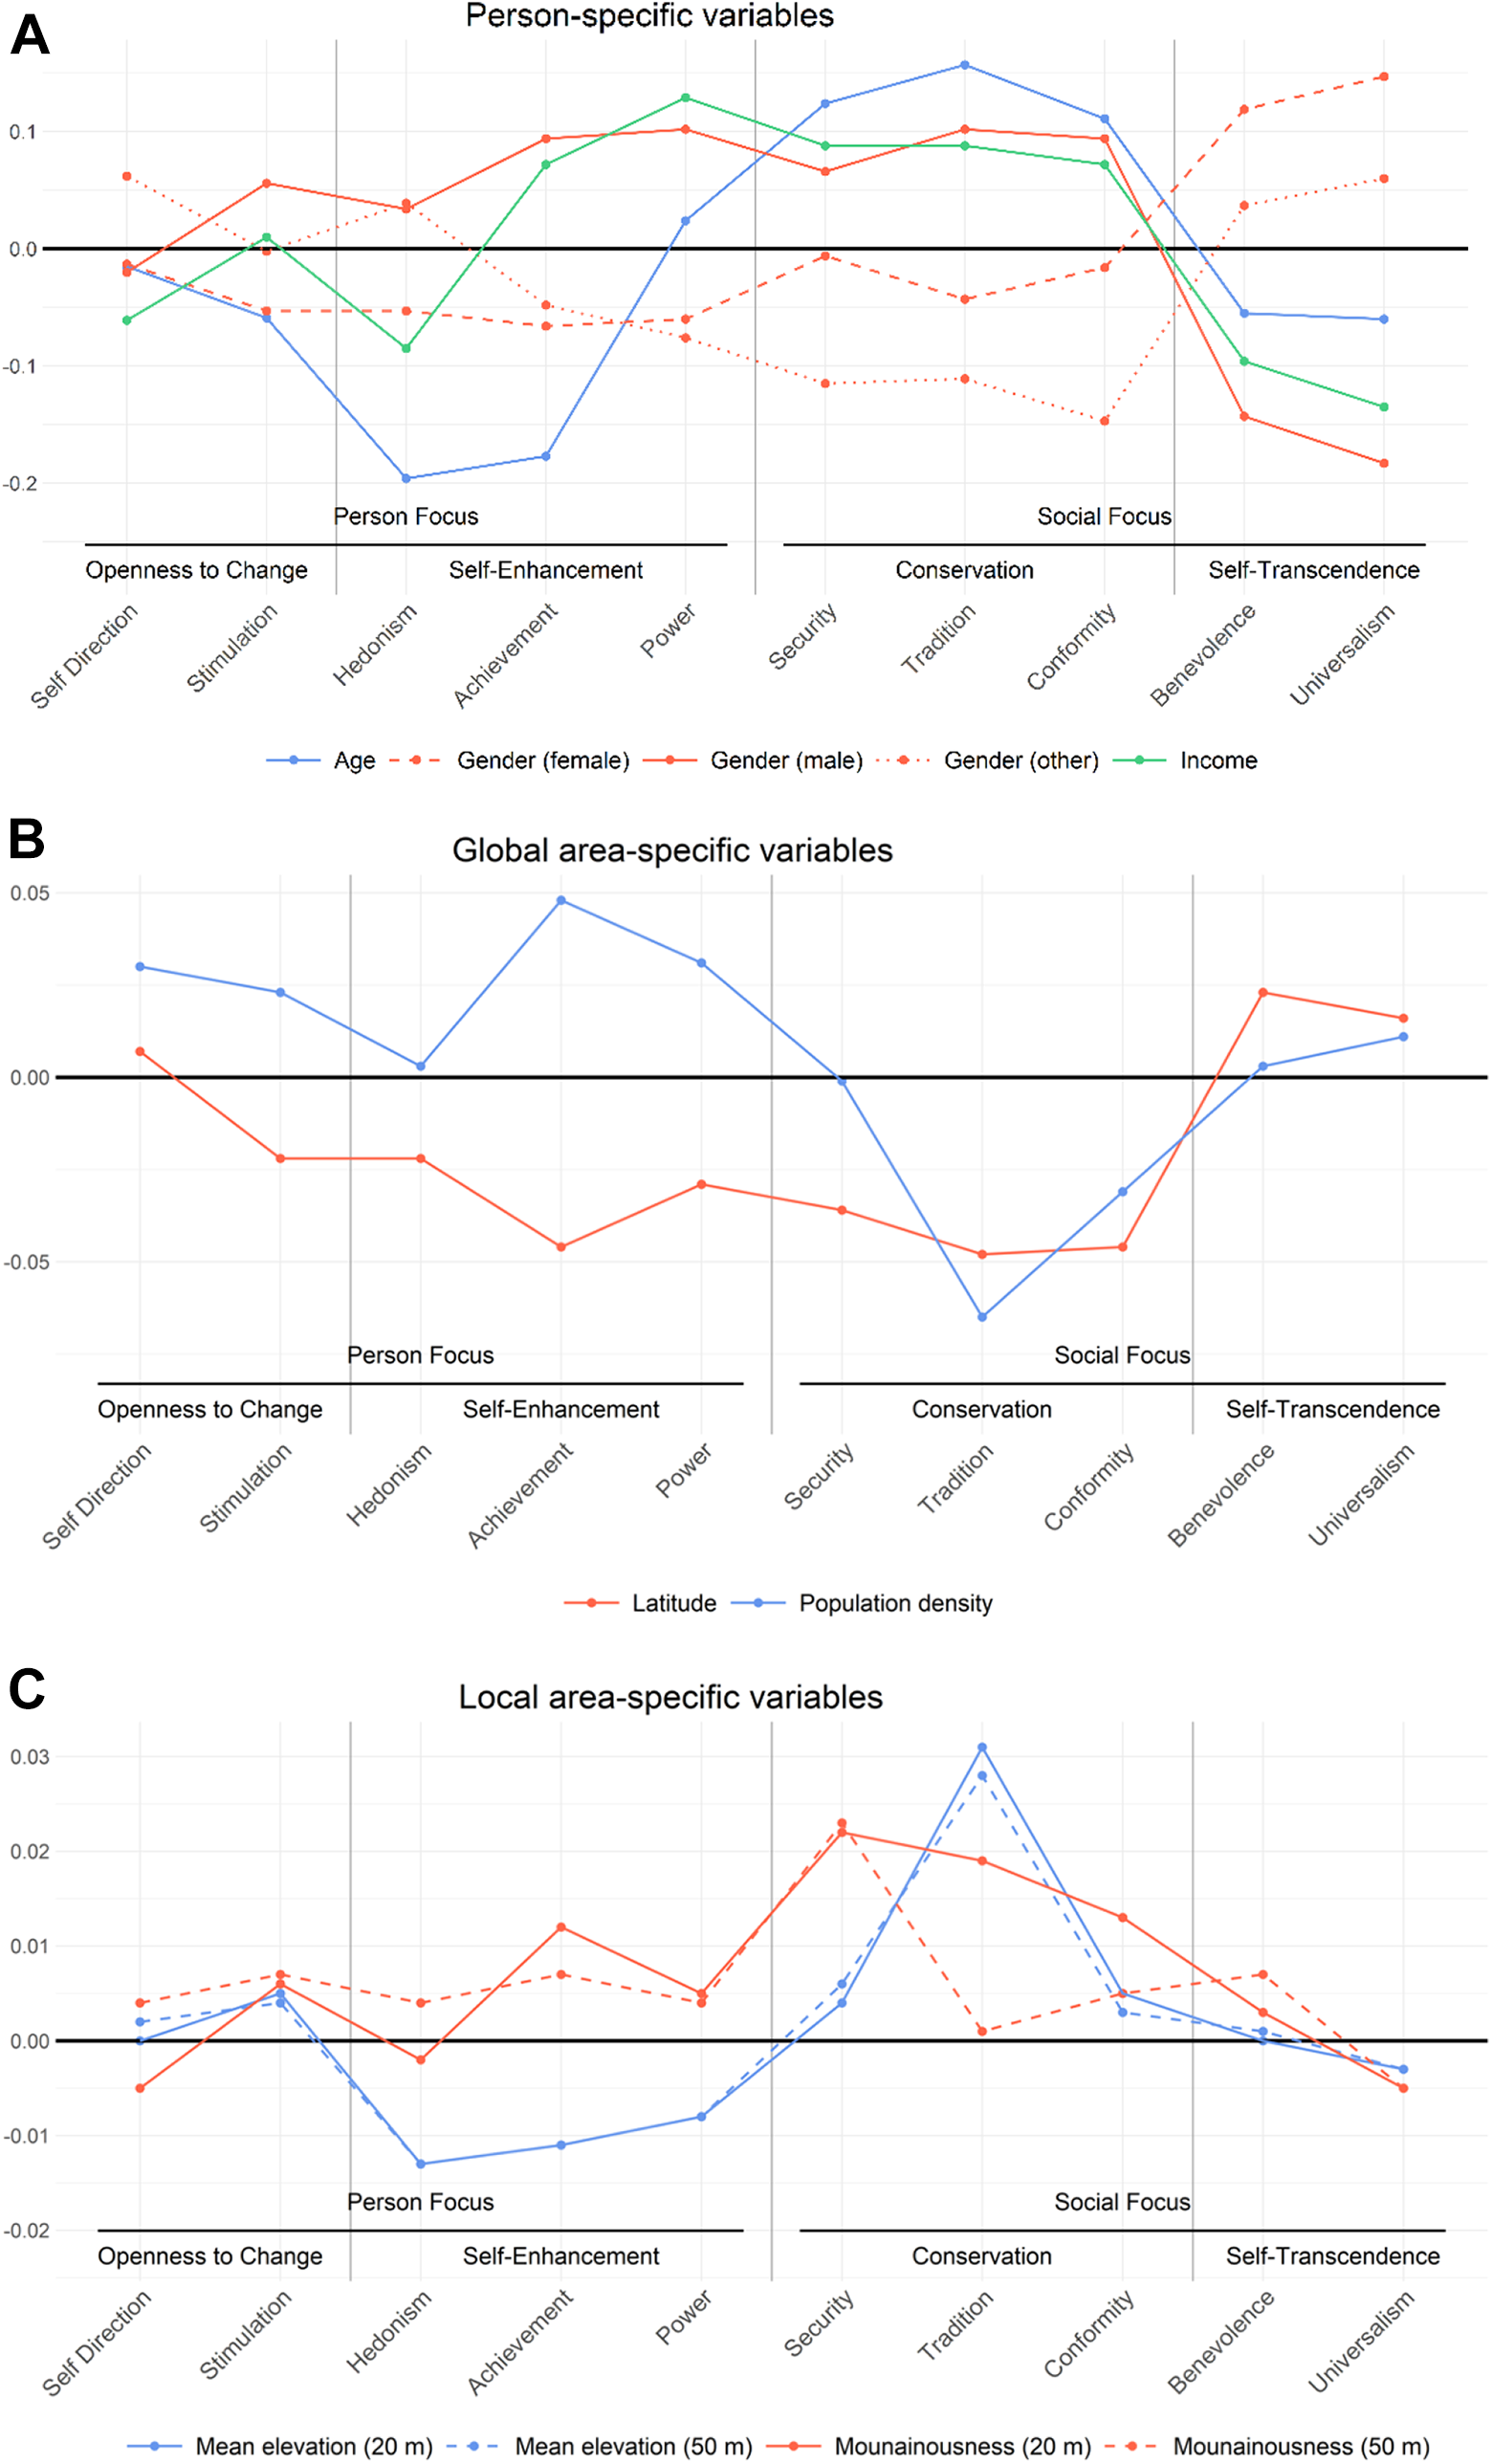
Value-specific correlations arranged as sinusoidal curves (Panel A: zero-order correlations; Panels B and C: partial correlations controlled for person-specific variables).
As is shown in Figure 4, both mountainousness indices exceeded the customary random noise threshold (Ebert et al., 2020; IJzerman et al., 2018; Strobl et al., 2009; Wei et al., 2017). This result identifies the mountainousness indices as meaningful contributors to the prediction of all personal values in the conditional random forest models (see Figure 4, importance ranks are reported in the right-most cell of each panel). When considering median importance ranks across all values, age emerged as the most important predictor, followed by gender (male–female), and income, while mountainousness, mean elevation, latitude, and population density were of equal importance ahead of gender (male-other), which, on average, was the least important predictor of personal values (see Table S6 in the Online Supplement).
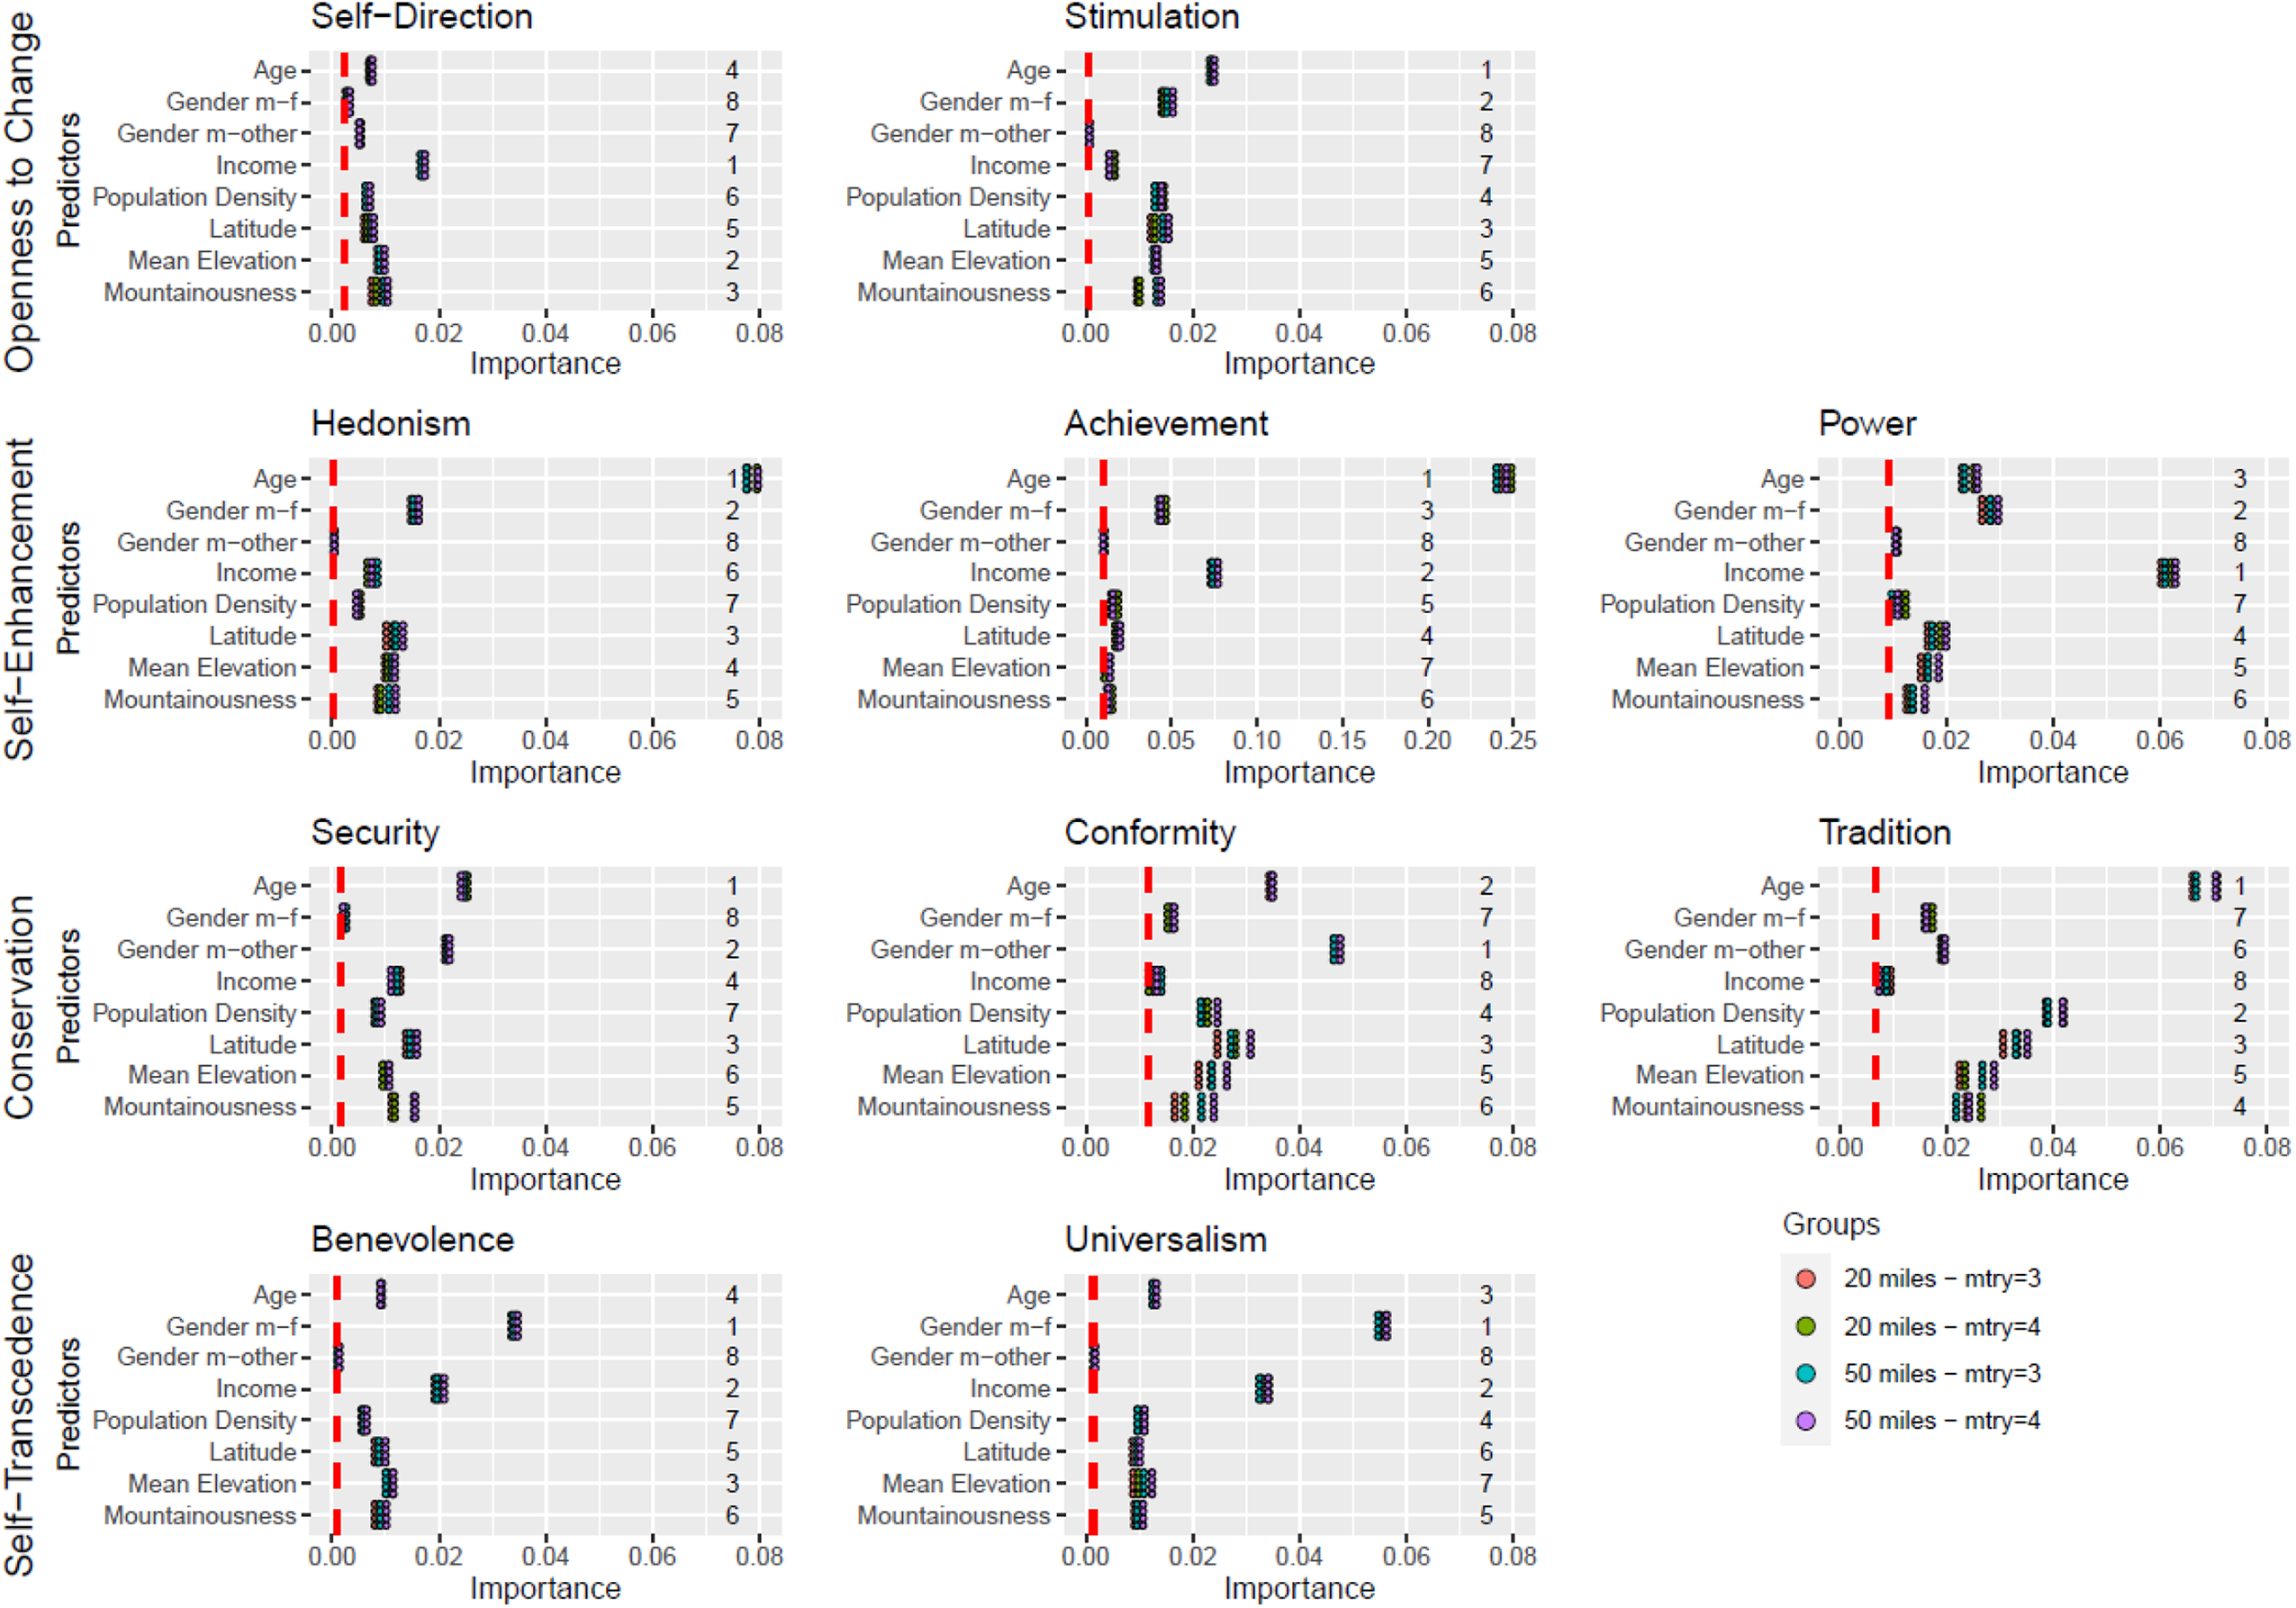
Variable importance plots. Note. Relative ranking of predictor importance. Predictors with higher variable importance are considered more important than those with lower importance values. Importance values should not be interpreted in absolute terms. Importance values exceeding the red-dashed vertical line (i.e., smallest positive importance score or absolute value of the largest negative importance score) are considered highly unlikely to be noise. Numbers in the right-most cell of each panel indicate predictors’ average importance ranks across all iterations. Pink bubbles represent model specification with mountainousness based on a 20-mile radius and an mtry (i.e., size of subset of predictors, randomly selected from the list of all predictors, used to construct each tree) of 3. Green bubbles represent model specification with mountainousness based on a 20-mile radius and an mtry of 4. Turquoise bubbles represent model specification with mountainousness based on a 50-mile radius and an mtry of 3. Purple bubbles represent model specification with mountainousness based on a 50-mile radius and an mtry of 4.
Robustness Checks
We conducted various robustness checks to scrutinize the validity of our results. First, we drew a bigger radius when considering the mountainousness of participants’ surroundings. Our main models were based on a radius of 20 miles from the centroid of participants’ ZIP code of residence, reflecting participants’ day-to-day environment in keeping with the U.S. national average commuting distance of 18.8 miles (U.S. Census Bureau, 2013). To account for additional effects of the mountainousness of the broader surroundings in which people spend their lives, we replicated all analyses using a 50-mile radius. As shown in Table 3, Figure 3 (Panel C, dotted blue and red lines), and Figure 4 (turquoise and purple bubbles), all findings remained virtually unchanged. If anything, the 50-mile radius mountainousness measures showed somewhat stronger associations with personal values, replicating prior research (Götz, Stieger, et al., 2020). Second, we varied the number of predictors randomly sampled as candidates at each split for the forest trees (i.e., mtry; marked by different colors in Figure 4) as well as the computational starting point for the randomization (i.e., seed; marked by points in Figure 4) of our conditional random forests. Attesting to the robustness of our findings, as shown in Figure 4, these alternative specifications did not change the interpretation of our findings. Third, we replicated our correlational analyses partialing out individuals’ mean ratings to account for individual differences in scale use (Borg & Bardi, 2016; Parks-Leduc et al., 2015). Relationship patterns with the mountainousness indices remained robust, with minor fluctuations in the 20m-mountainousness index and more pronounced latitude differences (see Table S7 in the Online Supplement). Lastly, we calculated a mean squared successive difference (MSSD) measure (Ebner-Priemer et al., 2009) variant of our mountainousness measure, which considers variability in elevation (i.e., hilliness) like our standard measure but also accounts for the sequence of elevation points. Mountainousness–MSSD captures both variability and instability, with rising mountainousness–MSSD values indicating an increasingly extreme and uneven terrain. Mirroring prior research (Götz, Stieger et al., 2020), rerunning the analyses with mountainousness–MSSD did not yield any noteworthy differences or incremental predictive power compared to our original analyses (see Figure S3, Online Supplement).
Discussion
The present research employed advanced analysis techniques to investigate whether mountainousness is meaningfully associated with personal values. Correlation curve analysis indicated that individuals living in hilly and mountainous areas were likely to emphasize conservation values, specifically security and tradition. Individuals living at high altitudes showed a similar pattern but also cared less about hedonism. These results were stable across various robustness checks. Conditional random forest machine-learning algorithms confirmed both mountainousness indices as relevant predictors of personal values when tested against a conservative set of demographic (age, gender, and income) and socio-ecological (population density, latitude) controls.
How should we interpret the associations between mountainousness and personal values? The negative relationship with hedonism appears straightforward. Mountainous areas tend to be secluded and inhospitable, making them ill-suited for the pursuit of worldly pleasures and sensuous gratification. Meanwhile, the robust association between mountainousness and conservation values may initially seem surprising and even counterintuitive. According to voluntary settlement theory (Kitayama et al., 2006, 2010), during the European settlement of the United States, frontier environments like the Rocky Mountains attracted primarily self-reliant, freedom-seeking nonconformists. The accumulation of individuals with such traits laid the foundation for an ethos of independence that continues to characterize the inhabitants of these areas today (Plaut et al., 2002; Varnum & Kitayama, 2011). Indeed, the mountain states still exhibit the strongest individualist tendencies in the United States (Vandello & Cohen, 1999). Moreover, recent research examining the personality structure of mountain dwellers in the United States found that mountainousness was most strongly related to heightened openness to experience (Götz, Stieger, et al., 2020). With openness being negatively related to conservation values (Fischer & Boer, 2014; Parks-Leduc et al., 2015; Roccas et al., 2002), these findings appear to be at odds with the current results.
However, from an analytical standpoint, even the strongest correlations between traits and values—which are typically found between agreeableness and benevolence (rsp = .61, Parks-Leduc et al., 2015; r = .45, Roccas et al., 2002; and r = .54, Vecchione et al., 2019) and openness and self-direction (rsp = .52, Parks-Leduc et al., 2015; r = .48, Roccas et al., 2002; and r = .39, Vecchione et al., 2019)—leave sufficient unexplained variance to manifest in differential relations with third variables, such as mountainousness. More importantly, from a conceptual standpoint, while personality traits and personal values are similar, they are not the same. Values are evaluative, mutually exclusive (i.e., following a diametrical organization, wherein endorsement of certain values implies rejection of others), enduring goals that reflect what a person finds important as a member of society. Meanwhile, traits are descriptive, nonmutually exclusive (i.e., following an orthogonal organization, wherein stronger expression of certain traits does not affect others), enduring dispositions that reflect what a person is like as an individual (Bilsky & Schwartz, 1994; Roccas et al., 2002; Vecchione et al., 2019).
The current findings dovetail well with the dual-pressure model of ecological stress (Conway et al., 2017). According to this model, the same ecological stressor, such as the harshness of mountain terrains, might simultaneously produce opposing pressures that push people in two different directions. In the current context, mastering the tough ecological conditions of mountainous areas might require individuals with independent agency and preparedness to confront unknown challenges and thus favor an open personality (Götz, Stieger et al., 2020). Meanwhile, thriving in ecologically challenging environments, such as mountainous terrains, might require social groups that are committed to safety, self-discipline, stability, and protection of the status quo—hallmarks of conservation philosophy. This conclusion aligns with research showing that experiences of environmental threats and uncertainty (1) prompt individuals to be skeptical of strangers and more territorial about their group domains (Sng et al., 2018), (2) lead to increased endorsement of socially and politically conservative positions (Malka et al., 2014; Oishi et al., 2017), and (3) are conducive to the creation of vertical governmental restriction—laws that impose hierarchies and protect specific groups (Conway et al., 2017, 2020). Thus, having an open personality (i.e., autonomy and the readiness to confront novel challenges when faced with threats) and conservative values (i.e., supporting a social order governed by norms of security, self-discipline and respect for customs to minimize threats) might be most adaptive for thriving in the mountains. 3
It should, of course, be noted that the observed effects are small. 4 Compared to the average correlation between age and values (M |r| = .098), the average correlation between mountainousness (20 miles) and values was about a 10th (M |r| = .009). However, personal values are determined by many factors (Sagiv et al., 2017), and any single factor is likely to have only a small effect (Götz et al, 2021). This argument is especially true in uncontrolled, real-world settings as in the present study, where—compared to classical lab experiments—effect sizes are typically diminished due to heightened error variance (Maner, 2016; Oishi & Graham, 2010). Moreover, their small magnitude does not render the observed effects unimportant. Rather, even small effects can make a big difference when considered over time and at scale (Funder & Ozer, 2019; Matz et al., 2017). The former seems likely as personal values influence human attitudes and behaviors daily (Sagiv et al., 2017). The latter is especially probable for socio-ecological influences, such as mountains that—while distal and thus less influential than personal factors (e.g., demographics)—simultaneously affect large groups of people who share the same environmental milieu (Conway et al., 2020; Lu et al., 2018; Oishi, 2014). Taken together, the immediate impact of mountainousness on personal values may be small. But when considered over a lifetime and at population scale, small effects translate into highly consequential outcomes such as election results (Caprara et al., 2006), cultural capital, and economic growth (Bardi et al., 2008).
Limitations and Future Research
The current research has several limitations. First, due to the correlational nature of our data, no causal inferences can be drawn. Longitudinal studies at the individual and community levels are needed to illuminate the psychological underpinnings of the associations between mountainousness and personal values (i.e., acculturation effects, selective migration or a combination thereof; Götz et al., in press; Rentfrow et al., 2008; Stieger & Lewetz, 2016). Second, while our data offered one of and perhaps the largest personal values samples in the United States, it is not nationally representative. Although the ethnic composition and geographic coverage were broadly representative of the general population, which is common in large-scale online samples (Gosling et al., 2004; Götz, Bleidorn, et al., 2020; Jokela et al., 2015; Kosinski et al., 2015), the participants in our study were younger, predominantly female, and less affluent than the national average (U.S. Census Bureau, 2020). Third, our assessment of personal values was limited to a 20-item short scale. While the TwIVI displayed respectable psychometric properties in the current study and previous research (Sandy et al., 2017; Vignoles et al., 2018), its brevity comes at the cost of reduced measurement precision and content breadth (Credé et al., 2012). Thus, future research should extend the current work by using longer scales, which might include the extended 19-value version (Schwartz et al., 2012) that could offer even more nuanced insights. Such work may also systematically assess nonlinear trends in mountainousness–value associations (Lee et al., 2021). 5 Furthermore, future research might try to dynamically adjust the 20-mile radius as a proxy for the mean commuting distance to the actual commuting distance in each ZIP-code area. Such an adjustment might reduce error variance and isolate the effect of interest more effectively. Lastly, future research should investigate the associations between personal values and other challenging ecologies, including coastlines, swamplands, and deserts (Götz, Stieger, et al., 2020; Oishi et al., 2015).
Conclusions
We examined the associations between mountainousness and personal values by combining large-scale psychological survey data with objective topographical information and advanced machine-learning techniques. We find evidence for small but robust relationships between mountainousness and heightened conservation values. Our results reaffirm the mountains as a challenging and influential element of our physical environment, illuminate its differential associations with values versus personality traits, and advance our understanding of the determinants of personal values.
Supplemental Material
Supplemental Material, sj-doc-1-spp-10.1177_19485506211034966 - A Tale of Peaks and Valleys: Sinusoid Relationship Patterns Between Mountainousness and Basic Human Values
Supplemental Material, sj-doc-1-spp-10.1177_19485506211034966 for A Tale of Peaks and Valleys: Sinusoid Relationship Patterns Between Mountainousness and Basic Human Values by Stefan Stieger, Friedrich M. Götz, Chris Wilson, Selina Volsa and Peter J. Rentfrow in Social Psychological and Personality Science
Footnotes
Author Contribution
Stefan Stieger and Friedrich M, Götz contributed equally to this work.
Data Availability
Complete code to reproduce all analyses and visualizations is publicly available on our Open Science Framework project page (![]() ). The mountainousness measures were developed by the research team and are also provided on the Open Science Framework project page. The TIME Magazine Basic Human Values Dataset is proprietary and may not be publicly shared but is available from the corresponding author Friedrich M. Götz (friedrich.goetz@ubc.ca) upon request. Details on the study materials can be found in the Online Supplement.
). The mountainousness measures were developed by the research team and are also provided on the Open Science Framework project page. The TIME Magazine Basic Human Values Dataset is proprietary and may not be publicly shared but is available from the corresponding author Friedrich M. Götz (friedrich.goetz@ubc.ca) upon request. Details on the study materials can be found in the Online Supplement.
Declaration of Conflicting Interests
The author(s) declared no potential conflicts of interest with respect to the research, authorship, and/or publication of this article.
Funding
The author(s) disclosed receipt of the following financial support for the research, authorship, and/or publication of this article: The present research was financially supported through doctoral scholarships from the UK Economic and Social Research Council and the Cambridge Trust (held by Friedrich M. Götz) and a postdoctoral fellowship from the German Academic Exchange Service (Deutscher Akademischer Austauschdienst; awarded to Friedrich M. Götz).
Supplemental Material
The supplemental material is available in the online version of the article.
Notes
References
Supplementary Material
Please find the following supplemental material available below.
For Open Access articles published under a Creative Commons License, all supplemental material carries the same license as the article it is associated with.
For non-Open Access articles published, all supplemental material carries a non-exclusive license, and permission requests for re-use of supplemental material or any part of supplemental material shall be sent directly to the copyright owner as specified in the copyright notice associated with the article.