
Abstract
The paradox of modern dating is that online platforms provide more opportunities to find a romantic partner than ever before, but people are nevertheless more likely to be single. We hypothesized the existence of a rejection mind-set: The continued access to virtually unlimited potential partners makes people more pessimistic and rejecting. Across three studies, participants immediately started to reject more hypothetical and actual partners when dating online, cumulating on average in a decrease of 27% in chance on acceptance from the first to the last partner option. This was explained by an overall decline in satisfaction with pictures and perceived dating success. For women, the rejection mind-set also resulted in a decreasing likelihood of having romantic matches. Our findings suggest that people gradually “close off” from mating opportunities when online dating.
Keywords
The dating landscape has changed drastically over the past decade, with more and more people looking for a partner online (Hobbs, Owen, & Gerber, 2017). People have never been able to select partners among such an enormous pool of options. As an example, the 10 million active daily users of the popular online dating application Tinder are on average presented with 140 partner options a day (Smith, 2018). While one may expect this drastic increase in mating opportunities to result in an increasing number of romantic relationships, the opposite has occurred: The rise of online dating coincided with an increase in the amount of singles in society (Centraal Bureau voor de Statistiek, 2019; Copen, Daniels, Vespa, & Mosher, 2012; DePaulo, 2017). What could explain this paradox in modern dating?
The abundance of choice in online dating is one of the key factors which explains its success (Lenton & Stewart, 2008). People like having many options to choose from, and the likelihood of finding an option that matches someone’s individual preference should logically increase with more choice (Lancaster, 1990; Patall, Cooper, & Robinson, 2008). However, having extensive choice can have various adverse effects, such as paralysis (i.e., not making any decision at all) and decreased satisfaction (Iyengar & Lepper, 2000; Scheibehenne, Greifeneder, & Todd, 2010; Schwartz, 2004). In fact, it seems that people generally experience less benefits when they have more choice. This observation is reminiscent of the basic economic principle of diminishing returns (Brue, 1993; Shephard & Färe, 1974), in which each unit that is sequentially added to the production process results in less profits.
There is some indirect evidence that having more choice in the domain of dating also has negative consequences. For example, when asked to pick the best partner, access to more partner profiles resulted in more searching, more time spent on evaluating bad choice options, and a lower likelihood of selecting the option with the best personal fit (Wu & Chiou, 2009). Likewise, when a choice set increases, people end up being less satisfied with their ultimate partner choice and more prone to reverse their decision (D’Angelo & Toma, 2017). The adverse effects of choice overload are also mentioned in articles in popular media mentioning phenomena such as “Tinder fatigue” (Beck, 2016) or “dating burnout” (Blair, 2017).
To shed more light on the paradoxical effects of modern dating, we studied what happens once people enter an online dating environment. Our innovative design allowed us to observe how people’s partner choices unfold when people are presented with partner options sequentially—as opposed to simultaneously (D’Angelo & Toma, 2017; Wu & Chiou, 2009). Our main expectation was that online dating will set off a rejection mind-set, leading people to become increasingly likely to reject partners to the extent that they have been presented with more options. Secondly, we explored the question of timing: How quickly will the rejection mind-set kick in? We did not have any a priori hypothesis on what an ideal choice set would be but instead explored a potential “break point” in the tendency to reject. Third, we tested which psychological processes may account for a change in mating decisions.
The Present Research
We tested the existence of a rejection mind-set in online dating across three studies. In Study 1, we presented people with pictures of hypothetical partners, to test if and when people’s general choice behavior would change. In Study 2, we presented people with pictures of partners that were actually available and tested the gradual development of their choice behaviors as well as their success rate in terms of mutual interest (i.e., matches). In Study 3, we explored potential underlying psychological mechanisms. Specifically, and in line with choice overload literature, we explored whether the rejection mind-set may be due to people experiencing lower choice satisfaction and less success over the course of online dating. As an additional goal, we explored the potential moderating role of gender. In all studies, we focused on participants between 18 and 30 years old—a group that makes up 79% of all users of online dating applications (Smith, 2018).
All studies described below received approval from the ethical review board. We uploaded the working data files and R scripts for analyzing the data of all studies on the Open Science Framework (https://osf.io/t 589 v/). We computed post hoc power analyses via the SIMR package, Version 1.0.3 (Green & MacLeod, 2016). This analysis indicated that we had 100%, 92%, and 100% power to confirm the statistical significance (α = .05) of a logistic regression coefficient of b = −.10 in Studies 1, 2, and 3, respectively. Such a coefficient corresponds to a 9.5% decrease in the odds of accepting a partner after one standard deviation (SD) increase in our focal independent variable (see below).
Study 1
Study 1 provided a first test of our main hypothesis. Previous research showed that a set of potential partners ideally consist of 20–50 options (Lenton, Fasolo, & Todd, 2008), and we expected that changes in acceptance may occur when a set goes beyond this range. We therefore randomly divided participants into two conditions, in which they were either presented with 45 partner options (within the ideal range) or with 90 partner options (double the ideal range). We aimed to test whether acceptance rate (i.e., the chance of accepting each consecutive potential partner) would decrease over the course of online dating, and whether this effect differed depending on condition and gender.
Method
Participants and Design
Participants were recruited via Amazon Mechanical Turk (Buhrmester, Kwang, & Gosling, 2011), with the following information: “In this survey, you will be rating pictures of potential romantic partners. This study is ONLY available for participants between 18 and 30 years old, who are heterosexual & single.” Participants received US$2 for taking part in the study.
A total of 423 individuals participated. We deleted 108 participants from our data set because they were not single (N = 94), outside the appropriate age range (N = 6), not heterosexual (N = 1), or with missing data on key variables (N = 7). The remaining data set of 315 participants consisted of an approximately equal amount of men (N = 159) and women (N = 156), in the age range from 18 to 30 years old (M = 26.07, SD = 2.94).
Procedure and Materials
Participants filled out the questionnaire programmed in Qualtrics (version December 2016). After reading general information about the study and giving consent for participation, participants started with the online dating task, which was modeled after the dating application Tinder. In this task, participants were exposed to either 45 or 90 pictures of hypothetical potential partners. These pictures were selected after extensive pretesting on characteristics that we deemed important: perceived age, level of attractiveness, and appropriateness for use as online dating pictures. The final set contained pictures of hypothetical potential partners that were perceived to be between 18 and 30 years old (matching the age range of our participants), appropriate as online dating pictures, and slightly above average in attractiveness level (for a detailed report, see https://osf.io/zntb 6 /).
After given consent for participation, participants received the following instructions: “In the following task, 45/90 [depending on condition] pictures of potential partners will be presented on the screen. We kindly ask you to respond to these pictures, by clicking the green heart to accept, or the red cross to reject the picture.” The pictures appeared in random order in the middle of the screen one by one. We counted the number of pictures that had been presented previously and saved this information as a sequence variable (i.e., a continuous variable having a value of 9 for the 10th picture, 10 for the 11th picture, etc.). There was no time limit, and a new picture was presented immediately after participants gave a response on the previous picture.
After the online dating task, participants filled out several questionnaires (for a complete list of all the variables that were assessed, see https://osf.io/zntb 6 /), including a question on participants’ level of satisfaction (a measure we will discuss under the heading “Additional Analyses across Studies”): “Are you satisfied with the choices you made for the people that you have accepted?” on a scale from 1 (not at all) to 10 (very much). Thereafter, participants were informed about the main goal of the study, thanked for their participation, and paid.
Analytic Strategy
In all studies, we used R Version 3.4.1 (R Core Team, 2013) and lme4 Version 1.1.13 (Bates, Mächler, Bolker, & Walker, 2014) to model the relationship between sequence, condition (0 = 90 pictures, 1 = 45 pictures), gender (0 = male, 1 = female), and the acceptance level of pictures of potential partners. For each study, we also ran a model in which the effect of sequence interacted with gender. Because people likely differ in selectivity, we applied random effects modeling, with choices nested within participants. In all analyses, we modeled random intercepts only (and not random slopes). For models with binomial outcomes (e.g., choices, matches), we computed logistic regressions. p Values of all multilevel coefficients were computed with the package lmerTest, Version 2.0-33 (Kuznetsova, Brockhoff, & Christensen, 2017).
Results
Descriptive Statistics
Means and SDs of all relevant variables across all three studies are displayed in Table 1.
Means and Standard Deviations of All Relevant Variables Across Studies 1–3.
Note. Perceived success 1: “How many of the people from the previous block do you think would have accepted your picture?” (1–10); Perceived success 2: “How many matches do you think would you have in the previous block?” (1–10); Satisfaction with pictures: “I am satisfied with the quality of the pictures in the previous block” (1–100). All 3 items in Study 3 were logarithmized to reduce skew.
Main Effect of Condition, Gender, and Sequence
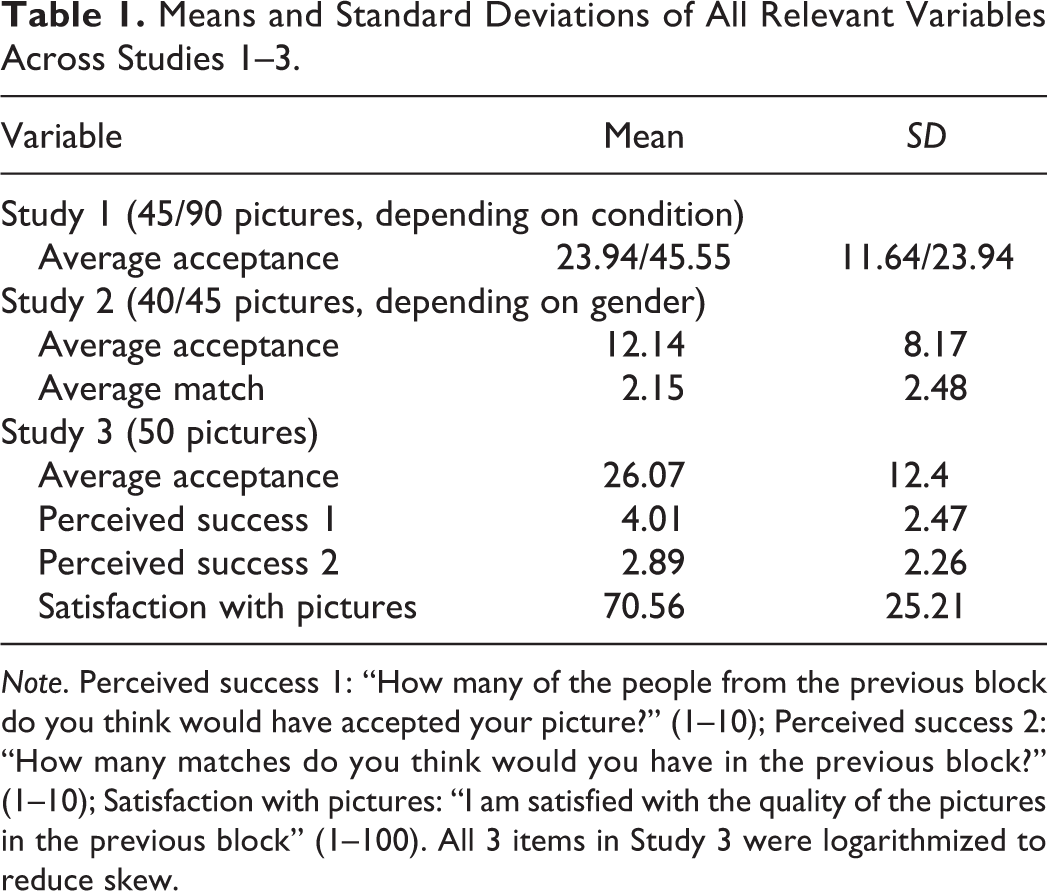
We first entered condition, sequence, and gender (not the interaction terms) into the model as fixed effects and the intercept as random effect (to account for between-person differences in selectivity). Our results showed that condition did not significantly affect acceptance rate, b = 0.038, p = .80, 95% confidence interval (CI) [−0.260, 0.336]. Gender did affect acceptance rate, b = −1.94, p < .001, 95% CI [−2.240, −1.645], with men accepting on average 34% more pictures of potential partners compared to women. Sequence also affected acceptance rate, b = −0.123, p < .001, 95% CI [−0.159, −0.087]. As compared to the first picture, the chance on acceptance on average decreased with 29% over the task. Given that both Studies 1 and 3 used the same set of pictures, we represented the effect of sequence on acceptance rate of these studies combined in Figure 1.
The effect of sequence on choice behavior for women and men in Studies 1 and 3. Higher scores represent a higher chance on acceptance of the picture of a potential partner. The lines in the figure represent smoothed predicted means, using the “loess” algorithm of the ggplot2 package (version 2.2.1). The gray area around the lines represent the 95% confidence intervals around these predicted means.
Interaction Effects of Sequence With Condition and Gender
We also ran the model with sequence, condition, and gender as well as their two- and three-way interactions added as fixed effects. Results indicated that the two-way interaction between sequence and condition (b = −0.231, p = .006, 95% CI [−0.394, −0.068]) and the three-way interaction between sequence, condition, and gender (b = 0.278, p = .012, 95% CI [0.061, 0.496]) were significant. Subsequent analyses on the simple slopes revealed that the effect of sequence was significant for all groups (p < .006), except for women presented with 45 pictures (b = −0.095, p = .16, 95% CI [−0.227, 0.037]). Plotting the effects indicated that only the effects of sequence and gender appeared consistent, which is why we did not further investigate the effect of condition.
Existence of Break Points
We used the strucchange package Version 1.5-1 in R (Zeileis, Leisch, Hornik, & Kleiber, 2002) to identify the so-called break points: moments in the study during which responses started to shift. Across genders, the decrease in acceptance was steep between Photos 1 and 13 and became relatively flat thereafter.
Discussion
Study 1 showed support for our main hypothesis that people become increasingly likely to reject potential partners while online dating—a trend that was especially prevalent in the first dozen pictures.
Study 2
Our main aim of Study 2 was to replicate the effect of sequence on partner acceptance with consequential partner choices. Additionally, we wanted to test whether the likelihood of having a “match” (a case of mutual acceptance: participant A accepts the picture of participant B and vice versa) is also affected by sequence. We preregistered Study 2 (https://aspredicted.org/y 7 ik 9 .pdf) but slightly deviated from the preregistration in the execution of the study. Specifically, due to time constraints, we did not assess whether level of satisfaction with the pictures and perceived success changed over time. Instead, we added these variables to Study 3.
Method
Participants
Participants were recruited by handing out flyers at the university campus, via e-mail, and social media channels. We invited single, heterosexual people between 18 and 30 years to participate in a study on online dating. As compensation, participants could enter a raffle to win one of four cinema tickets. Sample size was determined by the maximum number of participants we could recruit in the weeks before the study started, while keeping the gender ratio equal.
A total of 170 people signed up for the study by sending in a picture, and 164 individuals continued by participating in the online dating task. We deleted six participants from our data set because they were not single (N = 5) or because they requested their data to be removed after participation (N = 1). The remaining data set of 158 participants consisted of 82 men and 76 women between 18 and 29 years old (M = 22.24, SD = 2.48).
Procedure and Materials
We instructed participants to send in a picture in color, in which their face was clearly visible and there were no other people displayed. We created two sets of groups, each comprising of 45 men and 40 women. Participants received a link to the questionnaire via e-mail, that started by a request for consent for participation. The online dating task started with similar instructions as in Study 1, with the following addition: “The people in the pictures also rate your picture, and you can really get a ‘match.’” Participants were not informed on the set size prior to the task.
After the online dating task, participants filled out several questionnaires (see https://osf.io/zntb 6 /), including the item assessing level of satisfaction (see Study 1). Participants were then informed on the goal of the study, and thanked. Within 1 week after completion of the study, participants received an e-mail containing the picture and the e-mail address of their matches, and information on whether they had won a cinema ticket.
Analytic Strategy
We used the same analytic strategy as described in Study 1 but nested within targets to account for differences in attractiveness.
Results
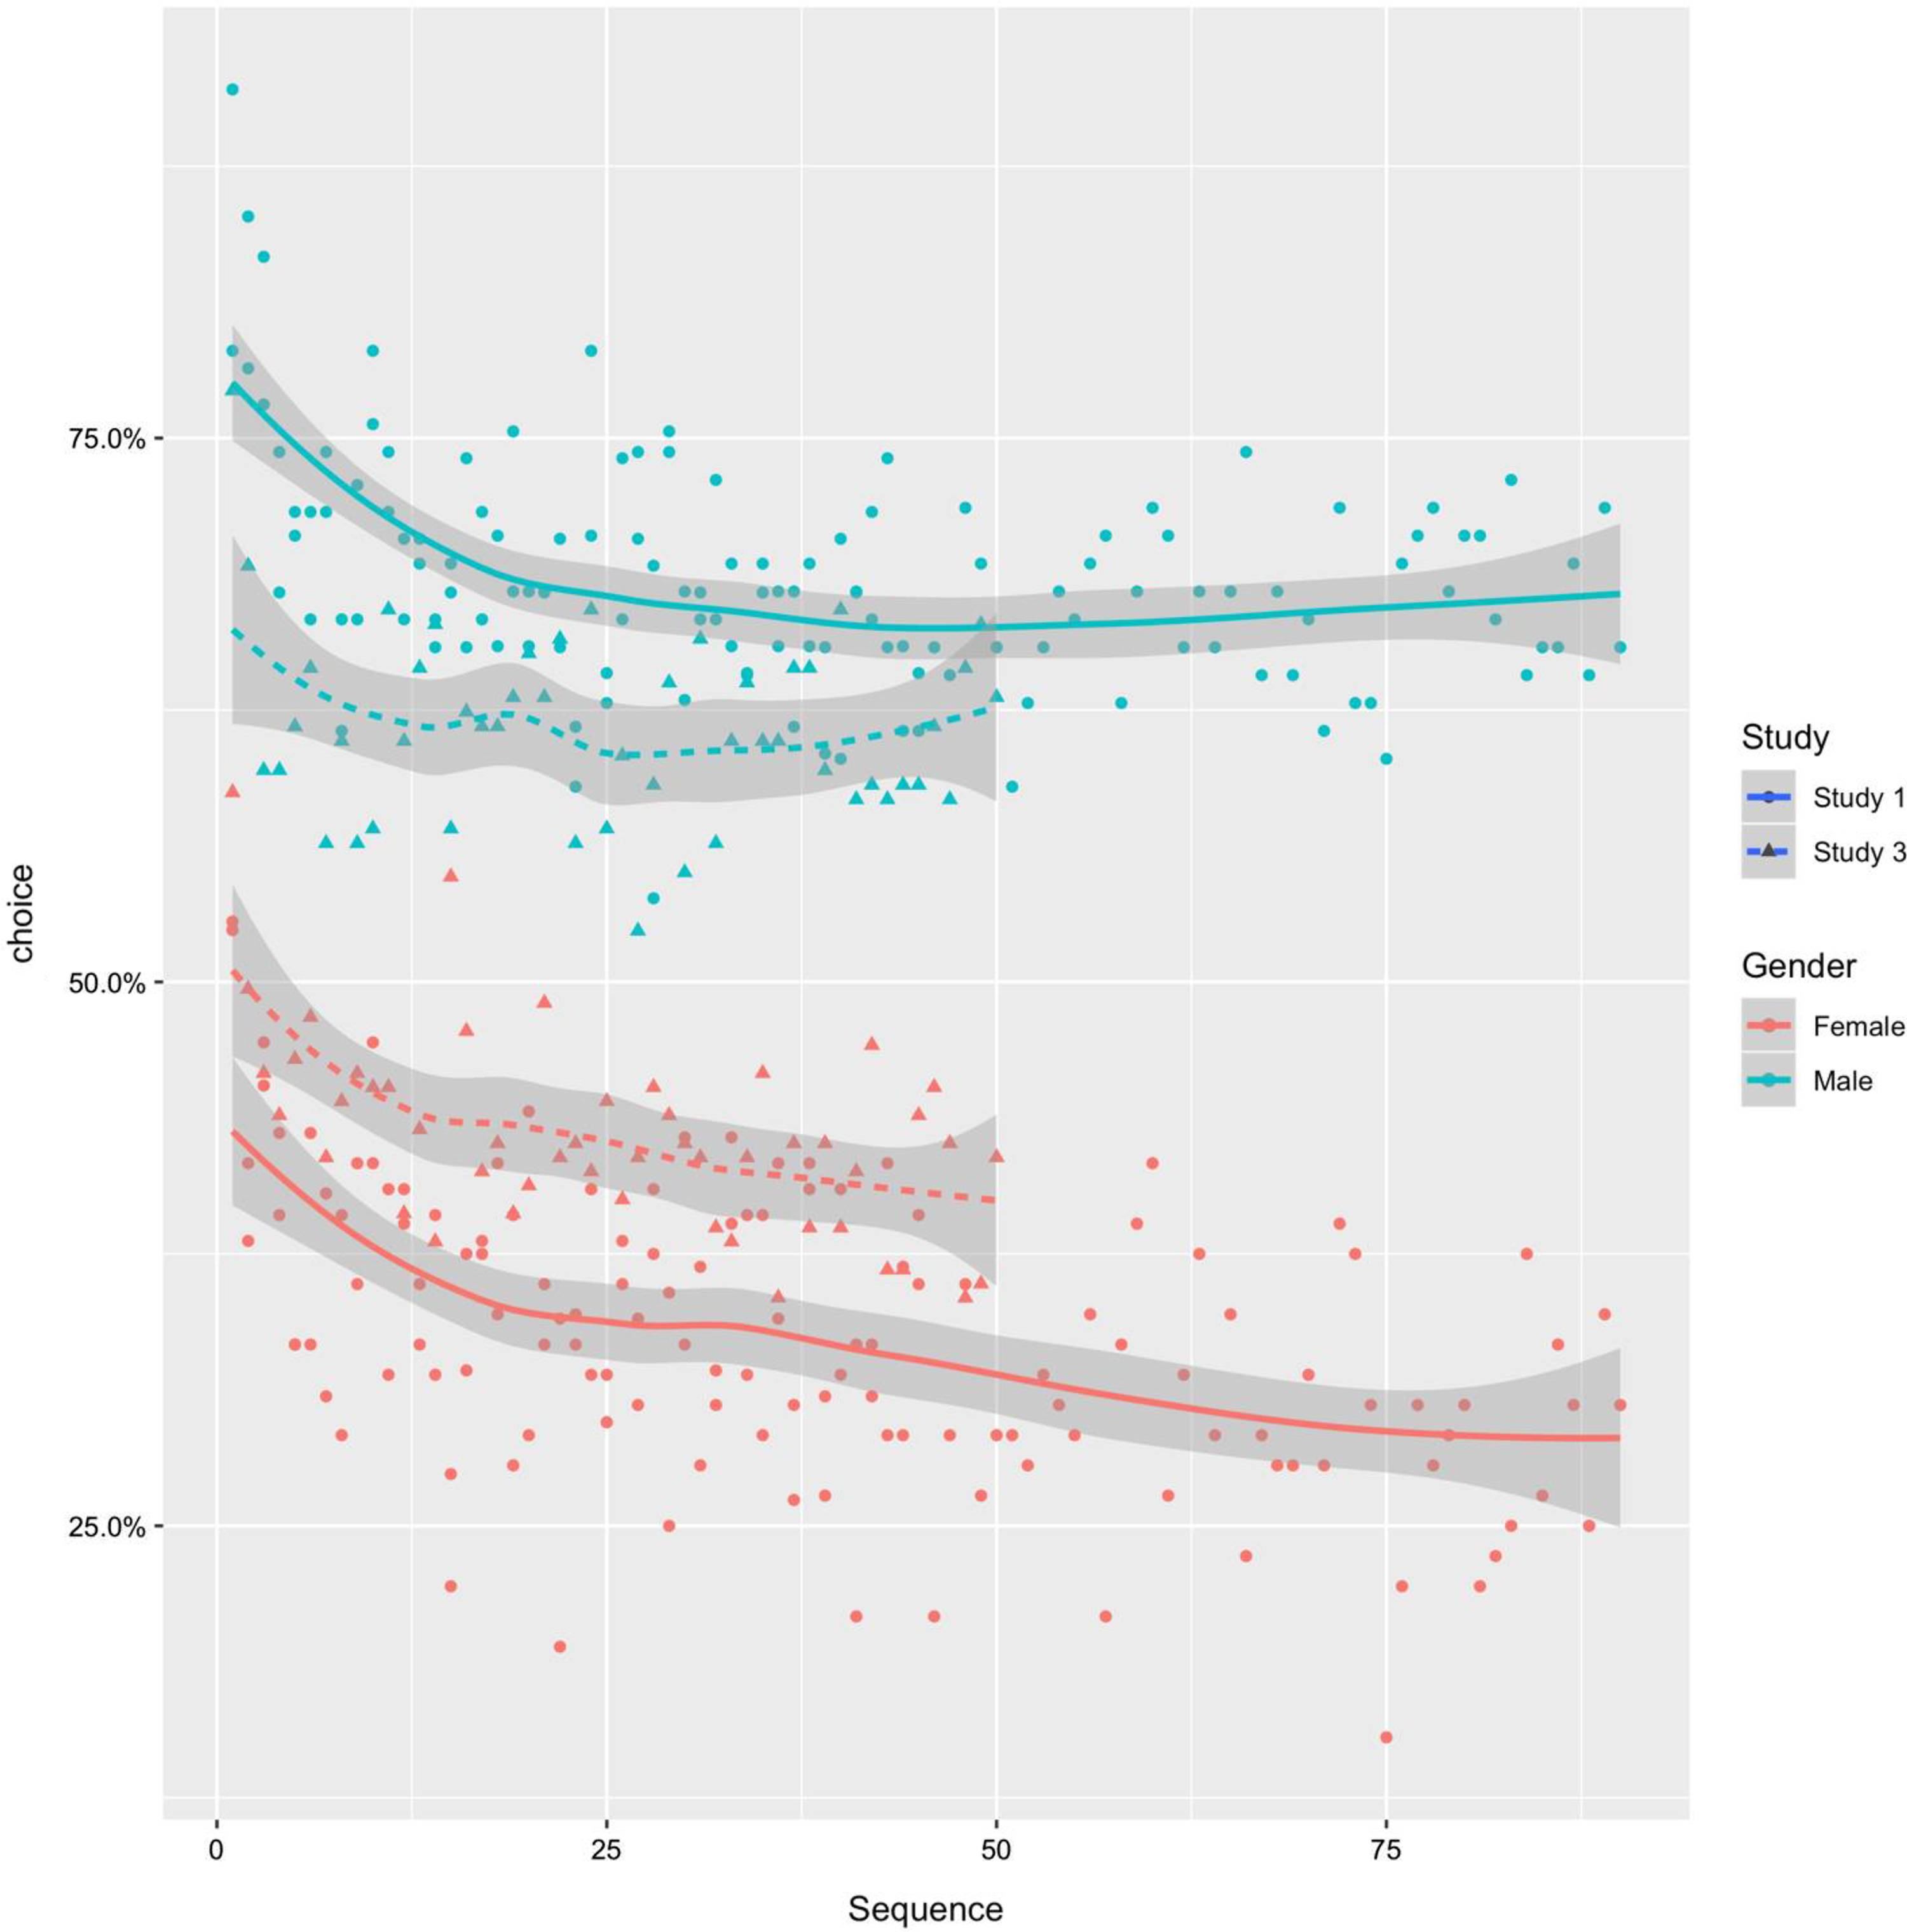
We modeled the relationship between sequence, gender, and the acceptance level of pictures of potential partners, see Figure 2.
The effect of sequence on choice behavior for women and men in Study 2. Higher scores represent a higher chance on acceptance of the picture. The lines in the figure represent smoothed predicted means, using the “loess” algorithm of the ggplot2 package. The gray area around the lines represent the 95% confidence intervals around these predicted means.
Main and Interactive Effect of Sequence and Gender on Acceptance Level
We first entered sequence and gender into the model as fixed effects and the intercept for subjects as random effect. Our results showed that gender affected acceptance rate, b = −1.897, p < .001, 95% CI [−2.617, −1.197], with men accepting on average 25% more potential partners compared to women. Sequence also affected acceptance rate, b = −0.130, p < .001, 95% CI [−0.205, −0.056], lowering it by about 29% over the entire task. The interaction between sequence and gender did not significantly affect acceptance rate, b = −0.034, p = .65, 95% CI [−0.183, 0.115]. A break point occurred at the 31st photo for women and at the 34th photo for men. The decrease in acceptance was relatively flat up to this break point and became steeper thereafter.
Main and Interactive Effect of Sequence and Gender on Match Rate
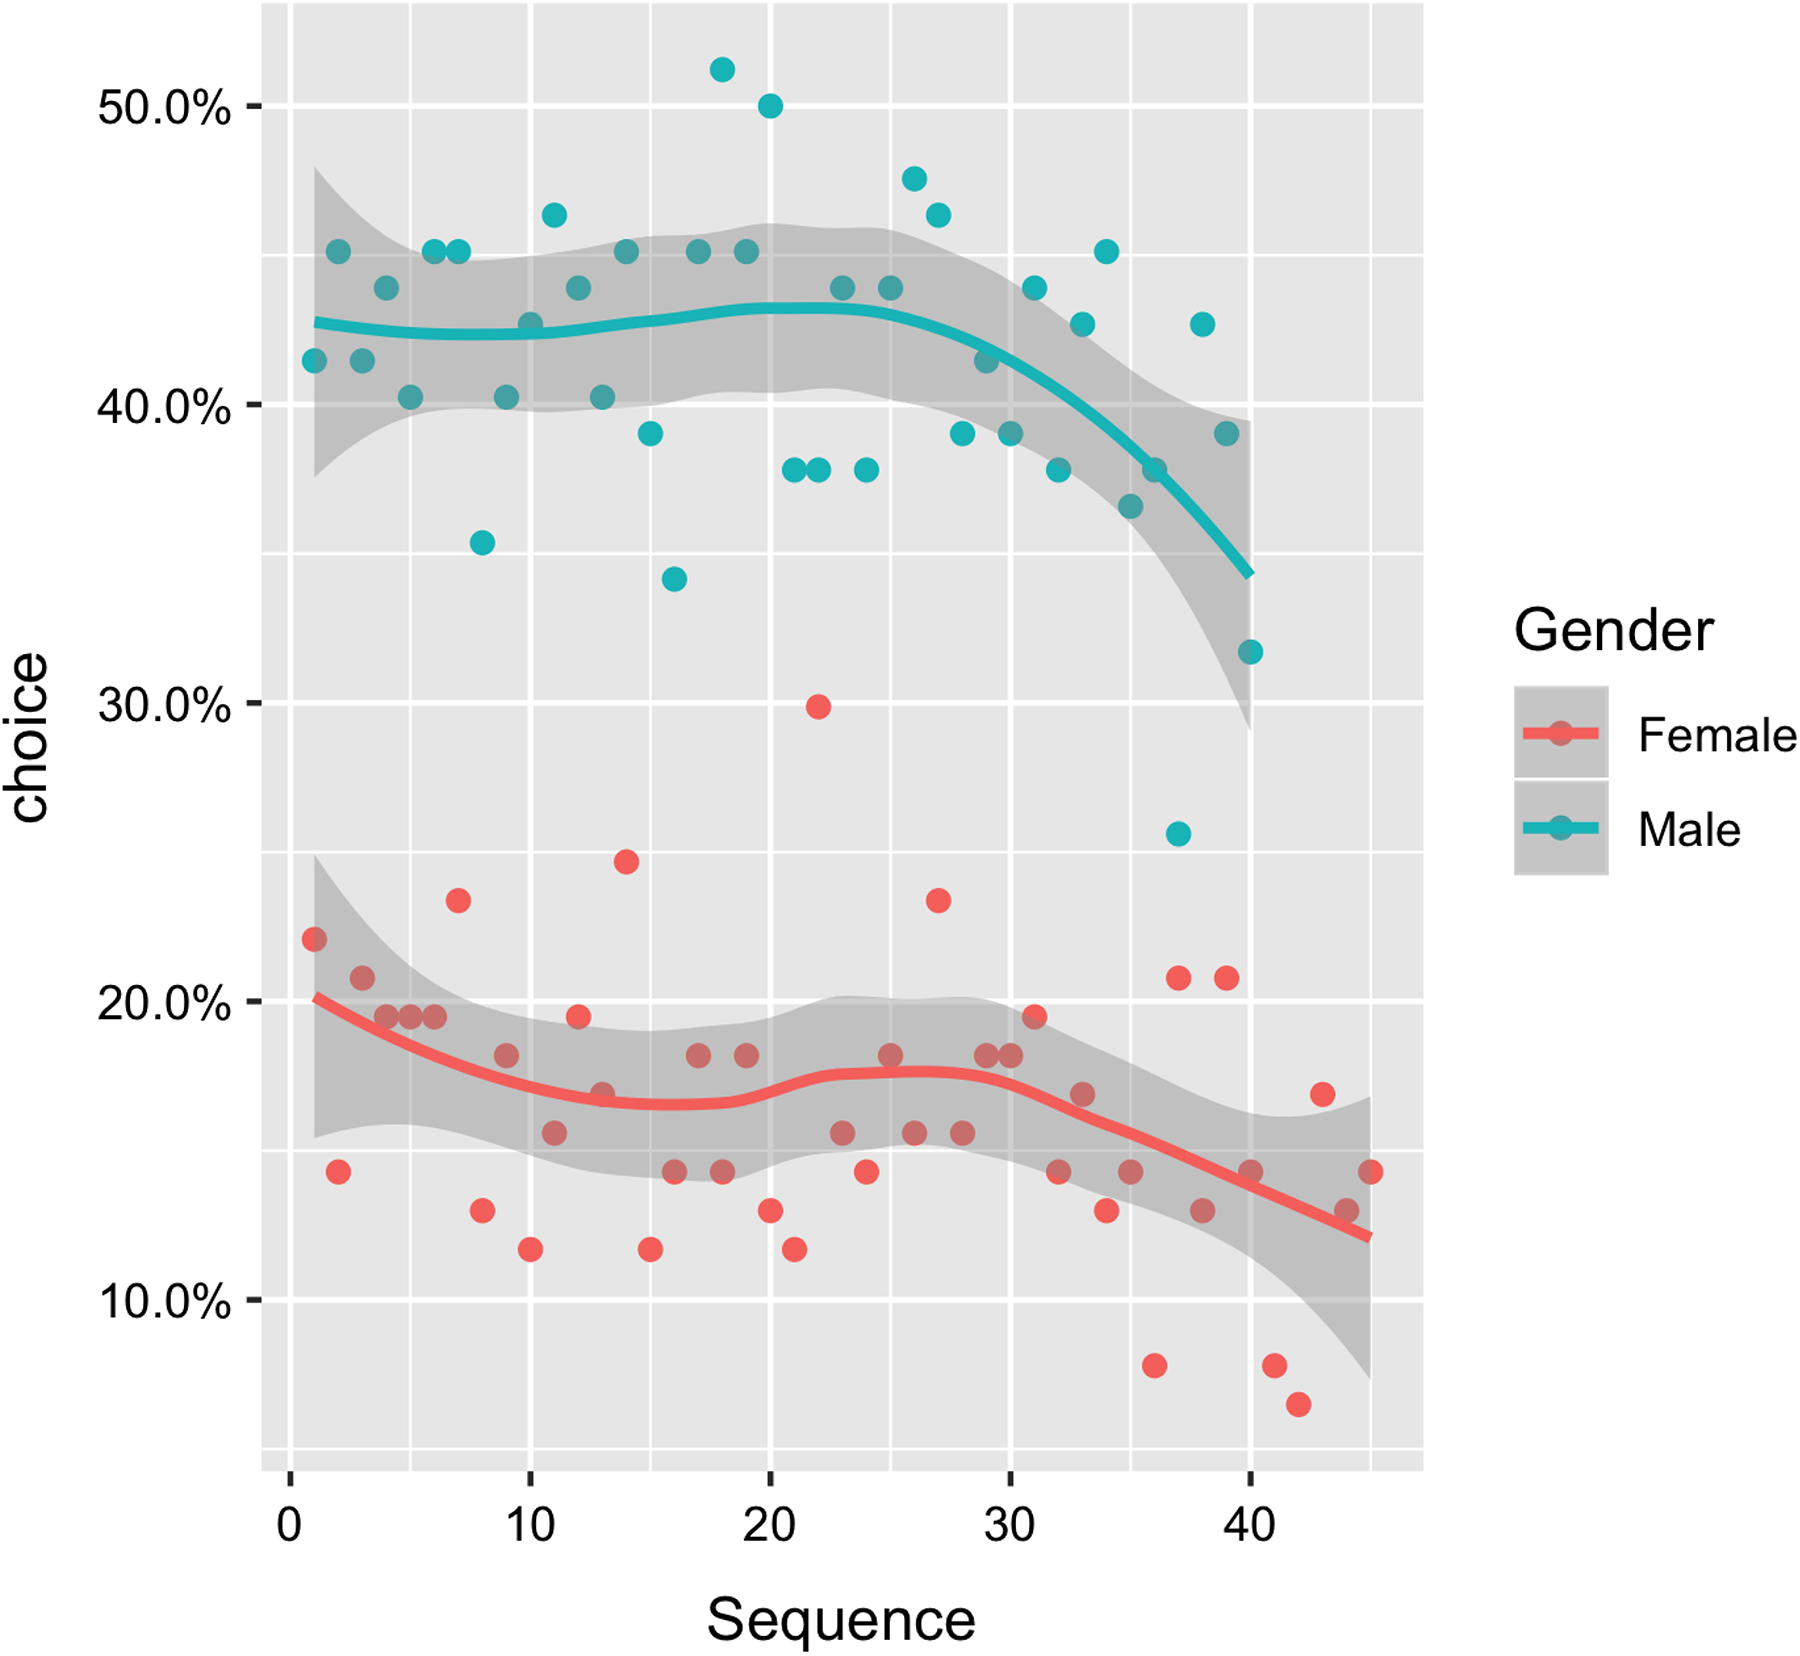
We modeled the relationship between sequence, gender, and match probability using multilevel modeling in R (specifying a binary outcome variable, with 0 = no match vs. 1 = match). Sequence, gender, and their interaction were entered into the model as fixed effects and the intercept for subjects as random effect. Our results showed that neither the effect of gender (b = 0.097, p = .74, 95% CI [−0.483, 0.681]) nor the effect of sequence (b = 0.172, p = .08, 95% CI [−0.018, 0.364]) was statistically significant. However, the interaction between sequence and gender on match rate was significant, b = −0.379, p = .003, 95% CI [−0.628, −0.131], see Figure 3 (for an alternative approach of this analysis, see https://osf.io/x 9 gvh/). Simple slope analyses showed that women’s chances on a match decreased over the task, b = −0.206, p = .011, 95% CI [−0.366, −0.048], lowering it by a total of 70%. This effect was not significant for men, b = 0.172, p = .078, 95% CI [−0.018, 0.365]. Only for women, a break point occurred at the 8th picture, so that there was a steep decrease in match probability during these first trials, after which the effect flattened out.
The effect of sequence on match rate for women and men in Study 2. Higher scores represent a higher chance on having a match with a potential partner. The lines in the figure represent smoothed predicted means, using the “loess” algorithm of the ggplot2 package. The gray area around the lines represent the 95% confidence intervals around these predicted means.
Discussion
In Study 2, we replicated the findings of Study 1, demonstrating that people become more likely to reject—actually available—potential partners. For women, the likelihood of having a match also declined.
As compared to Study 1, overall rejection rate in Study 2 was higher and the break point occurred much later. This may be due to some key differences between the two studies. First, Study 2 involved real-life mating decisions. Second, we recruited Amazon Mechanical Turk workers in Study 1 and Dutch university students in Study 2. Third, we used a preselected set of above-average attractive partners in Study 1 versus a set of actually available partners with various ranges of attractiveness in Study 2.
Study 3
In Study 3, we aimed to replicate the rejection mind-set effect once more and explored potential underlying psychological mechanisms (i.e., level of satisfaction with pictures and perception of own dating success). To do so, we added questions about participants’ experience with the online dating task after every block of 10 pictures.
Method
Participants
We invited single, heterosexual people between 18 and 30 years to participate on M-Turk for US$2. As in Study 1, we aimed to recruit 400 participants.
A total of 402 individuals participated. We deleted 93 participants from our data set because they were not single (N = 90), outside the appropriate age range (N = 3), or with missing data on key variables (N = 4). The remaining data set of 305 participants consisted of an approximately equal amount of men (N = 150) and women (N = 155) from 18 to 30 years old (M = 26.16, SD = 2.80).
Procedure and Materials
After giving consent for participation, participants completed the same online dating task as described in Study 1. All participants were exposed to 50 pictures of hypothetical partners (derived from the same picture set we used in Study 1), which were divided in 5 blocks each containing 10 pictures. Participants were instructed beforehand about the set size and the division of pictures into blocks of 10. We distributed the pictures so that the mean attractiveness level of the pictures in each block was similar, and we counterbalanced the presentation of the blocks between participants (see https://osf.io/zntb 6 /). The sequence variable thus referred to the order of the blocks in this analysis. Within each block, the pictures were randomly presented.
In between blocks, participants answered several questions about their experience with the task in the past block. We explored the effect of different mediators (for a complete list, see https://osf.io/zntb 6 /), including one question about level of satisfaction with the quality of the pictures (“I am satisfied with the quality of the pictures in the previous block”), measured with a slider (0–100; the default starting point of 50). We also included two questions on participants’ perception of their own success (“How many of the people from the previous block do you think would have accepted your picture?” and “How many matches do you think would you have in the previous block?”), for which participants entered a number between 0 and 10. Because of the high correlation between these 2 items (r between .65 and .75 across blocks), we computed the mean score as our indicator of perceived dating success.
At the end of the final block, participants filled out several questionnaires (see https://osf.io/zntb 6 /), including the item assessing their level of satisfaction (see Study 1). Then, participants were informed on the main goal of the study, thanked for their participation, and paid.
Analytic Strategy
We used the same analytic strategy as described in Study 1.
Results
Main and Interactive Effect of Sequence and Gender
We visualized the effects of (block) sequence and gender on acceptance rate in Figure 1. We first entered sequence and gender into the model as fixed effects and the intercept for subjects as random effect. Our results showed that gender affected acceptance rate, b = −1.019, p < .001, 95% CI [−1.304, −0.736], with men accepting on average 19% more potential partners compared to women. Sequence did not affect acceptance rate, b = −0.035, p = 0.1917, 95% CI [−0.088, 0.0176]. The interaction between sequence and gender significantly affected acceptance rate, b = −0.083, p = .03, 95% CI [−0.155, −0.010]. Simple slope analyses revealed that the effect of sequence was significant for women (decreasing with 29% over the entire task), b = −0.117, p < .001, 95% CI [−0.1668, −0.0674], but not for men, b = −0.035, p = 0.19, 95% CI [−0.088, 0.0175]. Only for women, a break point occurred at the 16th picture, so that the decrease in acceptance was steep up to this break point and became relatively flat thereafter.
Mediation Effect of Psychological Constructs
We performed all mediation analyses using lavaan Version 0.5-23.1097 (Rosseel, 2012). We specified a model with a direct effect of sequence on acceptance as well as an indirect effect consisting of the effect of sequence on the mediator, multiplied by the effect of the mediator on acceptance. Mediation was established by testing this indirect effect. We used the lavaan.survey package, Version 1.1.3.1 (Oberski, 2014) to account for the nested structure of our data.
Results of the mediation analysis are depicted in Figure 4. As can be seen, two factors turned out to be significant mediators: level of satisfaction with pictures and perception of own dating success. These items were logarithmized to reduce skew (right skew in perceived success, left skew in satisfaction). When we included both mediating paths simultaneously, there was a significant indirect effect of sequence on acceptance via reduced satisfaction with pictures, b = −0.004, p = .006, 95% CI [−0.007, −0.001]. Similarly, there was a significant indirect effect via reduced perceptions of own dating success, b = −0.004, p = .002, 95% CI [−0.006, −0.001]. After controlling for both independent indirect effects, the direct effect was no longer significant, b = −0.002, p = .53, 95% CI [−0.007, 0.004], showing full mediation. Constraining regression paths to be equal across gender did not result in a decrease in fit when compared to a model with unconstrained regression paths, ▵χ2(5) = 7.98, p = .16 (for additional analyses on the mediators, see https://osf.io/x9gvh/).
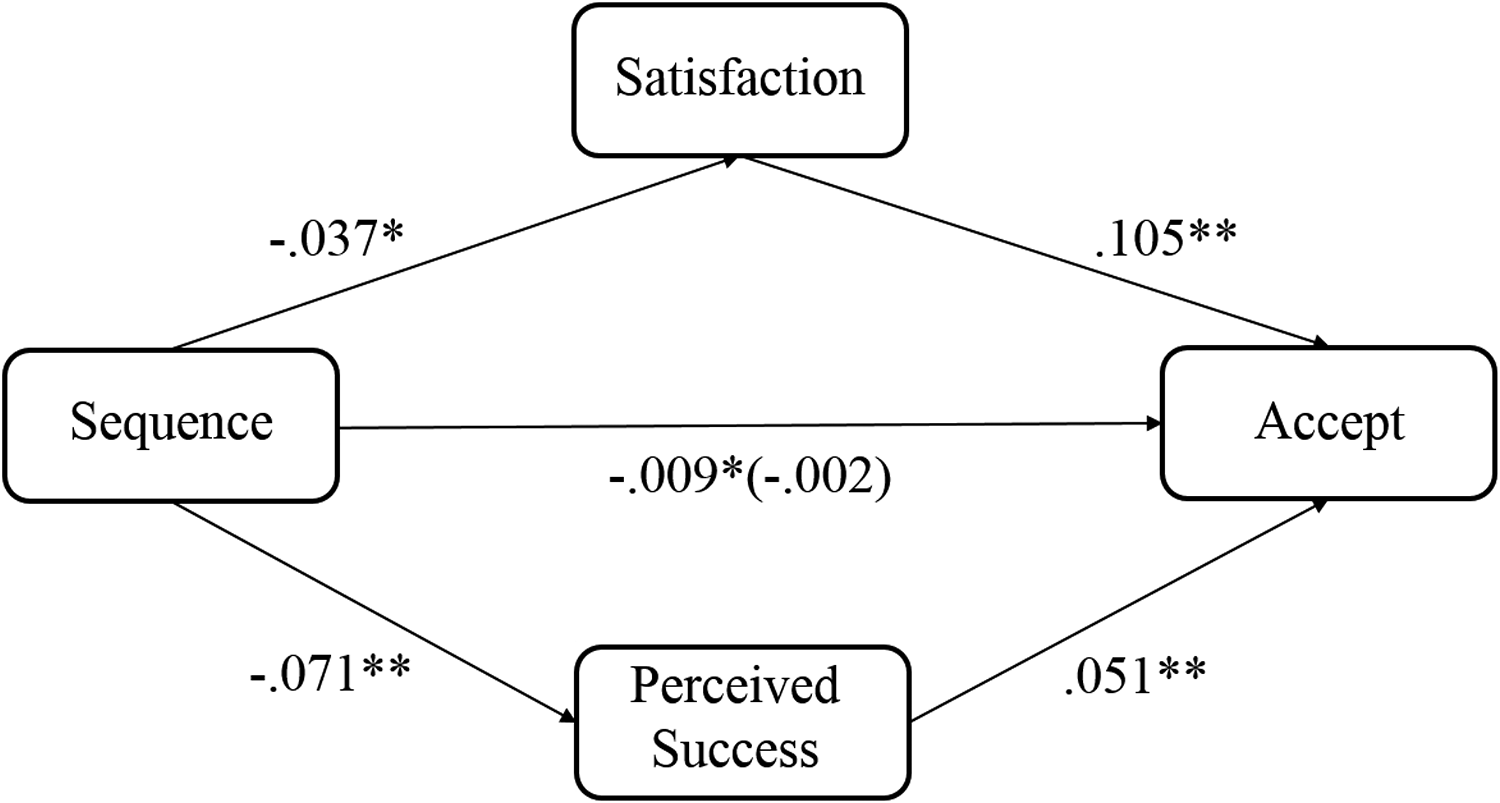
The standardized regression coefficients for the relationship between block sequence and acceptance rate, as mediated by satisfaction with the pictures and participants’ perception of their romantic success in each block. *p < .01. **p < .001.
Discussion
The results of Study 3 again showed that women (but not men) became more likely to reject partner options when online dating. Moreover, Study 3 revealed that people experienced a decrease in satisfaction with the pictures and a decrease in perceptions of their own dating success, which in turn accounted for the increasing tendency to reject potential partners.
Additional Analyses Across All Studies
Relationship Between Tendency to Reject and Satisfaction
One could argue that an increased rejection rate may not necessarily be harmful; it may instead help people focus on the best possible partner options and thus leave them more satisfied with the set of partners they accepted. However, across all three studies, there was a negative relationship between overall rejection behavior and satisfaction with the partner options participants accepted (r = −.34 in Study 1, −.20 in Study 2, and −.22 in Study 3, p ≤ .01). Thus, people who were more rejecting were more likely to be less satisfied with the smaller number of partner options they did accept compared to people who were overall more accepting.
Effect of Sequence Versus Cumulative Rejection
We assumed that the increasing tendency to reject is due to sequence (i.e., more choice options), but it may also be explained by cumulative rejection (i.e., more previous rejections)— variables that were highly (but not perfectly) correlated in our studies (∼r = .70). To disentangle these effects, we included a “rejection count” variable in our models together with the sequence variable as well as a between-person variable representing a participant’s average likelihood to reject partners. Results indicated that it was the cumulative rejection of profiles that increased the likelihood of rejecting a following partner (Study 1: b = −0.749, p < .001, 95% CI [−0.890, −0.610]; Study 2: b = −1.359, p < .001, 95% CI [−1.708, −1.016]; Study 3: b = −0.884, p < .001, 95% CI [−1.024, −0.745]). After controlling for this tendency, the sequence effect actually became positive (Study 1: b = 0.340, p < .001, 95% CI [0.248, 0.434]; Study 2: b = 0.815, p < .001, 95% CI [0.574, 1.059]; Study 3: b = 0.525, p < .001, 95% CI [0.422, 0.630])—an effect that should be interpreted with caution given concerns of multicollinearity.
General Discussion
The findings of all three studies showed support for our main hypothesis that a higher number of partner options sets off a rejection mind-set: People become increasingly likely to reject potential partners to the extent that they are presented with more options. In Studies 1 and 3, the first partner option had the highest chance of being accepted, after which the acceptance rate decreased up to stabilization after circa a dozen choices. In Study 2, rejection rate remained stable up to circa 30 choices, after which decrease accelerated—suggesting that the rejection mind-set might be postponed when participants expect real interactions.
In all studies, women became increasingly likely to reject potential partners, while for men this effect was either weaker (Study 1), similar (Study 2), or not significant (Study 3). In Study 2, the likelihood of finding a match only significantly decreased for women. Overall, the adverse effects of choice abundance in dating thus seem to apply particularly to women—the gender that is already much less likely to accept potential partners to begin with, possibly consistent with evolutionary pressures (Buss & Schmitt, 1993). As a consequence, the initial benefit women have in their likelihood of having a match dissolved in the process of online dating.
The results of Study 3 suggested two underlying psychological mechanisms of the rejection mind-set: increased dissatisfaction with the pictures and increased pessimism about one’s chances of finding a partner through this platform. These findings are seemingly in line with choice overload theory (Iyengar & Lepper, 2000; Scheibehenne et al., 2010; Schwartz, 2004). However, results of our cumulating rejection variable showed that more choice does not always lead to more rejection. Instead, participants became increasingly rejecting depending on how many partners they already rejected. This may explain why we did not find an effect for condition in Study 1, and it might also be the reason why the sequence effect was sometimes stronger for women: Because women typically reject more, they might also cumulate rejections more quickly and thus more easily adopt a rejection mind-set. Future research using an experimental approach is needed to disentangle the effect of rejection behavior from cumulative choice.
We also aimed to gain some insight into the question of timing: When does the rejection mind-set kick in? Current findings do not give a clear answer to this question, given that results of the exploratory break-point analyses were relatively inconsistent. However, across all studies, acceptance rate decreased over the course of online dating. An implication of this main finding is that people may benefit from restricting their search (or at least the amount of rejections during this search) when online dating. One may even consider deciding on one potential partner at a time, followed by a substantial period of time to “de-habituate.” Another implication is that the order in which someone’s picture is presented has consequences on this person’s chance on romantic success. In line with this observation, Tinder now offers users the option to pay to have their picture shown first in the row (Robinson, 2018).
Dating is not the only domain in life in which choice options have vastly expanded. From relatively mundane daily choices (e.g., grocery shopping) to major life decisions (e.g., buying a house), people now face more options than ever before. It remains to be tested whether a rejection mind-set also applies to these contexts. Also, it would be interesting to test whether the rejection mind-set is specific for online dating or whether it generalizes to other forms of dating (e.g., speed dating).
Historically speaking, people’s chances of finding a suitable mate have been limited, leading to a strong preference for dating environments with more partner options. Online dating has smartly catered to this appetite for choice, offering users access to a virtually endless pool of partner options. Our research reveals that—instead of benefiting from more choice options, and coming closer to finding out what the best possible partner is—the stream of partner profiles can set in motion an overall feeling of dissatisfaction and pessimism about finding a mate, which leads users to gradually “close off” from mating opportunities. Our findings might therefore explain why people are increasingly dissatisfied and frustrated by modern dating.
Footnotes
Declaration of Conflicting Interests
The author(s) declared no potential conflicts of interest with respect to the research, authorship, and/or publication of this article.
Funding
The author(s) received no financial support for the research, authorship, and/or publication of this article.