
Abstract
Objective
To develop and validate an in vivo image acquisition protocol for assessment of cartilage degeneration in an osteoarthritis (OA) mouse model using contrast-enhanced micro–computed tomography (CECT).
Design
Three-, four-, seven-, and 10-month-old male STR/ort OA (n = 8) and healthy control CBA/1 (n = 8) mice were imaged using synchrotron-radiation micro–computed tomography. Mean attenuation of cartilage and mean attenuation difference between cartilage and contrast agent (mean Δ attenuation), to control for flux, were calculated and correlated to previously published cartilage parameters measured in the same mice. In a second experiment, C57Bl/6 mice underwent destabilization of medial meniscus (DMM) surgery or sham surgery. At 0 (n = 8 DMM), and 4 weeks (n = 10 DMM, n = 6 sham) post-surgery, mice were imaged using CECT. Mean attenuation and Osteoarthritis Research Society International (OARSI) score of cartilage were calculated, and mean attenuation and OARSI score were correlated.
Results
Mean Δ attenuation of medial cartilage was lower in STR/ort OA mice compared to healthy control CBA/1 at 3-, 4-, 7-, and 10-months of age. Medial mean Δ attenuation was positively correlated to cartilage volume and thickness and negatively correlated with surface-to-volume ratio and Collins score. The mean attenuation and OARSI score of cartilage in DMM OA mice was higher than in sham controls in the medial tibia. Mean attenuation was positively correlated with OARSI score in the medial tibia.
Conclusions
An in vivo CECT imaging method was developed and validated. Mean attenuation is sensitive to cartilage degeneration in OA mouse models when imaged against a contrast agent as a background and using in vivo compatible image acquisition parameters.
Introduction
Contrast-enhanced micro–computed tomography (CECT) using ionic contrast agents has previously been used to quantify glycosaminoglycan (GAG) content of cartilage ex vivo.1-4 Depletion of negatively charged GAG in cartilage leads to a decreased influx of positively charged contrast agent or an increased influx of negatively charged contrast agent, respectively. This results in darker, lower attenuating, or brighter, higher attenuating cartilage in CECT images. Hence, mean attenuation of cartilage can be correlated to GAG content.1-6 Translating this method to pre-clinical in vivo applications would allow GAG content changes, such as those observed in osteoarthritis (OA), to be tracked over time in individual animals, thereby decreasing the number of animals required for each study.
To achieve in vivo CECT imaging of small animal models such as mice, however, there are a number of factors that need to be considered, such as image resolution, contrast agent volume, and cartilage to background contrast. For example, higher resolution images (smaller voxel size, smaller slice thickness) require longer scan times because more images need to be acquired for the same sample length. In addition, integration time further impacts scan time as it defines the time that the signal is collected at the detectors, hence, longer integration times improve signal-to-noise ratio of images and therefore image quality but also increase scan time. Unlike ex vivo experiments which have few time constraints, scanning time is limited in in vivo experiments where the mice are anesthetized for the duration of image acquisition, which poses an increasingly high risk to their well-being and survival the longer anesthesia continues.7,8 As a result, imaging times are kept as short as possible, limiting the image resolution that can be obtained.
A second consideration is the method by which the contrast agent is administered into the cartilage. In ex vivo experiments, cartilage is soaked in a contrast agent before imaging against a low-contrast background.1-6 As such, there is an abundance of contrast agent available to penetrate the cartilage, allowing the boundary between tissue and background to be easily identified. In contrast, since the contrast agent is injected directly into the joint for in vivo experiments, the volume of contrast agent is restricted to avoid rupture of the capsule, thereby resulting in limited contrast agent available to penetrate the cartilage.
9
As such, the cartilage is imaged against a contrast agent in the joint space (
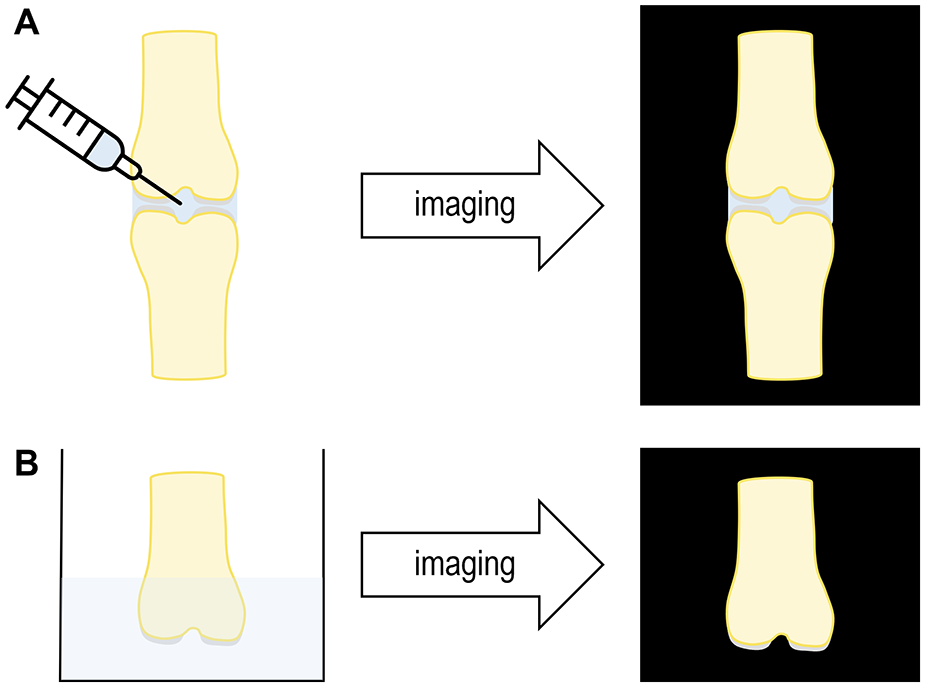
Visualization of contrast agent administration and imaging of (A) in situ/in vivo and (B) ex vivo joints with contrast-enhanced micro–computed tomography. For in situ/in vivo imaging, contrast agent is injected in joint space, resulting in low contrast between cartilage and background during imaging. For ex vivo imaging, bone is soaked in contrast agent and imaged against low-attenuating background such as air, resulting in a high contrast difference between cartilage and background.
Therefore, the first aim of this study was to investigate the feasibility of detecting cartilage degeneration in a mouse model with established OA using mean cartilage attenuation in high-resolution CECT images of excised tibiae against the contrast agent after soaking them in the anionic contrast agent. The second aim of this study was to test the feasibility of detecting changes in mean cartilage attenuation in situ after intra-articular injection of an anionic contrast agent, in an OA mouse model using image acquisition parameters suitable for in vivo imaging. We hypothesize that in both cases, OA cartilage will have a higher mean attenuation compared to cartilage of controls.
Methods
Micro–Computed Tomography Imaging
To investigate the feasibility of detecting cartilage degeneration in a mouse model with established OA at high resolution, the STR/ort mouse line was used, which spontaneously develops OA early in life with disease characteristics similar to those of humans. The tibiae of eight 3-, 4-, 7-, and 10-month-old male STR/ort and CBA/1 (healthy control) mice were imaged. Cartilage of these samples has been characterized previously using confocal microscopy, where volume, thickness, surface-to-volume ratio, and Collins score were reported. 10 In this study, the tibiae were soaked in 40% Hexabrix320 in PBS (Mallinckrodt) for 15 minutes and imaged with synchrotron-radiation micro–computed tomography (SR-microCT; TOMCAT, Swiss Light Source, Paul Scherrer Institute, Switzerland) at 3 μm, 50 ms, 17.5 kV, and 400 mA without control of flux by non-blinded researchers.
To test the feasibility of detecting changes in mean cartilage attenuation in situ in an OA mouse model using image acquisition parameters suitable for in vivo imaging, 24 weight-matched male C57Bl/6 mice underwent destabilization of medial meniscus (DMM) or sham surgery in the right hind limb under isoflurane anesthesia at 10 to 12 weeks of age. Eight DMM mice were euthanized immediately following surgery, and 10 DMM and 6 sham mice were euthanized at 4 weeks post-surgery. Following sacrifice by CO2 inhalation, all mice received a 7-μl intra-articular injection of 57% Dotarem in PBS (Guerbet) in the knee that had undergone DMM or sham surgery and were imaged in situ using microCT (vivaCT80, Scanco Medical AG, Switzerland) at 10.4 μm, 200 ms, 70 kVp, and 114 μA by non-blinded researchers.
Attenuation Analysis
Reconstructed data were filtered using a constrained 3D Gauss filter (SR-microCT: σ = 1.2, s = 1; microCT: σ = 2.5, s = 2). Volumes of interest (SR-microCT: Ø 25 pixel, 10 slices,
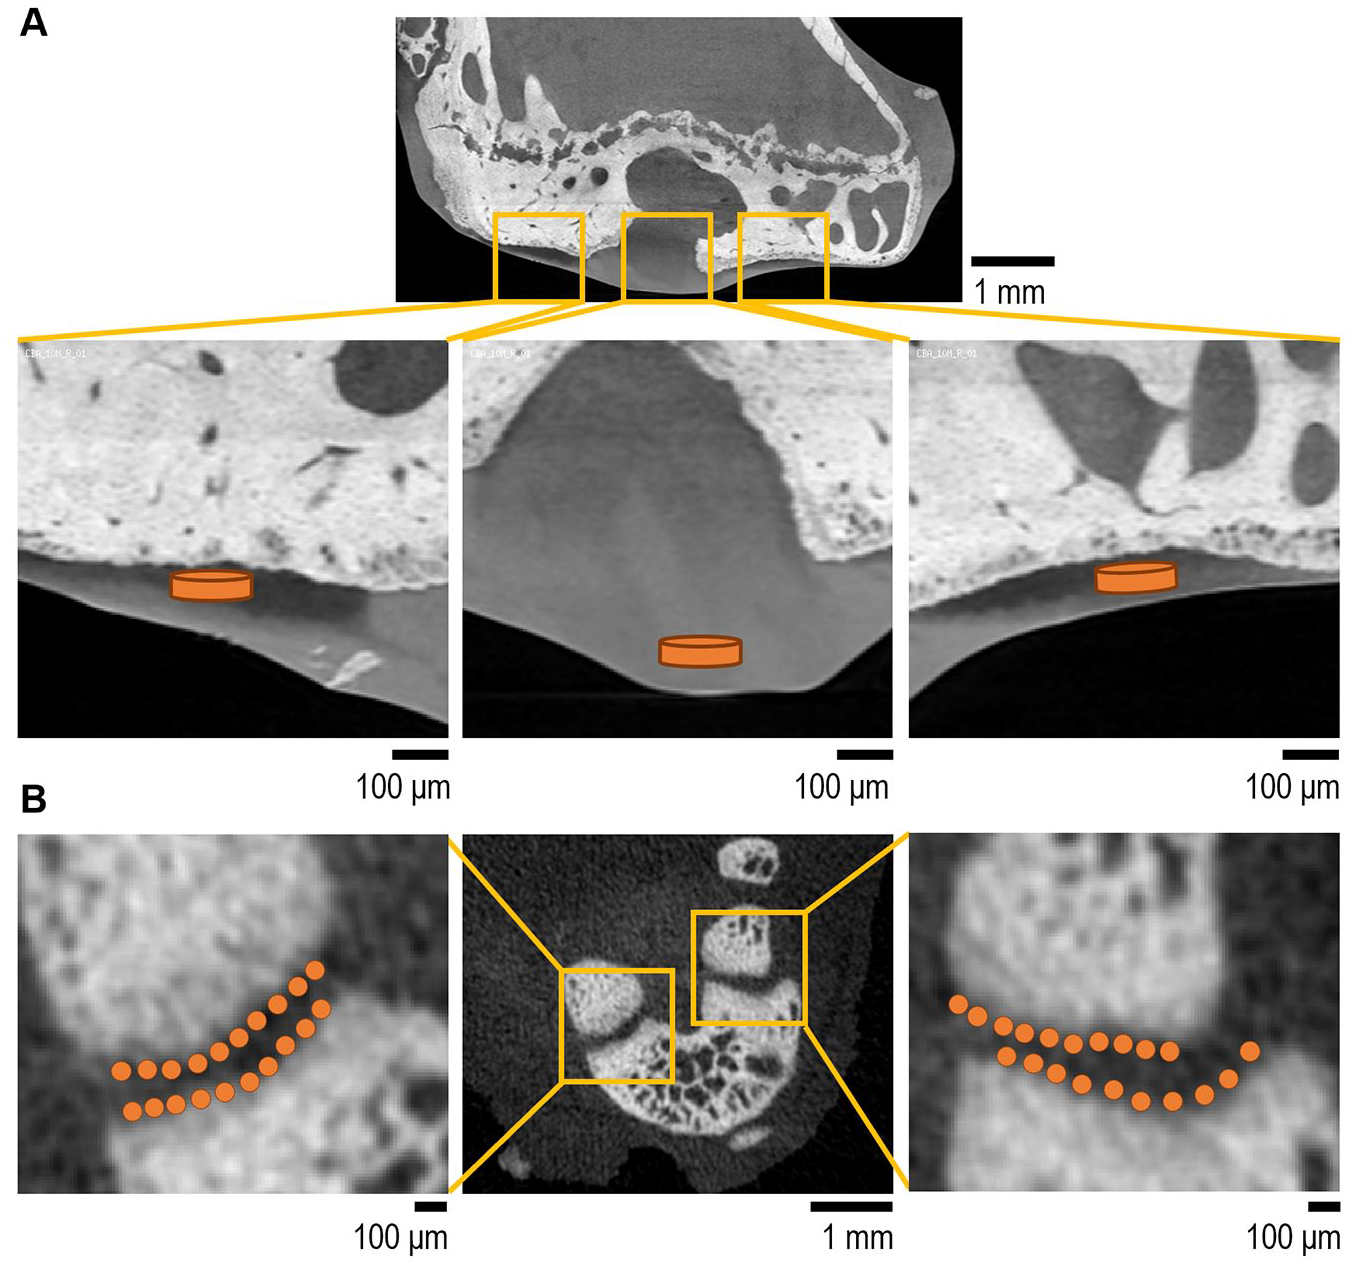
Visualization of volumes of interest chosen in weightbearing area of cartilage for attenuation analysis in (A) high-resolution synchrotron-radiation microCT (SR-microCT) and (B) in vivo compatible microCT images. Due to microCT images being acquired with in vivo compatible parameters, voxel size is larger than that of SR-microCT. Therefore, multiple small volumes of interest along the cartilage area were chosen to analyze the same number of voxels in microCT as in SR-microCT images.
Histology
The hind limb knee joints of the C57Bl/6 mice were excised, fixed in neutral buffered formalin (AMBER Scientific) for 24 hours, decalcified in 20% ethylenediamine tetraacetic acid (chem-supply) for 7 days, processed, and embedded in paraffin. Four micrometer sections were cut and stained with Safranin-O/fast green. OA was graded using the Osteoarthritis Research Society International (OARSI) score by 2 non-blinded researchers. 11
Statistical Analysis
All data were tested for normality using the Shapiro-Wilk test and Q-Q plot. The normality of all residuals was tested using the Shapiro-f impact Wilk test, Q-Q plot, and residuals plot. Mean attenuation and mean Δ attenuation of cartilage in STR/ort mice assessed by SR-microCT was normally distributed. The effect of the development of OA and age on mean attenuation and mean Δ attenuation of cartilage in STR/ort mice assessed by SR-microCT was compared to sham controls by 2-way analysis of variance (ANOVA) with specific differences identified by Tukey’s multiple comparisons test. One data point of OA cartilage on the medial side is missing due to the lack of cartilage left in that sample. To test the correlation between SR-microCT mean attenuation/mean Δ attenuation and previously published cartilage volume, surface-to-volume ratio, thickness, and Collins score, 10 a Pearson test for normally distributed data (medial cartilage volume and thickness, lateral cartilage volume, thickness, and surface-to-volume ratio) or Spearman’s test for non-normal data (medial cartilage surface-to-volume ratio and Collins score, lateral Collins score) was used. On the medial side, 1 data point of each cartilage volume, thickness, surface-to-volume ratio, and Collins score is missing, due to image acquisition issues. Cartilage mean attenuation in the DMM OA model, sham, and healthy control as assessed by microCT was normally distributed. The effect of OA in the DMM OA model on mean attenuation of cartilage assessed by microCT was compared to sham and healthy controls by 1-way ANOVA with specific differences identified by Tukey’s multiple comparison. OARSI scores of the DMM OA model, sham, and healthy control were non-normally distributed. The effect of OA on the OARSI score was compared to sham and healthy control by the Kruskal-Wallis test, and specific differences were identified by Dunn’s multiple comparison. To assess the correlation between microCT mean attenuation and OARSI scores, a Spearman test was used. The OARSI scores for 1 sample are missing due to paraffin-processing issues. All tests were done using GraphPad Prism 10.3.1 for Windows. A value of P < 0.05 was considered significant.
Results
High-Resolution Synchrotron-Radiation Micro–Computed Tomography Images
Mean attenuation of OA and healthy cartilage was unaffected in STR/ort mice and CBA/1 controls, respectively, at any age on the medial side with the exception of 4 months of age, where mean attenuation was lower in STR/ort OA mice
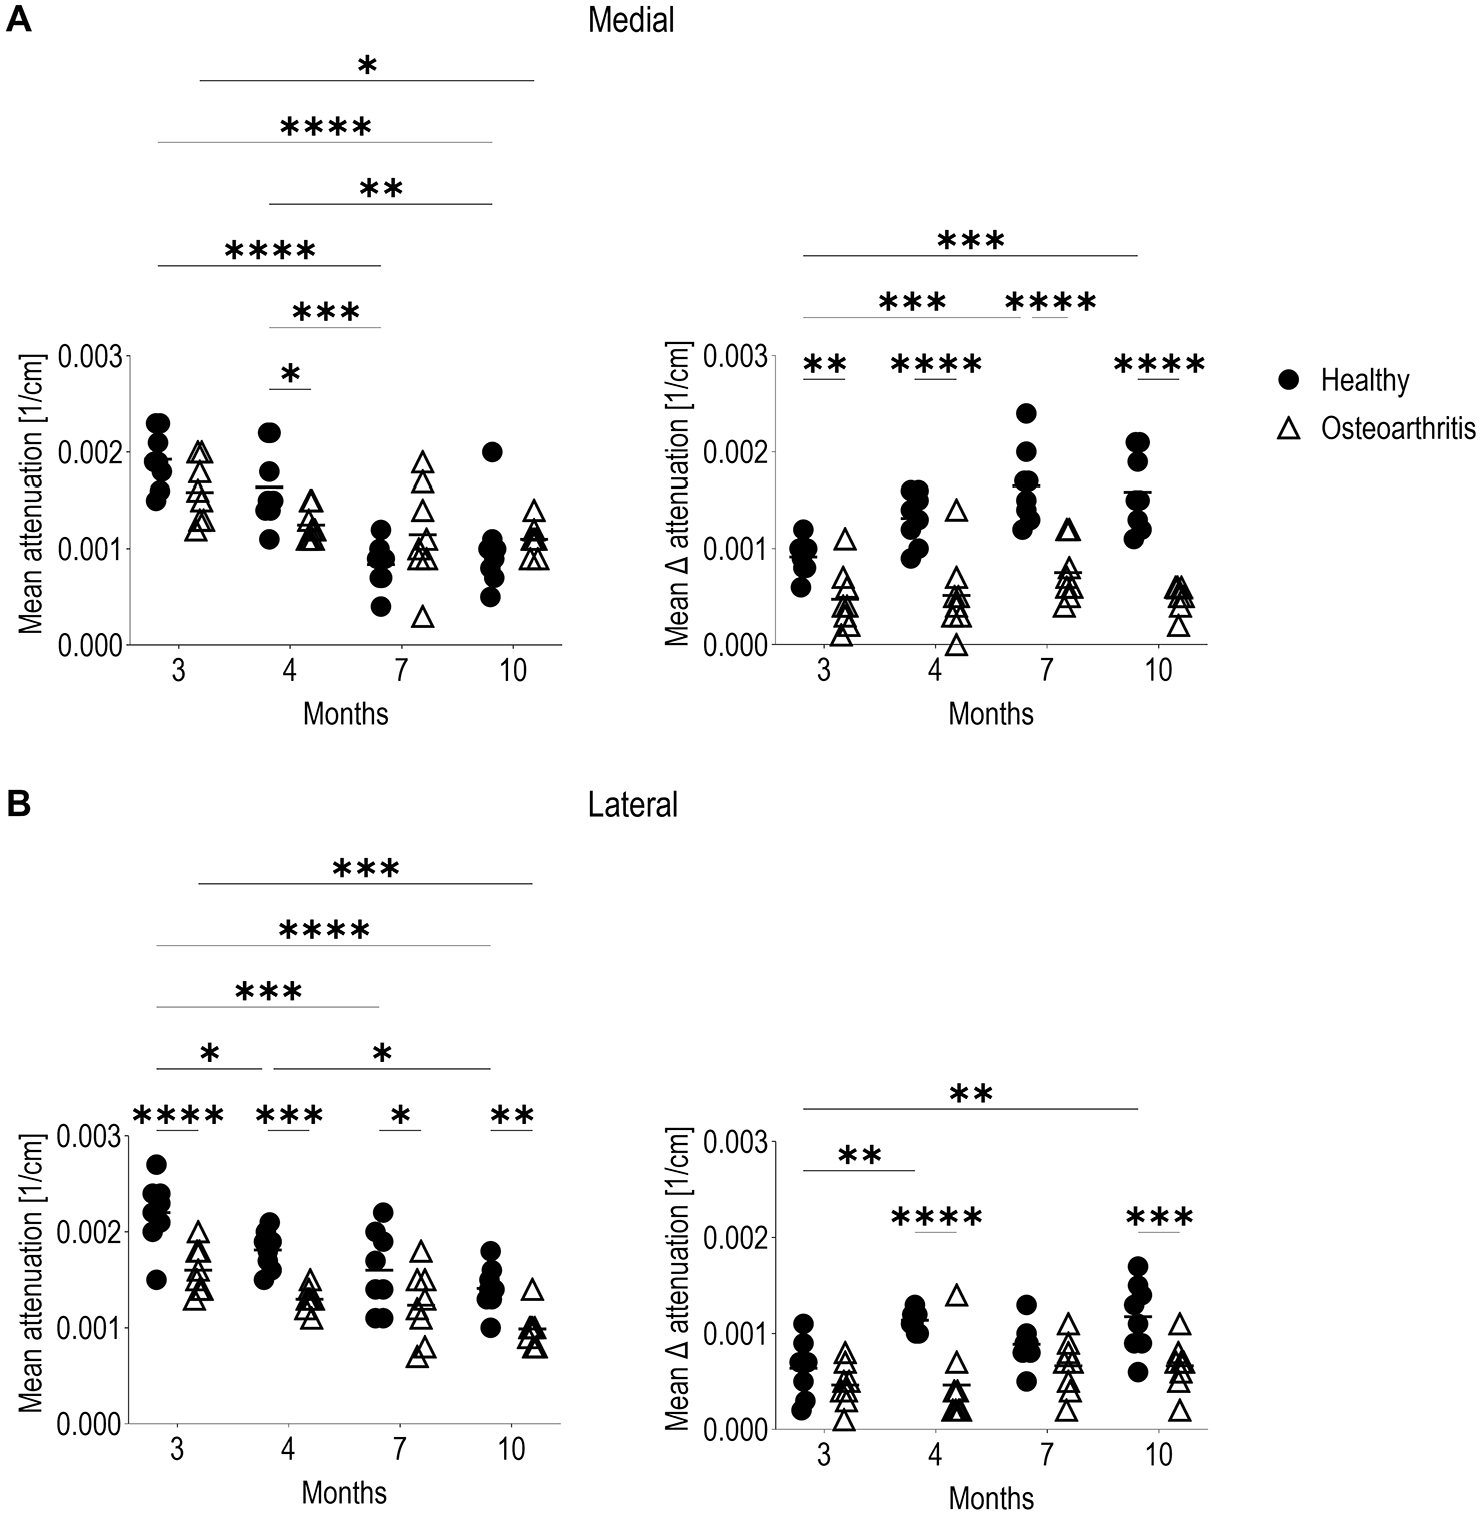
(A) Medial mean attenuation (left) and mean Δ attenuation (right) and (B) lateral mean attenuation (left) and mean Δ attenuation (right) of cartilage in the weightbearing area of the tibial plateau in healthy CBA/1 (n = 8) and STR/ort OA (n = 8) mice [P < 0.05, 0.0332 (*), 0.0021 (**), 0.0002 (***), <0.0001 (****)]. Line represents the mean. Mean Δ attenuation, where flux is controlled, is lower in STR/ort OA cartilage compared to healthy CBA/1 controls on the medial side at all ages and on the lateral side at 4 and 10 months.
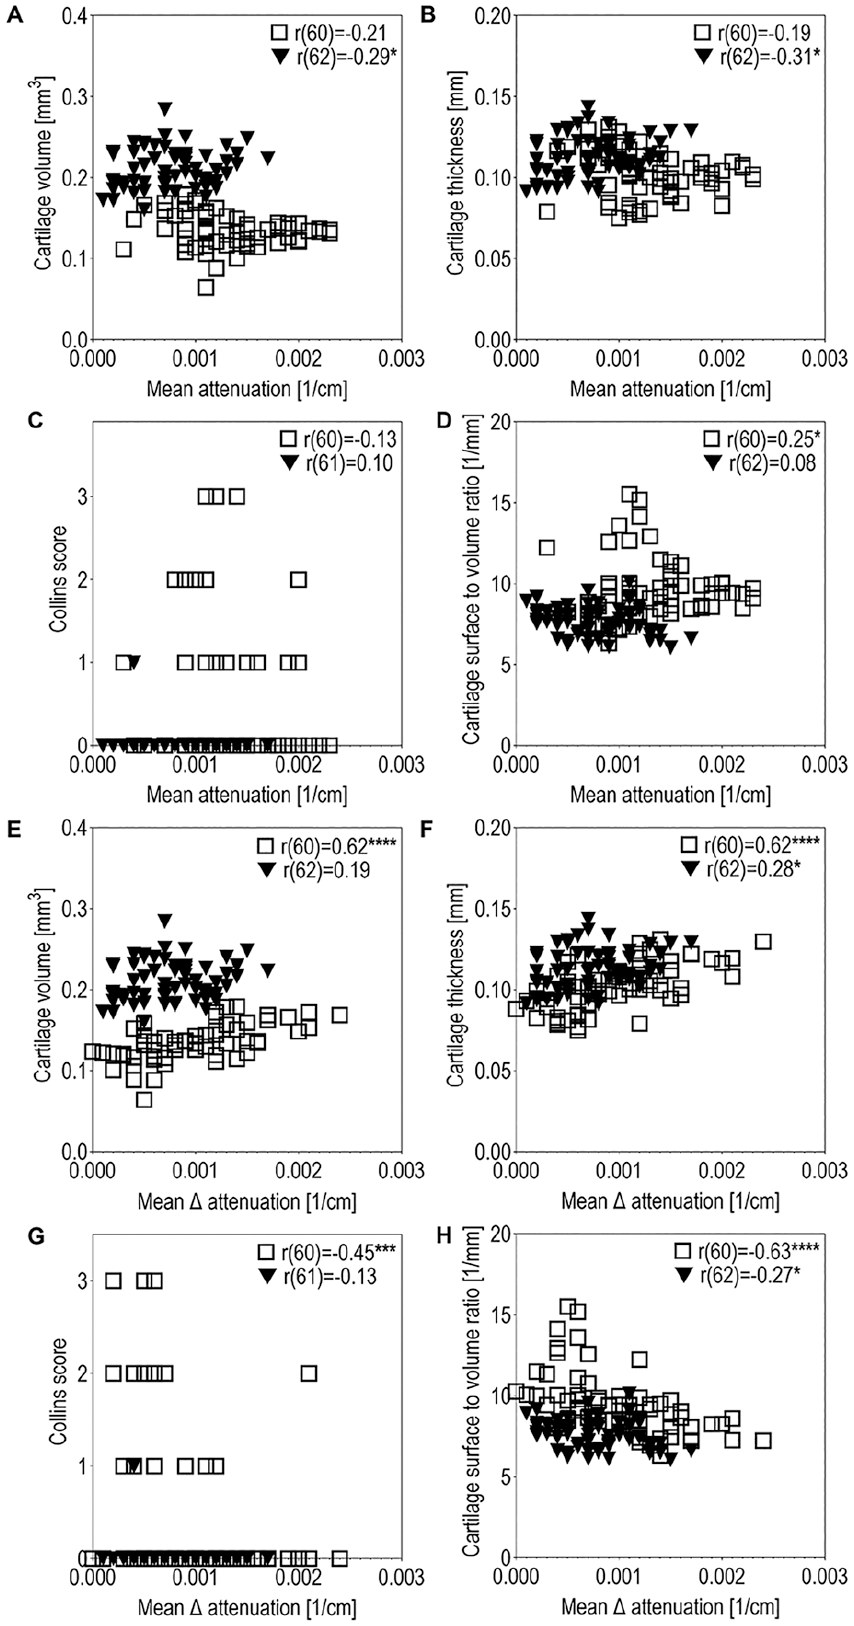
Correlation between mean attenuation and (A) cartilage volume, (B) cartilage thickness, (C), Collins score, and (D) cartilage surface-to-volume ratio on the medial and lateral side as well as correlation between mean Δ attenuation and (E) cartilage volume, (F) cartilage thickness, (G) Collins score, and (H) cartilage surface-to-volume ratio [P < 0.05, 0.0332 (*), 0.0021 (**), 0.0002 (***), < 0.0001 (****)]. Correlation between medial mean attenuation and medial cartilage volume and thickness as well as lateral mean attenuation and lateral cartilage volume, thickness, and surface-to-volume ratio was tested by Pearson’s test. Correlation between medial mean attenuation and medial cartilage surface-to-volume ratio and Collins score as well as lateral mean attenuation and lateral Collins score was tested by Spearman’s test. Correlation between medial mean Δ attenuation and medial cartilage volume and thickness as well as lateral mean Δ attenuation and lateral cartilage volume, thickness and surface-to-volume ratio was tested by Pearson’s correlation. Correlation between medial mean Δ attenuation and medial cartilage surface-to-volume ratio and Collins score as well as lateral mean Δ attenuation and lateral Collins score was tested by Spearman’s correlation.
Effect Size and 95% Confidence Interval (CI) of Correlation Between Mean Attenuation/Mean Δ Attenuation and Cartilage Volume, Thickness, Collins Score, and Cartilage Surface-To-Volume Ratio on the Medial and Lateral Side.

In Vivo Compatible Micro–Computed Tomography Images
The mean attenuation of cartilage in the DMM OA group was higher than in age-matched sham controls on the medial side of the tibia at 4 weeks post-surgery
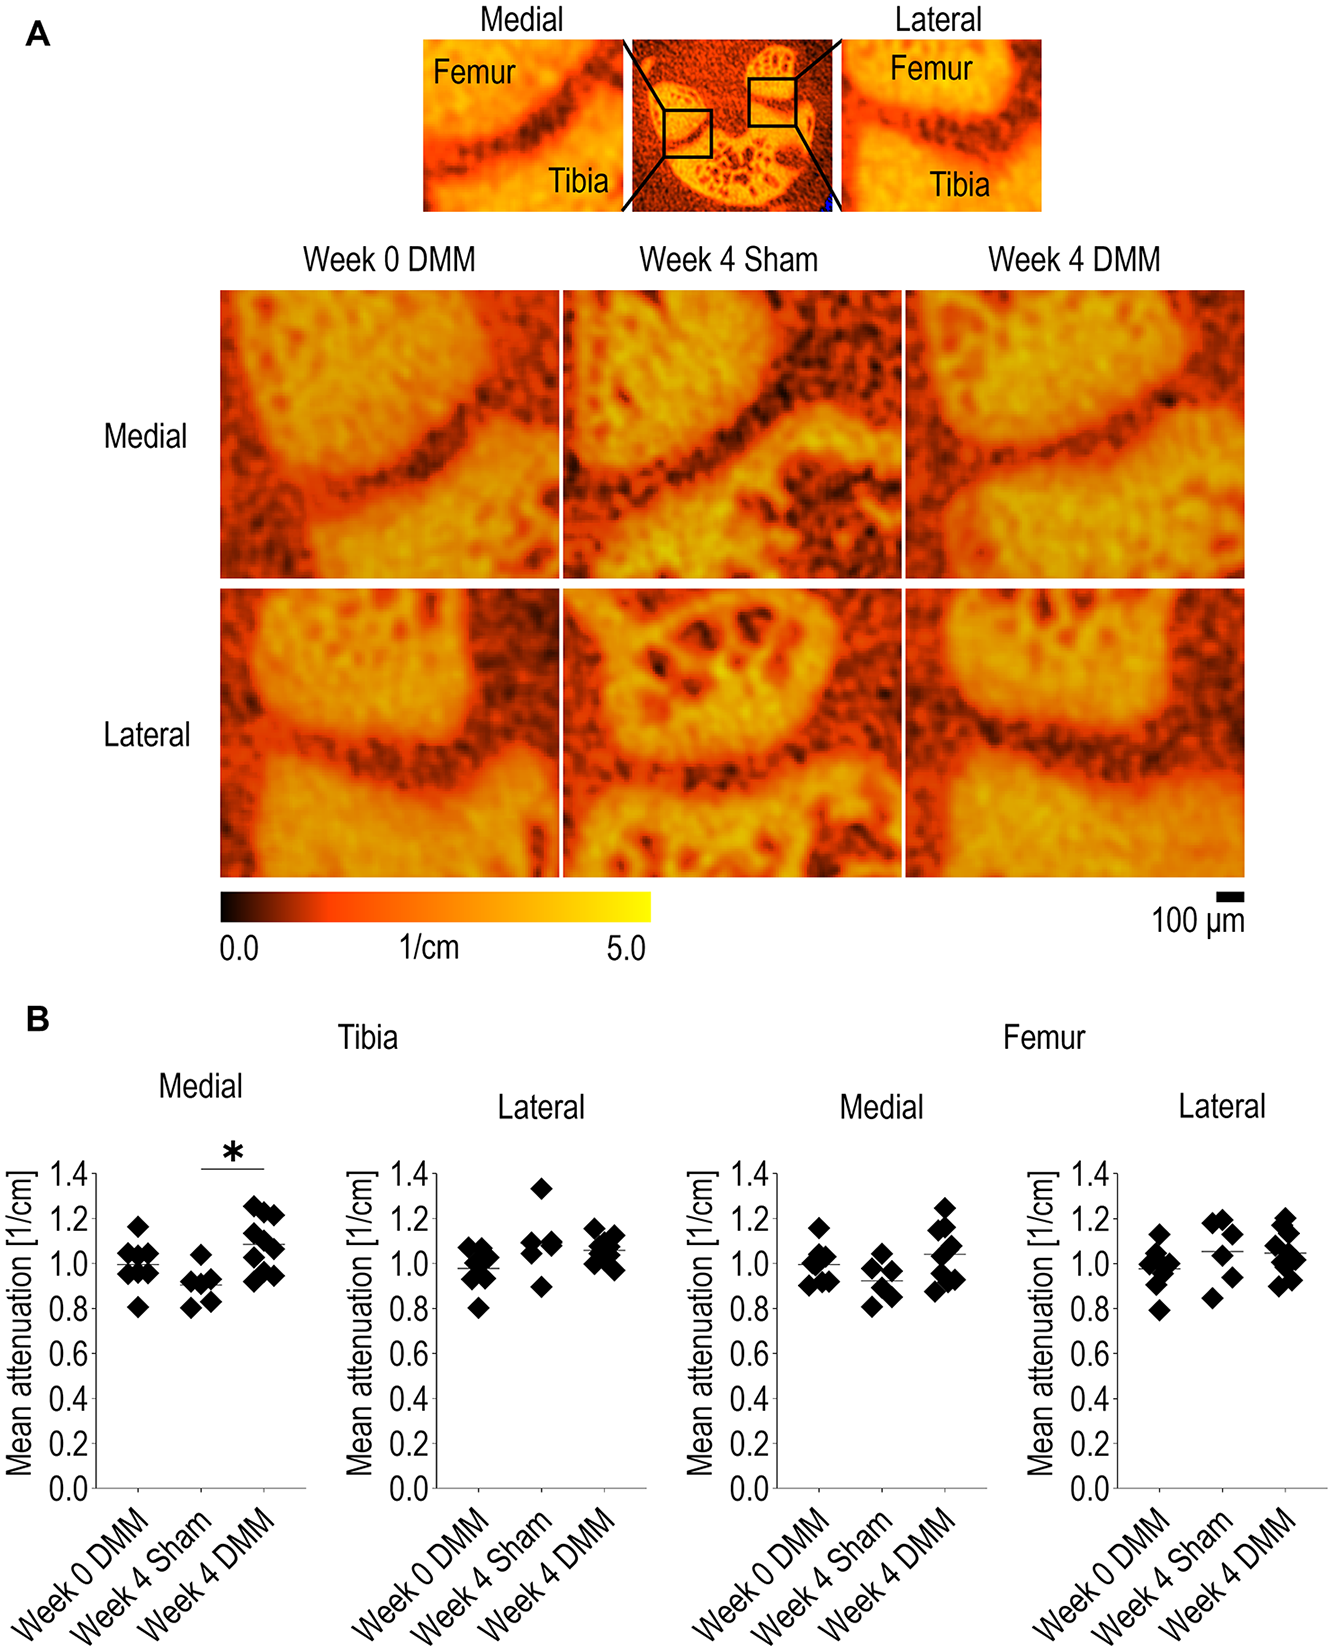
(A) Representative microCT and images and (B) mean cartilage attenuation of lateral and medial side of knee joint in DMM mice at 0 and 4 weeks post-surgery and Sham mice at 4 weeks post-surgery [P < 0.05, 0.0332 (*), 0.0021 (**), 0.0002 (***), <0.0001 (****)]. Line represents the mean. Mean cartilage attenuation of DMM OA mice was higher than age-matched sham controls in the medial tibia at 4 weeks post-surgery.
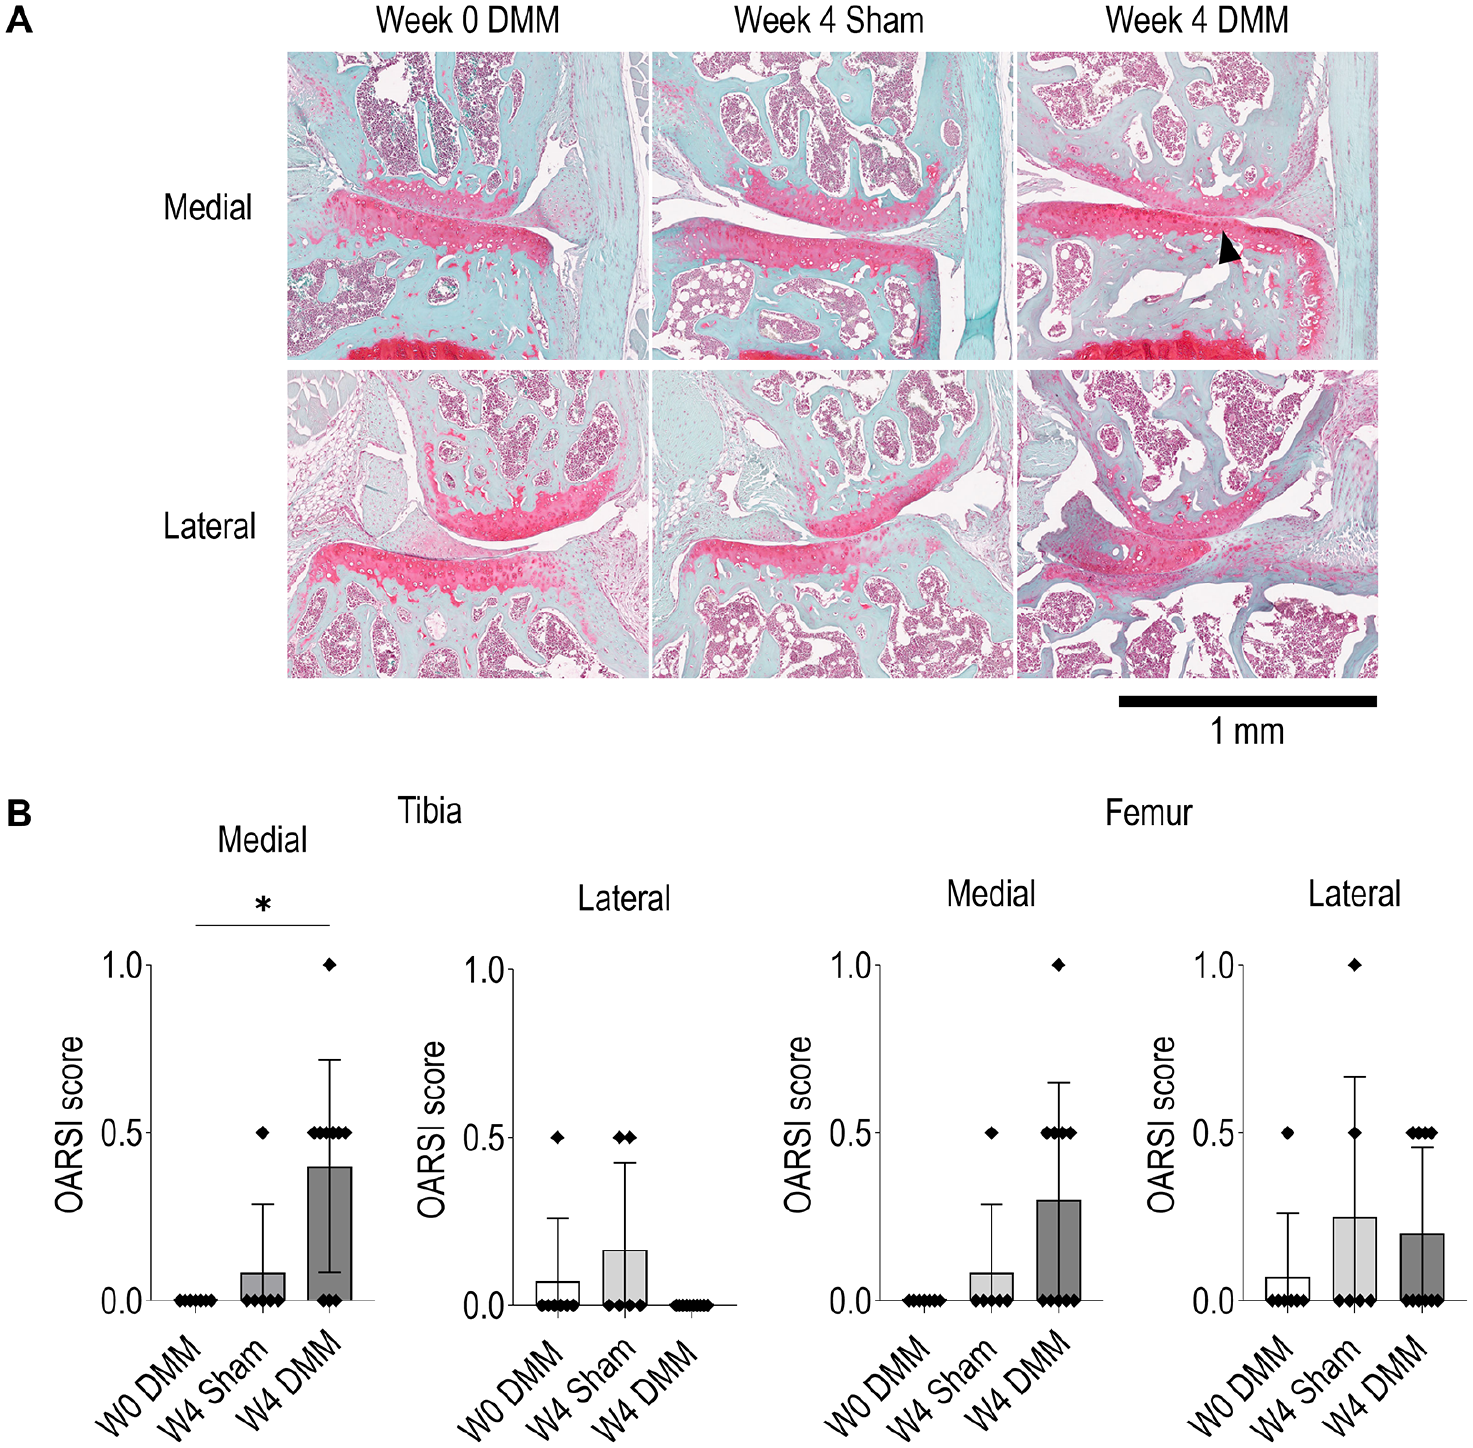
(A) Representative histology images and (B) OARSI scores of lateral and medial side of knee joint in DMM mice at 0 and 4 weeks post-surgery and sham mice at 4 weeks post-surgery [P < 0.05, 0.0332 (*), 0.0021 (**), 0.0002 (***), <0.0001 (****)]. Arrow indicates the GAG loss. Columns represent the mean value, and error bars represent the standard deviation. Mean OARSI score of cartilage in DMM OA mice was higher than in sham controls at 4 weeks post-surgery and DMM mice at 0 weeks post-surgery.
Discussion
In this study, we aimed to investigate the feasibility of using mean attenuation as a parameter for quantifying cartilage degeneration, with the ultimate goal of translating it from an ex vivo to an in vivo application in a pre-clinical OA mouse model. First, we investigated the feasibility of detecting cartilage degeneration in the established STR/ort mouse model of OA with mean cartilage attenuation in high-resolution CECT images of cartilage against contrast agent. Second, we tested the feasibility of detecting changes in mean cartilage attenuation in situ in a DMM OA mouse model using image acquisition parameters that are suitable for longitudinal in vivo imaging.
The mean cartilage attenuation obtained using high-resolution SR-microCT images was lower in STR/ort OA mice compared to healthy CBA/1 controls on the lateral side, while no difference was observed on the medial side. Furthermore, mean attenuation did not correlate with any other cartilage parameters previously published on the medial side. 10 However, based on previous studies, the mean attenuation of cartilage obtained using the negatively charged contrast agent and CECT imaging in the current study were predicted to increase with increasing cartilage degeneration with the progression of OA.1,4,5 In addition, mean cartilage attenuation of cartilage in OA mice was expected to be higher than that of healthy controls, particularly on the medial side. 10 The discrepancy in the effect of OA on mean attenuation of cartilage in the current study compared to previous studies may be attributed to a change in flux during SR image acquisition, leading to variances in the overall brightness of images. To control for flux, the mean attenuation difference between cartilage and contrast agent was calculated. As OA progresses and the mean attenuation of cartilage increases, the difference between cartilage and contrast agent attenuation is expected to decrease,1,4 while in contrast, the mean attenuation of healthy cartilage is not expected to increase, as there is no reduction in GAG content. We therefore hypothesized that OA cartilage would have a smaller attenuation difference compared to the contrast agent than healthy cartilage. Consistent with this notion and in agreement with previous findings, mean attenuation difference was lower in STR/ort OA mice compared to healthy CBA/1 control mice on the medial side. 10 Furthermore, mean attenuation difference correlates with previously published cartilage volume, thickness, surface-to-volume ratio, and Collins score. 10 Lower mean attenuation difference, indicative of GAG loss, was associated with higher Collins scores indicative of cartilage degeneration. Furthermore, it was associated with increased cartilage surface-to-volume ratio as well as decreased cartilage volume and cartilage thickness, all of which align with a loss of cartilage. These findings are consistent with others showing cartilage changes as early as 2.5 to 5 months of age in the medial tibial plateau of STR/ort OA mice, whereas the lateral side rarely appears to be affected.12-15 Provided flux is controlled, mean attenuation of cartilage may be a valuable parameter for the in vivo assessment of cartilage degeneration in an OA mouse model using SR-microCT imaging with contrast agent as background.
In the second part of the study, the limited volume of contrast agent injected into the knee joint and acquisition parameters used to ensure that the method could be translated in vivo for cartilage degeneration in the future resulted in a decrease in resolution of the images. As a result, cartilage could not be segmented from contrast agent in the joint space, and structural parameters such as thickness or volume could not be measured. In addition, beam hardening artifacts impacted identification of the bone-cartilage border. To overcome this limitation, cartilage volumes of interest (based on images of joints injected with silicone, resulting in a negative image of cartilage, acquired with the same in vivo compatible acquisition parameters) were manually drawn, allowing the mean attenuation of cartilage to be determined. While changing flux can be an issue in SR-microCT if not controlled, this is not the case for in vivo compatible microCT. Therefore, mean attenuation of cartilage calculated in microCT images was not corrected for flux. On the medial side, mean cartilage attenuation was higher in DMM OA mice compared to sham mice at week 4 post-surgery. This is also reflected in mean OARSI scores, where DMM OA mice scored higher and showed more degenerative changes compared to sham mice at 4 weeks post-surgery. The positive correlation between mean attenuation and OARSI scores in the medial tibia further supports these results. This may be indicative of early OA changes taking place during the first 4 weeks post-surgery, as seen in other studies,16-19 preventing the increase in GAG content seen in healthy mice to occur in OA mice. David et al 16 and Fang et al 17 reported regional proteoglycan loss evident from 1 to 2 weeks post-surgery, particularly in the medial tibial plateau. The lack of difference in mean attenuation on the lateral side was expected, as the DMM OA model is known to mainly affect the medial side of the joint,16-19 which is further supported by the absence of any change in OARSI score on the lateral side in the present study. The effect of OA on mean attenuation observed in this study is lower than that measured with OARSI scores using histology in other studies, although comparable group sizes were chosen.17,20,21 This may suggest that in vivo CECT is less sensitive to OA changes in cartilage. However, the effect of OA on OARSI scores in this study was also lower than observed in other studies,17,20,21 implying that there was overall less cartilage degeneration compared to other studies, hence a reduced effect of OA on mean attenuation would be expected.
Limitations to the current study include the lack of a healthy control at week 0, as all mice at 0 weeks post-surgery had undergone DMM surgery. Future studies should include healthy controls that did not undergo any surgery to provide a baseline for comparison. A further limitation is the limited cartilage volume included in the analysis. Volumes of interest, although placed in areas of interest, may not capture changes in other areas of cartilage. Future studies should aim to include the entire cartilage volume, which may reveal local changes not depicted in this study.
Conclusion
In conclusion, we have developed and validated a novel method for assessing cartilage degeneration in vivo by determining mean attenuation of cartilage against contrast agent background using CECT. We showed that mean attenuation of cartilage is indicative of cartilage degeneration in both the STR/ort and DMM mouse models of OA when imaged against a contrast agent background with SR-microCT as well as in situ with conditions that are suitable for in vivo analysis. As such, determining the mean attenuation of cartilage has great potential to be translated to in vivo applications for the investigation of cartilage changes in OA mouse models. Future studies will focus on investigating the early OA changes in cartilage, which are still poorly characterized in vivo.
Footnotes
Acknowledgments and Funding
The authors thank the TOMCAT beamline staff, Swiss Light Source, Paul Scherrer Institute; the Animal Facility staff, University of Melbourne; and the Melbourne Histology Platform, University of Melbourne for their technical assistance with this work. The authors also thank Professor Christopher Little, University of Sydney for providing DMM surgery training and scanning the histology slides and Cynthia Louis, PhD, Inflammation Division, Walter + Eliza Hall Institute of Medical Research for providing training in intra-articular injection protocol. This project has received funding from the Australian Research Council Discovery program (DP180101838), FWO and F.R.S.-FNRS under the Excellence of Science (EOS) program (EOS No. 40007553), European Union Shared-Cost RTD Action (QLK3-CT-2002-02039), and KU Leuven—University of Melbourne International Research Training grant, and beamtime from the Paul Scherrer Institute (20100842, 20110247).
Author Contributions
Jemima E Schadow: Study design, data collection, analysis and interpretation, and original draft.
Emma C Boersma: Data collection, analysis, and critical revision.
Rachel A Davey: Supervision, data interpretation, and critical revision.
Kathryn S Stok: Supervision, data interpretation, critical revision, and resource provision.
Declaration of Conflicting Interests
The author(s) declared no potential conflicts of interest with respect to the research, authorship, and/or publication of this article.
Ethical Approval
All protocols were approved by The University of Melbourne animal ethics committee (#24339) and were conducted in compliance with the Australian code for the care and use of animals for scientific purposes.
Data Availability
The data sets generated during and/or analyzed during the current study are available from the corresponding author on reasonable request.