
Abstract
Objective
To assess whether change of semiquantitatively magnetic resonance imaging (MRI)-defined bone marrow lesions (BMLs) and inflammatory markers is associated with change in quantitatively-assessed cartilage loss in the femorotibial joint (FTJ) in knees with radiographic osteoarthritis (OA) over 24 months.
Design
Participants were included from the IMI-APPROACH and the Osteoarthritis Initiative FNIH studies. Semiquantitative MRI assessment was performed for BMLs, Hoffa- and effusion-synovitis. Quantitative cartilage thickness measurements were performed manually. Definitions of change included number of subregions with BMLs, change in sum and change in maximum increase in size. Change in Hoffa-synovitis and effusion-synovitis was categorized in addition. Between-group comparisons regarding cartilage loss in the FTJ, medial and lateral compartments were performed using analysis of variance (ANOVA).
Results
A total of 629 participants were included. Knees without any BMLs at baseline (BL) and follow-up (FU) had significantly less cartilage loss compared to the other subgroups. Change in both directions in the sum score of BMLs was associated with increased rates of cartilage loss. Maximum increase in size of BMLs was associated with increased rates of cartilage loss (FTJ increase by 2 grades −0.183 mm, 95% CI [−0.335, −0.031], by 3 grades −0.306 mm, [−0.511, −0.101]). Worsening of Hoffa-synovitis was associated with increased rates of cartilage loss.
Conclusion
Knees without BMLs at BL and FU showed lowest rates of cartilage loss. Knees with an increase in BML size showed increased rates of concurrent cartilage loss. Approaches with the aim to inhibit BML development, avoidance of increase in size and avoidance of Hoffa-synovitis worsening may have beneficial effects on cartilage loss.
Introduction
Several joint tissues are involved in the onset and progression of knee osteoarthritis (OA) and may exhibit pathological changes, resulting in many potential structural targets for treatment. 1 Consequently, it is unlikely that a single treatment for OA will be similarly efficacious in preventing or delaying the progression of all types of structural OA. 2 Furthermore, it has been suggested that OA is a syndrome comprised of multiple distinct phenotypes rather than a single disease.3,4 Three main structural phenotypes of OA have been proposed – an inflammatory phenotype, a subchondral bone phenotype and a meniscal or cartilage-meniscus phenotype, 5 but overlap between these phenotypes is commonly observed. 6 It has been shown that the bone phenotype is associated with an increased risk of both radiographic and pain progression. 6 Subchondral bone marrow lesions (BMLs) and inflammatory markers of disease (Hoffa- and effusion-synovitis), the hallmark features of the subchondral bone and inflammatory phenotype, show fluctuation and possible resolution over time.7-9 Furthermore, symptom fluctuation has been linked to concomitant fluctuation of these structural parameters in the same direction. 10 As a consequence, the subchondral bone and inflammatory structural manifestations of the disease have been identified as treatment targets of particular interest in the context of disease-modifying OA drug (DMOAD) development. 2 Ideally, individuals should be included in clinical DMOAD trials based on the specific mode of action of a given pharmacological compound. 11 The efficacy of the compound under study will then be defined based on predetermined clinical and structural outcomes.
Regulatory guidelines outline a framework for drug approval of specific OA indications, encompassing symptom management, retardation of structural progression, and disease prevention. 12 Despite significant advances in 3D imaging, especially magnetic resonance imaging (MRI), radiographically assessed loss of joint space width remains the recommended structural outcome for demonstrating the effectiveness of DMOADs in phase III clinical trials, according to regulatory agencies like the U.S. Food and Drug Administration (FDA). A recent draft guidance amendment states that “an effect on the candidate structural endpoint will reliably predict an effect on the clinical outcomes of interest” without specifying imaging modalities. 13 However, MRI has been shown to be more sensitive and particularly more specific than radiography to evaluate OA structural progression and potential treatment effects. 14 MRI-assessed 3D quantification of cartilage has been used as the primary endpoint in at least 2 phase III trials of knee OA.15,16
Based on the Foundation for the National Institutes of Health (FNIH) consortium sample nested within the larger Osteoarthritis Initiative (OAI) study, we recently reported that the presence of baseline semiquantitatively defined MRI features, including BMLs, makes it possible to specifically select progressor knees suitable for inclusion in clinical trials. 17 In another analysis based on the same sample, we could show that worsening of semiquantitatively assessed cartilage damage, meniscal extrusion and damage, number of subregions affected by BMLs, maximum size of BMLs and worsening of effusion- and/or Hoffa-synovitis is associated with increased quantitative cartilage loss over 24 months, reflecting the multitissue involvement of knee OA. 18 However, that study did not include assessment of improvement in MRI features and did not particularly focus on a clinical trial–relevant subsample, that is, those knees exhibiting radiographic OA Kellgren–Lawrence (KL) grades 2 and 3. Whether change of BMLs and inflammatory markers of disease over time, and particularly their improvement, is associated with positive effects on quantitative cartilage parameters longitudinally, considered the primary structural outcome measure in clinical trials, is unknown.
Thus, the aim of our study was to assess whether worsening and improvement of BMLs and MRI-defined signs of inflammation – using different definitions – is associated with concurrent increased or decreased rates of femorotibial and ipsicompartmental cartilage loss over 24 months when compared to those compartments without these features at baseline and follow-up or without change in these features. In order to maximize sample size, we used a study sample comprised of 2 cohorts largely representing a simulated clinical trial population, that is, patients with knee OA KL grades 2 and 3.
Methods
OAI/FNIH Sample
The OAI is a multicenter prospective observational cohort study of knee OA that enrolled 4,796 participants aged 45 to 79 years at 4 clinical centers (https://nda.nih.gov/oai). Clinical data, MRI scans, radiographs, and serum and urine specimens were obtained at baseline, 12, 24, 36, 48, 72, and 96 months follow-up. 19 The FNIH Biomarker Consortium study sample, nested within the larger OAI, was defined by symptomatic and structural progression outcomes over 48 months. 20 Of the 600 participants from the OAI FNIH study, knees that had both semiquantitative assessments and quantitative cartilage thickness measurements at baseline and 24 months follow-up, and a baseline radiographic severity grade of KL 2 or 3 were included (n = 522).
The OAI (clinicaltrials.gov: NCT00080171; https://data-archive.nimh.nih.gov/oai/) was approved by the Committee on Human Research, the Institutional Review Board of the University of California, San Francisco (UCSF) and the institutional review boards of all clinical sites. All OAI participants provided written informed consent. This study was carried out in accordance with the OAI data user agreement and both the OAI and this study were performed in accordance with the ethical standards of the institutional research committees and with the 1964 Helsinki Declaration and its later amendments.
IMI-APPROACH Sample
The Innovative Medicines Initiative-Applied Public–Private Research enabling OsteoArthritis Clinical Headway study (IMI-APPROACH) is an observational, longitudinal study that enrolled 297 OA patients at 5 clinical centers in Europe (https://www.imi.europa.eu/projects-results/project-factsheets/approach). 21 The study participants were recruited from 5 existing observational OA cohorts or from outpatient departments, if not enough participants could be recruited from these existing cohorts. Recruitment from these cohorts relied on machine-learning models that were trained using data from the Cohort Hip and Cohort Knee (CHECK) study to predict either the probability of increased or sustained knee pain or the probability of structural progression over the next 2 years. 22 For each patient, an index knee was defined at the screening visit based on clinical knee OA criteria and pain. In case both knees were affected equally, the right knee was selected as the index knee. Demographic and clinical data, blood and urine samples, and imaging data were collected from the participants at enrollment and at the month 6, 12, and 24 follow-up visits.
IMI-APPROACH was conducted in compliance with the protocol, Good Clinical Practice (GCP), the Declaration of Helsinki, and the applicable ethical and legal regulatory requirements (for all countries involved), and is registered under clinicaltrials.gov identifier: NCT03883568. Of the total 297 IMI-APPROACH participants, knees that had both SQ assessments and quantitative cartilage thickness measurements at baseline and 24 months follow-up, and a baseline radiographic severity grade of KL 2 or 3 were included (n = 107).
MRI Acquisition
In FNIH, MRIs of both knees were acquired using 3 T systems (Siemens MAGNETOM Trio, Erlangen, Germany) at the 4 OAI clinical sites. The sequence protocol included a coronal intermediate-weighted 2-dimensional turbo spin echo sequence, a sagittal 3-dimensional (3D) dual-echo at steady state (DESS) sequence and a sagittal intermediate-weighted fat-suppressed turbo spin-echo sequence. 23 The 3D DESS MRIs were used for the quantitative cartilage analysis. 24
In IMI-APPROACH, MRI of the index knee was acquired at the 5 clinical centers with 2 of the centers using 1.5 T systems (A Coruña: Ingenia CX, Philips Medical Systems, Netherlands; Oslo: Aera, Siemens Healthcare, Germany), and the other centers using 3 T systems (Utrecht: Ingenia or Achieva, Philips Medical Systems, Netherlands; Leiden: Ingenia, Philips Medical Systems, Netherlands; Paris: Skyra, Siemens Healthcare, Germany). The clinical pulse sequence protocol included an axial, a sagittal, and a coronal intermediate-weighted fat-suppressed sequence and a T1-weighted coronal turbo spin echo sequence that were all used for semiquantitative evaluation. 25 In addition, a sagittal 3D spoiled gradient echo or volume-interpolated gradient echo sequence with selective water excitation or fat-suppression was acquired for the quantitative cartilage analysis. 26
MRI Assessment
In FNIH and IMI-APPROACH, either 2 musculoskeletal radiologists with 13 (F.W.R.) and 15 (A.G.) years’ experience with semiquantitative assessment of knee OA at the time of image assessment (FNIH), and one musculoskeletal radiologist (F.W.R.) with 17 years’ experience of semiquantitative assessment of knee OA at the time of reading (IMI-APPROACH), blinded to clinical data and case–control status, read the baseline and 24-month MRIs according to the Magnetic resonance imaging Osteoarthritis Knee Score (MOAKS) scoring system, 27 with knowledge of the chronological order of the scans. For this study only BMLs, Hoffa-synovitis, and effusion-synovitis were considered.9,25 BMLs were assessed in 10 femorotibial joint (FTJ) subregions, that is, 5 medial (anterior, central, and posterior medial tibia and central and posterior medial femur) and 5 lateral (anterior, central and posterior lateral tibia and central and posterior lateral femur) subregions. Longitudinal BML assessment included so-called within-grade evaluation, coding definite visual changes in size that do not fulfill the definition of a full-grade change. Within-grade assessment has been shown to be reliable, clinically valid and is associated with structural outcomes.18,28 While MOAKS assesses BMLs in 3 dimensions (size, % that is cystic vs. ill-defined, and number of BMLs per subregion), in this study, only size (scored from 0 to 3) was considered. Hoffa- and effusion-synovitis was assessed on a scale from 0 to 3. 27
Cartilage thickness analysis for this study relied on the sagittal DESS sequence in FNIH and the sagittal 3D spoiled gradient echo or volume-interpolated gradient echo sequence with selective water excitation or fat-suppression in IMI-APPROACH. Segmentation of the femorotibial cartilage plates, that is, medial and lateral tibia and weightbearing femur, was performed by 7 experienced readers. 26 The analysis center was blinded with regard to patient status and image acquisition order, so that an unbiased rate of change could be determined in each group. All segmentations were quality-controlled by 1 of 2 experts. This study focused on the mean cartilage thickness in the entire FTJ, the medial (MFTJ) and in the lateral FTJ (LFTJ), which were derived from the cartilage thickness measures observed in the respective cartilage plates (e.g., MFTJ = medial tibia + central medial femur). Quantitative cartilage thickness change was computed as an absolute difference between 24 months and baseline value (mm).
Statistical Analysis
Change in the overall number of subregions affected by any BML was defined as the difference between the number of subregions in the FTJ affected by any BML at 24 months and the number of subregions affected by any BML at baseline (

Change in bone marrow lesions—number of subregions. Coronal intermediate-weighted fat suppressed image (IMI-APPROACH study) shows a large (grade 3) bone marrow lesion (BML) at the central subregion of the lateral tibia (arrows). No additional BMLs are seen. (

Change in bone marrow lesions–increase in maximum grade. (

Change in Hoffa-synovitis. (

Change in effusion-synovitis. (
Results
Complete baseline and 24-month follow-up MRI data were available for 629 participants that were included. Regarding structural disease severity at baseline, 351 (55.8%) participants had KL2 and 278 (44.2%) KL3. Mean age was 62.6 (±8.8) years, and mean BMI was 30.5 (±5.0) kg/m2. For the entire FTJ, 164 (26.1%) knees showed improvement, 156 (24.8%) no change and 119 (18.9%) knees showed worsening regarding number of subregions with any BMLs. One hundred and ninety (30.2%) knees did not have any BMLs in the FTJ at baseline and at 24 months follow-up. For the MFTJ, these numbers were 140 (22.3%), 139 (22.1%), 103 (16.4%), and 247 (39.3%); for the LFTJ 39 (6.2%), 72 (11.4%), 30 (4.8%), and 490 (77.9%), respectively ( Table 1 ). Regarding the total sum score of BMLs for the entire FTJ, 99 (15.7%) knees showed improvement by 1, 47 (7.5%) by 2 and 32 (5.1%) by 3 or more, while 82 (13.0%) showed worsening by 1, 39 (6.2%) by 2 and 39 (6.2%) by 3 or more. Two hundred and ninety-two knees (46.4%) did not exhibit any change in BML sum ( Table 2 ). In knees with BMLs in the entire FTJ at baseline, 63 (10.0%) knees did not show any increase in BML size, 134 (21.3%) knees showed a maximum increase by 1 grade, 37 (5.9%) by 2 grades and 16 (2.5%) by 3 grades ( Table 4 ). Forty-seven knees showed at least one grade 3 BML in any of the FTJ subregions at 24-month follow-up while they did not show any grade 3 BML at baseline ( Table 5 ). Hoffa-synovitis improvement was observed in 18 (2.9%), with no change in 553 (87.9%) and worsening in 58 (9.2%) knees. Effusion-synovitis improvement was seen in 88 (14.0%), no change in 383 (60.9%) and worsening in 158 (25.1%) knees ( Table 6 ).
Change in Number of Subregions Affected by Any BMLs Over 24 Months and Concurrent Mean Change in Cartilage Thickness (in mm).
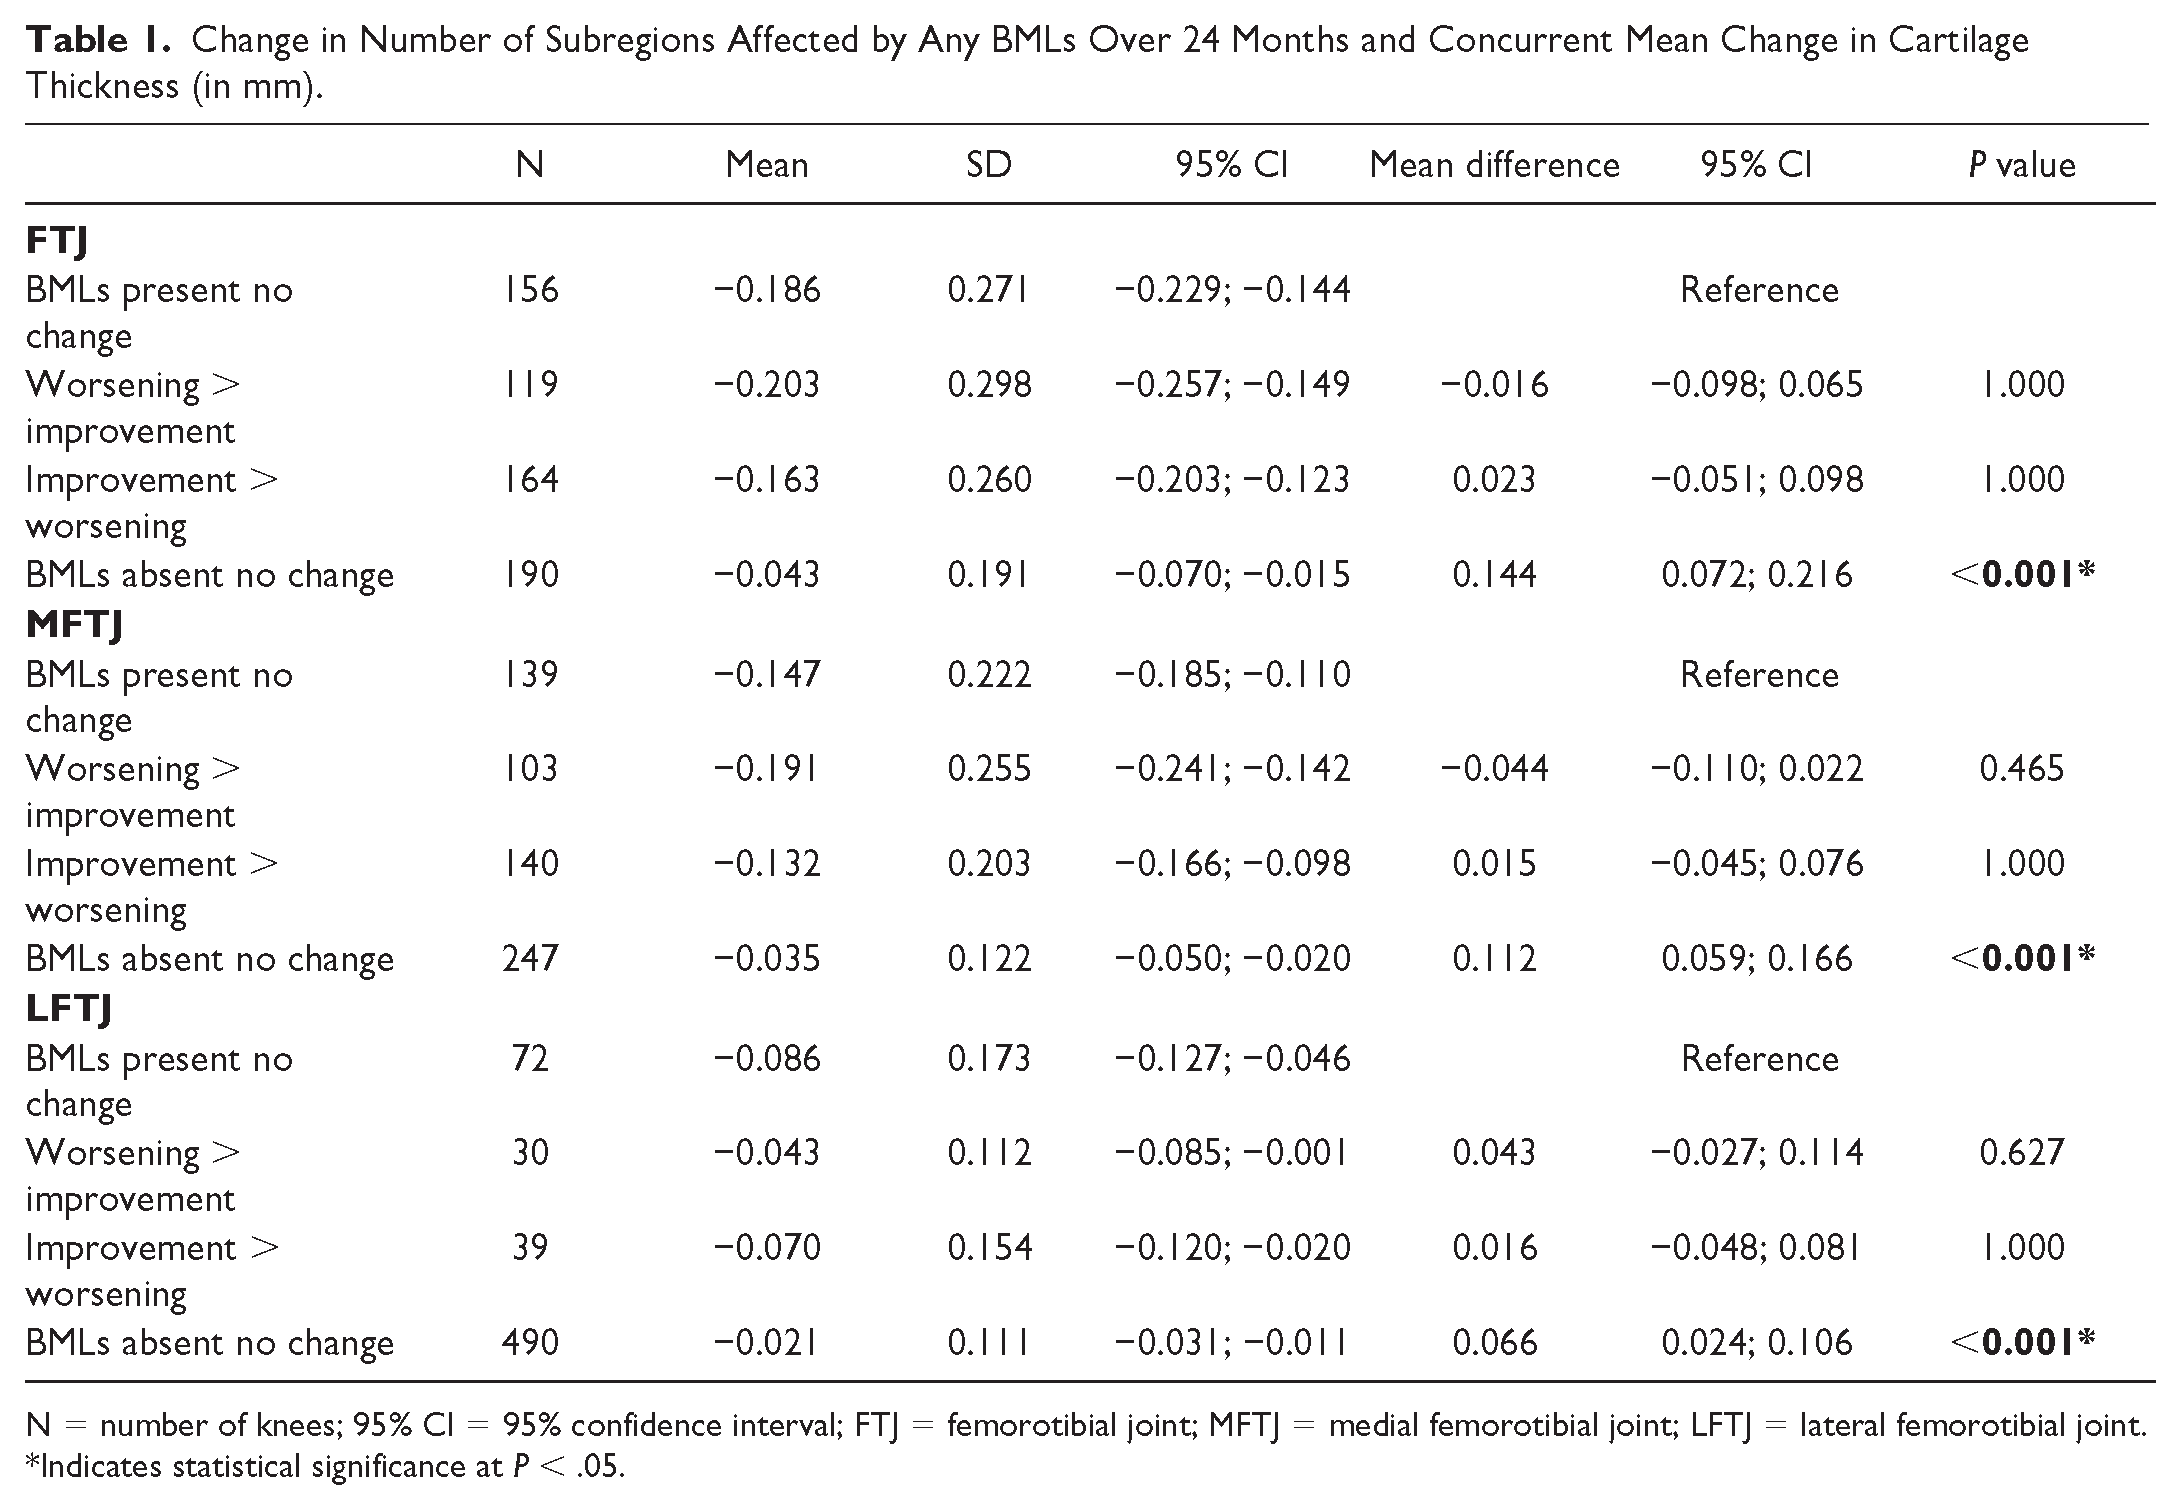
N = number of knees; 95% CI = 95% confidence interval; FTJ = femorotibial joint; MFTJ = medial femorotibial joint; LFTJ = lateral femorotibial joint.
Indicates statistical significance at P < .05.
Change in Summed BML Size and Concurrent Mean Change in Cartilage Thickness (in mm).
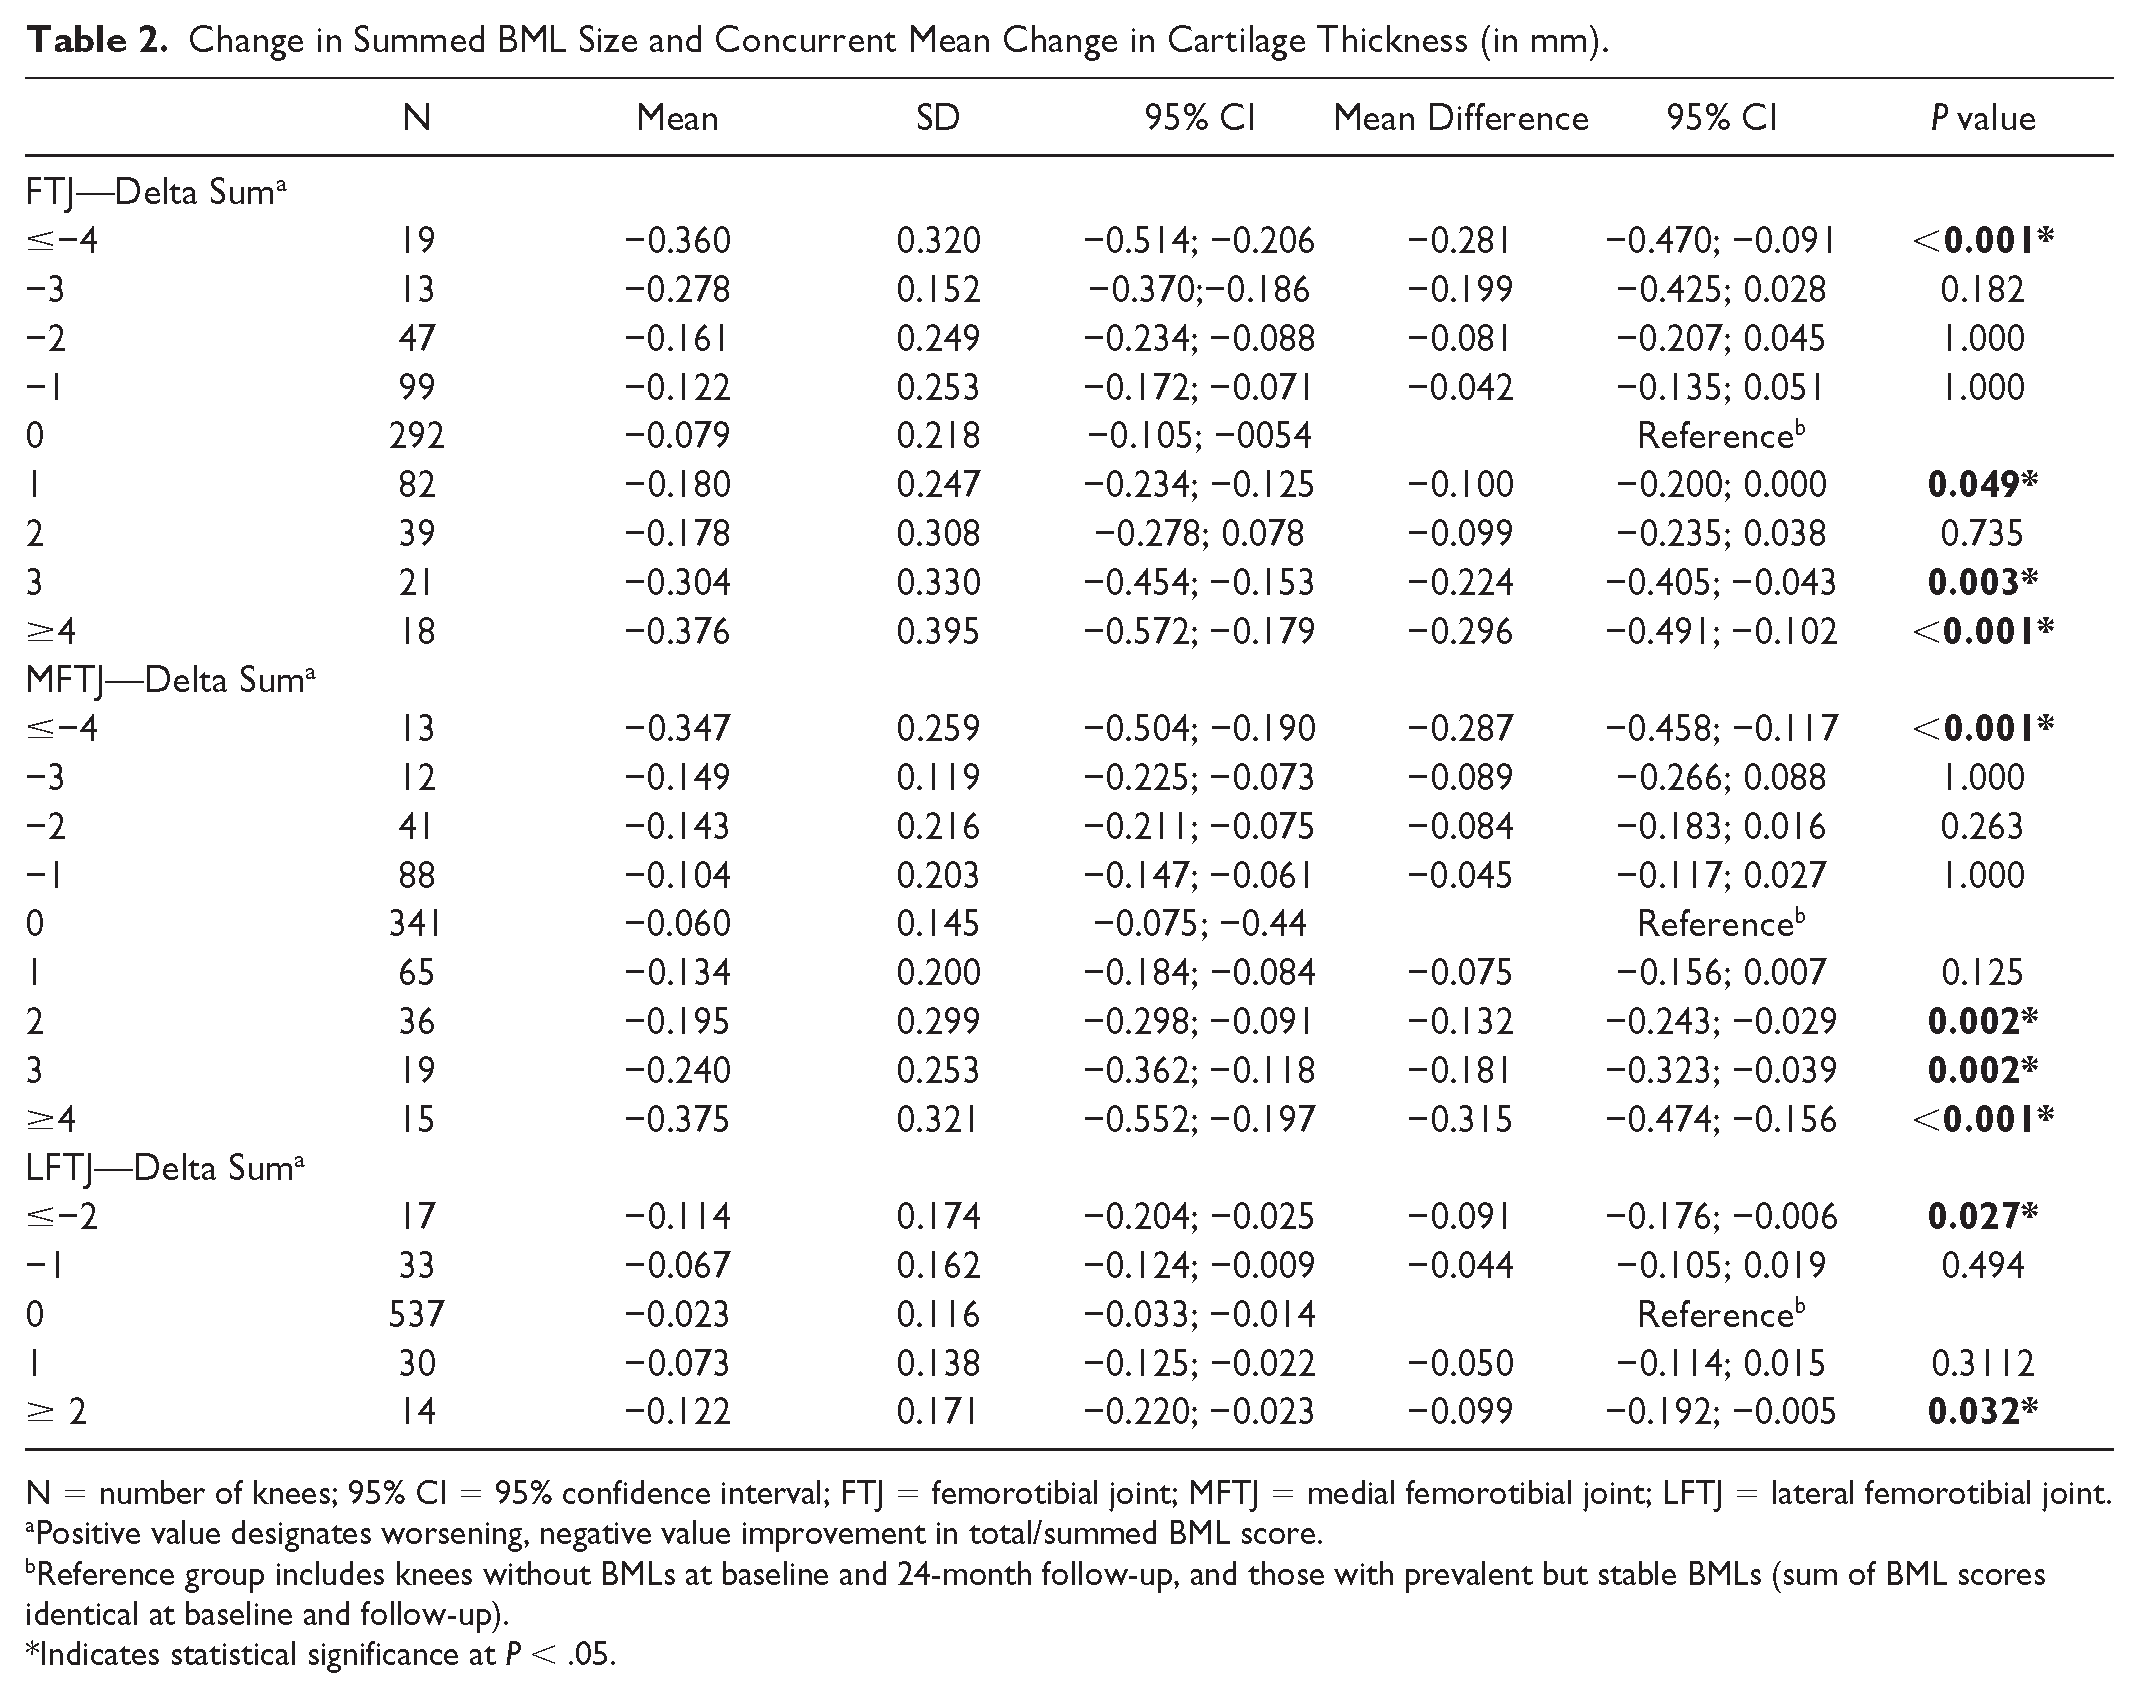
N = number of knees; 95% CI = 95% confidence interval; FTJ = femorotibial joint; MFTJ = medial femorotibial joint; LFTJ = lateral femorotibial joint.
Positive value designates worsening, negative value improvement in total/summed BML score.
Reference group includes knees without BMLs at baseline and 24-month follow-up, and those with prevalent but stable BMLs (sum of BML scores identical at baseline and follow-up).
Indicates statistical significance at P < .05.
Maximum Increase in Size of BMLs Over 24 Months and Concurrent Mean Change in Cartilage Thickness (in mm) in Knee With BMLs at Baseline.

N = number of knees; 95% CI = 95% confidence interval; FTJ = femorotibial joint; MFTC = medial femorotibial compartment; LFTJ = lateral femorotibial compartment.
Delta increase: 1 – change from 0 to 1 and/or 1 to 2 and/or 2 to 3; 2 – change from 0 to 2 and/or 1 to 3; 3 – change from 0 to 3.
Reference: Knees with baseline prevalent but stable BMLs over 24 months, that is, without increase in BML size over 24 months.
Indicates statistical significance at P < .05.
Maximum Increase in Size of BMLs Over 24 Months and Concurrent Mean Change in Cartilage Thickness (in mm) in Knees With or Without BMLs at Baseline.

N = number of knees; 95% CI = 95% confidence interval; FTJ = femorotibial joint; MFTJ = medial femorotibial joint; LFTJ = lateral femorotibial joint.
Delta increase: 1 – change from 0 to 1 and/or 1 to 2 and/or 2 to 3; 2 – change from 0 to 2 and/or 1 to 3; 3 – change from 0 to 3.
Reference: Knees without BMLs at baseline and no BMLs at 24-month follow-up plus knees with baseline prevalent but stable BMLs over 24 months.
Indicates statistical significance at P < .05.
Development of Large (grade 3) BMLs at 24 Months Follow-Up and Corresponding Concurrent Change in Cartilage Thickness.

N = number of knees; 95% CI = 95% confidence interval; FTJ = femorotibial joint; MFTC = medial femorotibial compartment; LFTJ = lateral femorotibial compartment.
No: No grade 3 BML in any of the subregions of interest at 24-month follow-up.
Yes: At least one grade 3 BML in any of the subregions of interest at 24-month follow-up and no grade 3 BML at baseline in any of the subregions.
Indicates statistical significance at P < .05.
Change in Inflammatory MRI Markers (Hoffa-Synovitis and Effusion-Synovitis) and Concurrent Change in Cartilage Thickness.

N = number of knees; 95% CI = 95% confidence interval; FTJ = femorotibial joint; MFTJ = medial femorotibial joint; LFTJ = lateral femorotibial joint.
Indicates statistical significance at P < 0.05.
Change in Number of Subregions With BMLs
Compared to knees with prevalent BMLs at baseline and no change in number of subregions over 24 months, knees without any subregions affected by FTJ BMLs at baseline and 24 months exhibited significantly less cartilage loss (mean cartilage loss −0.043 mm, 95% CI [−0.070, −0.015] vs. −0.186 mm [−0.229, −0.144], p < 0.001). Knees with worsening in number of subregions or improvement did not show any significant differences compared to the reference group (knees with prevalent BMLs at baseline and no change in number of subregions over 24 months). The same was observed for the MFTJ and LFTJ analyzed separately. Details are presented in Table 1 .
Change in Summed BML Size
Knees with an improvement of 4 or more sum scores as well as those with worsening by 1, 3, or 4 or more sum scores in the FTJ showed significantly more cartilage loss than those with a stable sum score or no BMLs at all at baseline and follow-up. Similar findings were observed for the MFTJ and the LFTJ analyzed separately ( Table 2 ).
Maximum Increase
Knees with a maximum increase of 2 or 3 BML grades showed significantly more cartilage loss (mean cartilage loss (−0.296 mm, 95% CI [−0.410, −0.182], p = .009 and −0.419 mm, 95% CI [−0.651, −0.187], p = .001) compared to those with no change in grade, that is, those with prevalent BMLs at baseline and same grade at follow-up (−0.113 mm [−0.176, −0.051]) in the FTJ with similar results for the MFTJ and the LFTJ. These findings are presented in Table 3 . When using those knees without BMLs at baseline and no BMLs at 24-month follow-up plus knees with baseline prevalent but stable BMLs over 24 months as the reference, all knees that showed an increase in delta of 1, 2, or 3 grades had significantly more cartilage loss than the reference ( Table 4 ).
Development of Large (Grade 3) BMLs
Knees exhibiting at least one subregion with a grade 3 BML at 24 months follow-up but no grade 3 BMLs at baseline (i.e. incident grade 3 BMLs) showed markedly more cartilage loss than those without grade 3 lesions in any of the subregions of the FTJ at follow-up (−0.275 mm, 95% CI [−0.381, −0.170] vs. −0.120 mm, 95% CI [−0.140, −0.100], p < .001). Similar results were observed for the MFTJ and the LFTJ analyzed separately ( Table 5 ).
Change in Inflammatory MRI Markers
Knees with worsening in Hoffa-synovitis showed significantly more cartilage loss in the FTJ than those without any Hoffa-synovitis at baseline and follow-up (mean cartilage loss −0.224 mm, 95% CI [−0.311, −0.136] vs. −0.087 mm [−0.117, −0.056], p < .001). This was also the case for knees that had grade 2 Hoffa-synovitis at baseline and at follow-up ( Table 6 ). Regarding worsening of effusion-synovitis, more cartilage thickness loss was observed in the MFTJ compared to those with no effusion-synovitis at baseline and follow-up (mean cartilage loss −0.150 mm, 95% CI [−0.187, −0.113] vs. −0.067 mm [−0.087, −0.047], p < .004). Those with presence of effusion-synovitis at baseline and no increase in grade at follow-up did not exhibit increased rates of cartilage loss compared to the reference. Details regarding MRI markers of inflammation are shown in Table 6 .
Discussion
In a sample comprised of participants from 2 large OA studies, the OAI/FNIH study and the IMI-APPROACH study,—largely representative of a clinical trial study population with radiographic knee OA KL grades 2 and 3, we found that—depending on the definition—worsening in BMLs showed concurrent associations with FTJ cartilage loss. This was particularly the case for maximum BML grade change and for those knees with grade 3 lesion development at 24 months. Improvement in BMLs did not result in less cartilage loss compared to those with prevalent BMLs without change over time, and knees without BMLs at baseline and follow-up had the lowest rates of cartilage loss longitudinally. Concerning change in inflammatory markers of disease, those knees with worsening in Hoffa-synovitis showed significantly more cartilage loss in the FTJ than those without Hoffa-synovitis at baseline and follow-up and knees with worsening of effusion-synovitis had more cartilage thickness loss in the MFTJ compared to the reference. Surprisingly, those that exhibited the same grade of effusion-synovitis at baseline and follow-up did not show increased rates of cartilage loss compared to those without any effusion-synovitis at baseline and follow-up.
This study expands previous work on the topic. It has been shown that baseline structural pathology of different articular tissues is associated with increased rates of quantitative cartilage loss, which makes stratification by baseline damage attractive for clinical trial recruitment as trial cohorts are commonly enriched by so-called potential fast progressors. 17 In addition, the worsening of different articular tissues is associated with concurrently increased rates of cartilage loss compared to those knees without change or improvement of concurrent tissue pathology. 18 Currently no disease-modifying OA drug has been approved for the treatment of OA that can reverse, hold, or slow the progression of structural damage of OA-affected joints. The reasons for failure are manifold and include the heterogeneity of structural disease of the OA joint at trial inclusion, and the sensitivity of biomarkers used to measure a potential treatment effect. Acknowledging the increasing relevance of structural phenotyping in a DMOAD context and the potential relevance of prediction of structural disease progression on an individual patient level, we wished to assess whether worsening of potentially reversible tissue pathology, namely BMLs and markers of inflammation, is associated with increased rates of cartilage loss and whether improvement is associated with decreased rates of cartilage loss. We chose quantitative cartilage thickness as the outcome measure as this parameter is commonly used as a structural endpoint in clinical DMOAD trials.15,16 Using semiquantitative measures of cartilage as an outcome, we could show previously in the multicenter osteoarthritis (MOST) study that increase in BML size over 30 months was associated with risk of subsequent cartilage loss in the same subregion. 8 Furthermore, in that study, the adjusted odds ratios (95% confidence intervals) of cartilage loss in the same subregion at follow-up for the different groups (using those subregions with stable BMLs as the reference) were 1.2 (0.5–1.6) for regressing BMLs, 0.9 (0.5–1.6) for resolving BMLs, 2.8 (1.5–5.2) for progressing BMLs, 0.2 (0.1–0.3) for subregions with no BMLs at baseline and follow-up and 3.5 (2.1–5.9) for newly developing BMLs. 8 In contrast to that investigation, in this study, we studied the change of BMLs in the entire FTJ and for the medial and lateral compartments separately. Our current findings are aligned with the MOST data as we found cartilage loss rates being lowest for those FTJs and compartments without any BMLs at baseline and follow-up and highest for those with BML size progression. The fact that in this study both worsening and improvement in number of subregions affected by BMLs resulted in increased rates of cartilage loss compared to those without seemed surprising at first. However, to show improvement of several subregions, a relatively high load of BMLs must be present (i.e. multiple subregions affected) in order to be able to improve. BML load at baseline was likely more relevant for subsequent cartilage loss than the actual improvement. Lowest rates of cartilage loss were consequently observed for those FTJs and compartments without any BMLs at baseline and follow-up.
We used different definitions of change and found that the most relevant ones were those focusing on maximum grade delta increases and those with incident grade 3 lesions at follow-up. In contrast, the change in the total sum of scores was not reflective of concurrent rates of cartilage loss. This has been pointed out in the past as a sum of ordinal scores may represent largely different tissue pathologies (e.g. multiple subregions with the presence of low grade lesions vs. few subregions with high grade lesions may result in identical sum scores). 29
Concerning our findings regarding change in inflammatory MRI markers, particularly worsening in Hoffa-synovitis, was reflective of concurrent increased rates of cartilage loss, while for effusion-synovitis, this was only observed for the medial compartment. This may reflect the overall lower rates of cartilage loss in the lateral compartment, which may also explain the nonsignificant findings for Hoffa-synovitis change in the lateral compartment. The fact that stable effusion-synovitis (including higher grades) did not show more cartilage loss compared to those without any effusion synovitis at baseline and follow-up is not easily explained and warrants further investigation. It may be that the presence of effusion-synovitis is more relevant in preradiographic disease but not in those knees with established OA. 30
Our study has limitations. We did not take into account baseline presence and change in other joint tissues than BMLs and inflammatory markers and particularly did not consider meniscal damage and extrusion, which are both known structural risk factors for longitudinal cartilage loss. In addition, we did not consider the patello-femoral joint in our analysis as quantitative assessment of cartilage was not available in either study. We cannot fully rule out that change of BMLs in the patello-femoral joint may be associated with a change in cartilage thickness in the entire femoro-tibial joint or in the medial or lateral femoro-tibial compartments. However, this seems unlikely given the close interrelation of tissues of the osteo-chondral unit and previous work on the topic applying semiquantitative assessment. 31 In this study, only the FTJ was considered in regard to change of BMLs. Furthermore, we focused solely on structure and did not take into account improvement or worsening in symptoms. For a DMOAD in order to gain regulatory approval positive effects regarding both structure and symptoms needs to be shown. 13 Our patient sample, albeit representative of a potential clinical trial population, was comprised of patients that were selected for a specific reason, that is, in the FNIH study by predetermined structural and clinical outcomes and in IMI-APPROACH by an increased likelihood of structural or symptomatic progression.21,32 Given clinical trials are commonly enriched with patients at high likelihood of progression we believe that our sample still does represent a clinical trial-relevant cohort. 33 A strength of our study is the combination of 2 large samples and the focus on KL 2 and 3 only. We used quantitative cartilage thickness as our structural outcome parameter as this is commonly used as a primary structural endpoint in clinical trials. Whether other tissues may serve as an outcome in the future remains to be shown but particularly applying anti-inflammatory approaches, reduction in inflammation will be quantified either based on ordinal grading or using quantitative assessment. 14 A shortcoming of our study regarding assessment of inflammation is the availability of only non-enhanced MRI. A shortcoming of our study regarding assessment of inflammation is the availability of only non-enhanced MRI. On standard non-enhanced MRI, it is impossible to visually distinguish between joint effusion and synovium as both features appear equally hyperintense on fluid-sensitive MRI sequences. Hoffa-synovitis is a surrogate term for diffuse hyperintense signal changes on fluid-sensitive fat suppressed MRI sequences within Hoffa’s fat pad. It has been demonstrated that abnormal signal changes in Hoffa’s fat pad correspond to synovitis on histology 34 and thus, has been used as an indirect surrogate for whole joint synovitis in many epidemiologic and observational studies of knee OA. Despite the research efforts to develop non-enhanced MRI-based evaluation methods to directly depict synovitis,35-37 they typically underestimate the severity of synovitis compared to contrast-enhanced MRI, and thus, more research is needed before we can rely only on non-enhanced MRI. In addition, such sequences (e.g. FLAIR-fs) were not available in the FNIH or IMI-APPROACH studies. In studies focusing on reduction in inflammation and particularly in synovitis, the gold standard of contrast-enhanced MRI should be included in the image acquisition protocol and dynamic, time-resolved and/or static sequences need to be acquired.38,39
In summary, knees – or FTJs – without any BMLs at baseline and follow-up showed lowest rates of cartilage loss and those with highest grade increase and incident large lesions the most cartilage loss. Thus, therapeutic approaches focusing on avoidance of BML development as well as avoidance of development of large lesions may appear to be relevant targets concerning BMLs. Regression of BMLs did not have a relevant impact on concurrent observed rates of cartilage loss, but we do not know whether the processes or mechanisms that led to decrease in BMLs size in this population are comparable to mechanisms that might be at work in a clinical trial testing therapeutic effects of a potential DMOAD. Regarding inflammatory markers of disease, worsening of Hoffa-synovitis has negative effects on FTJ cartilage loss and worsening of effusion-synovitis on MFTJ cartilage loss, while we could not show decreased rates of cartilage loss for those knees that had improvement compared to those that remained stable. In a DMOAD development context, this would mean that avoidance of worsening of inflammation may be more relevant than the focus on improvement.
Footnotes
Acknowledgment and Funding
The author(s) received no financial support for the research, authorship, and/or publication of this article.
Declaration of Conflicting Interests
The author(s) declared the following potential conflicts of interest with respect to the research, authorship, and/or publication of this article: Scientific and financial support for the FNIH OA Biomarkers Consortium are made possible through grants, direct and in-kind contributions provided by: AbbVie; Amgen Inc.; Arthritis Foundation; Bioiberica S.A.; DePuy Mitek, Inc.; Flexion Therapeutics, Inc.; GlaxoSmithKline; Merck Serono; Rottapharm | Madaus; Sanofi; Stryker; The Pivotal OAI MRI Analyses (POMA) Study, NIH HHSN2682010000. We thank the Osteoarthritis Research Society International (OARSI) for their leadership and expertise on the FNIH OA Biomarker Consortium project. The OAI is a public-private partnership comprised of five contracts (N01-AR- 2-2258; N01-AR-2-2259; N01-AR-2-2260; N01-AR-2-2261; N01-AR-2-2262) funded by the National Institutes of Health. Funding partners include Merck Research Laboratories; Novartis Pharmaceuticals Corporation, GlaxoSmithKline; and Pfizer, Inc. Private sector funding for the Consortium and OAI is managed by the FNIH.
The IMI-APPROACH study consortium received support from the Innovative Medicines Initiative Joint Undertaking under Grant Agreement no 115770, resources of which are composed of financial contribution from the European Union’s Seventh Framework Programme (FP7/2007–2013) and EFPIA companies’ in kind contribution. See www.imi.europa.eu and www.approachproject.eu. The funding sources had no role in the design of this study.
Ethical Approval
The IMI-APPROACH study is being conducted in compliance with the protocol, Good Clinical Practice (GCP), the Declaration of Helsinki, and the applicable ethical and legal regulatory requirements (for all countries involved), and is registered under clinicaltrials.gov nr: NCT03883568 (first submitted date 21/03/2019). All participants have received oral and written information and provided written informed consent. Ethics approval and all experimental protocols were approved by the local institutional ethics committees: Leiden University Medical Center, Leiden, The Netherlands; Complexo Hospitalario Universitario de A Coruña, A Coruña, Spain; Diakonhjemmet Hospital, Oslo; Norway; Assistance Publique—Hôpitaux de Paris, Sorbonne University, Paris France.
The OAI Study has been approved by the institutional review boards for the University of California, San Francisco and the four OAI clinical centres (University of Pittsburgh, Ohio State University, University of Maryland, Baltimore, Memorial Hospital of Rhode Island). All subjects have given informed consent to participate in the study.