
Abstract
Objective
To assess the relation between microbiome and lipopolysaccharide (LPS), in the blood and synovial fluid (SF) with femoral cartilage thickness (FCT) measured by ultrasound (US) in knee osteoarthritis (KOA) patients.
Methods
This cross-sectional study included 40 primary KOA patients recruited between September 2022 and June 2023. Age, gender, and body mass index (BMI) were recorded. Patients underwent full clinical examination, standing plain x-ray of the knee joint and knee US examination to measure medial, intercondylar, and lateral FCT. Microbiomes (specific bacterial phyla) were detected by real-time polymerase chain reaction and LPS levels were measured by enzyme-linked immunosorbent assay kit in the patients’ serum and SF.
Results
The patient’s age ranged from 43 to 72 years. Most patients were females (72.5%), with a mean BMI of 35.8 ± 6.21 kg/m2. The mean medial, intercondylar, and lateral FCT were less than cut-off values. All 40 (100%) patients showed positive bacterial deoxyribonucleic acid (16S ribosomal RNA) in both blood and SF samples. Firmicutes was the most abundant in patients’ blood (48.49%) and SF (63.59%). The mean serum LPS level was significantly higher compared to mean SF LPS (t =4.702, P < 0.001). There was a statistically significant negative correlation between lateral FCT and Firmicutes relative abundance in both patients’ blood and SF.
Conclusion
Microbiome and LPS are present in the blood and SF of primary KOA patients. Microbiome (Firmicutes) was associated with decreased lateral FCT. This might provide a potential link between both systemic and local microbiomes and cartilage affection in KOA patients.
Introduction
Microbiota represents trillions of non-harmful micro-organisms (mainly bacteria) that originally inhabit the gut mainly and other body sites such as the skin and the oral cavity.1,2 Under healthy conditions, gut microbiota are rich, diverse, and functioning together in balance.3,4 Gut dysbiosis is the disruption of the balance between microbiota with decreased microbial diversity.5,6 Dysbiosis is associated with multiple diseases such as obesity, rheumatoid arthritis, and osteoarthritis (OA).5,7,8
Several studies investigated the possible role of microbiota in the initiation and/or the progression of OA generally and knee osteoarthritis (KOA) specifically.8-12 It was suggested that during gut dysbiosis, gut permeability increases with the escape of microbiotas and their metabolites as lipopolysaccharides (LPSs) into the circulation creating a low-grade inflammation systemically and in the knee joint resulting in joint damage and progression of KOA.8-13 Microbiomes were detected in the gut (stool), 12 saliva, 14 blood, 15 synovial tissue, and synovial fluid (SF) 16 of KOA patients. Recent studies detected microbial deoxyribonucleic acid (DNA) in the cartilage of hip and KOA patients. 17
Decreased cartilage thickness is considered as an important indicator of KOA progression and severity. 18 Dório et al. 19 in 2020 found that the decreased femoral cartilage thickness (FCT) over a period of 12 months is a good indicator of KOA progression. Ultrasound (US) is a simple, cheap, non-invasive, and validated tool for the accurate qualitative assessment of FCT.20,21
From literature review, there is ongoing research in the field of microbiome in KOA with the exploration of new links between both. Though, little is known about microbiome relation to the osteoarthritic joint changes detected by US. Therefore, the aim of this study was to assess the relation between microbiome and LPS (in blood and SF) with FCT measured by US in KOA patients, in an attempt to find new links between microbiome and KOA.
Methods
Study Patients
This cross-sectional study included 40 patients (number of knees = 40, one knee per patient) diagnosed with primary KOA according to the European League Against Rheumatism evidence-based recommendations for the diagnosis of KOA 22 recruited between September 2022 and June 2023. The patients were recruited from the Rheumatology, Rehabilitation and Physical Medicine outpatient clinics, Alexandria Main University Hospitals, Egypt. Patients diagnosed with secondary KOA, or those who received glucocorticoid therapy within the past 3 months, 16 or those who received antibiotics 2 weeks prior to collecting the samples 16 were excluded from the study.
A sample size of 40 patients with KOA achieved 80% statistical power to detect a correlation between microbiome relative abundance in patients’ blood and SF and FCT measured by US, with an effect size of 0.3, using Pearson correlation test, at a 0.05 significance level. The sample size was calculated using IBM SPSS software for power analysis (IBM Corp., version 29.0.2.0 Armonk, NY).
Demographic Data and Clinical Assessment
Age, gender, and body mass index (BMI) were recorded from all patients. The assessment of the patients included full clinical examination 23 and standing plain x-ray (anteroposterior and lateral standing views) of the knee joint.
US Assessment of the FCT of the Knee
The US examination using a 3-16-MHz linear array transducer (Samsung HS5NL3K/WR, SAMSUNG MEDISON CO., Gangwon, Korea) was done by an experienced rheumatologist. Suprapatellar transverse axial scan in maximal knee flexion was done to measure medial, intercondylar, and lateral FCT. 24 Measurements were taken from midpoints of the medial condyle, lateral condyle, and intercondylar area. 25 The FCT measurements of the patients were compared to the FCT measurements and cut-off values obtained from normal individuals in our database.
Microbiome Study
Sample collection
Blood samples were collected from the patients in ethylenediaminetetraacetic acid (EDTA) tubes for polymerase chain reaction (PCR) and plain tubes (for separation of serum samples for LPS testing) using aseptic technique (alcohol 70%, followed by betadine solution then 70% alcohol), while, SF samples were aspirated from the knee joint of the patients using aseptic technique under US guidance, through transverse suprapatellar technique. The blood samples were immediately delivered to Alexandria University Main Microbiology laboratory in an icebox to be subjected to DNA extraction for PCR and LPS testing, while SF aspirates were transported at room temperature for further PCR analysis.
Real-time SYBR green PCR assay for microbiome analysis
Extraction of DNA from patients’ SF and whole blood samples was performed using QIAamp DNA Mini kit (Qiagen GmbH, Stockach, Germany) following manufacturer’s instructions. Using specific primers, real-time PCR was performed to amplify a conserved 16S ribosomal rRNA (16S rRNA) sequence found in all bacteria as well as selected bacterial phylum sequences.26-28 The primers used in the study are shown in
Primers Used in the Present Study.

16S rRNA = 16S ribosomal RNA; bp = base pair.
Negative extractions (sterile distilled water instead of blood sample) as well as reaction controls (sterile distilled water instead of DNA extract) were included in each PCR reaction to exclude cross or carryover contamination. Using the Rotor Gene Q program, the relative cycle threshold at which DNA for each target was detected compared to the cycle threshold at which universal bacterial DNA was detected after amplification was used instead of an absolute number. This relative quantification is automatically calculated by the Rotor-Gene software and expressed as relative fold difference.
The fluorescence intensity of the intercalated SYBR Green dye was used to quantify the sample. The cycle threshold, at which the signal was initially observed, was related to the initial concentration of DNA template. Using the Rotor Gene Q program, the relative cycle threshold at which DNA for each target was detected compared to the cycle threshold at which universal bacterial DNA was detected after amplification was used instead of an absolute number.
The sensitivity of the real-time PCR assay, including the efficiency of DNA extraction, was tested using blood samples spiked with known concentrations of 10-fold serial dilution of E. coli (ATCC 25922) till reaching a concentration of one colony forming unit of bacteria/ml of blood.
Determination of LPS Levels
LPSs were detected in patients’ serum and SF. LPS level determinations were performed using a kit based upon sandwich enzyme-linked immunosorbent assay (LPS ELISA kit; Cloud-Clone Corp., USA). The test was performed as per manufacturer’s recommendations. Serum and SF samples were diluted 5x with sample diluent included in the kit. LPS standard concentrations ranging from 0 to 800 ng/ml were used to construct a standard curve. The absorbance from each microplate well was measured at 450 nm. 13
Statistical Analysis of the Data
Data were analyzed using IBM SPSS software package version 20.0 (IBM Corp, Armonk, NY). Categorical data were described using number and percent. The Shapiro-Wilk test was used to verify the normality of distribution. Continuous data were described using range (minimum and maximum), mean, standard deviation, and median. Student t test and Wilcoxon signed-rank tests were used for continuous variables. Receiver operating characteristic (ROC) curve generated by plotting sensitivity (True Positive) on Y axis versus 1-specificity (False Positive) on X axis at different cut-boff values. The area under the ROC curve denotes the diagnostic performance of the test. Area more than 50% gives acceptable performance and area about 100% is the best performance for the test. The ROC curve allows also a comparison of performance between two tests. For assessing correlations between different continuous variables, Spearman’s correlation coefficient was calculated. All results were interpreted at 5% level of significance where the difference between the study groups was considered significant if P is ≤ 0.05.
Diversity index was calculated using PAST software (version 4.03, Paleontological statistics software package for education and data analysis) using the function diversity indices. 29 To evaluate the degree of variation of the microbial community structure within a sample, we measured the alpha diversity by employing the Shannon diversity index.
Results
Demographic Data
The patient’s age ranged from 43 to 72 years, with a median of 60 years. Regarding gender, 29 (72.5%) patients were females and 11 (27.5%) patients were males. The mean BMI was 35.8 ± 6.21 kg/m2.
US Assessment of the FCT
The mean medial FCT was 0.19 ± 0.05 cm, and a cut-off value of ≤0.23 cm was considered abnormal with 36 (90%) patients showing decreased medial FCT (
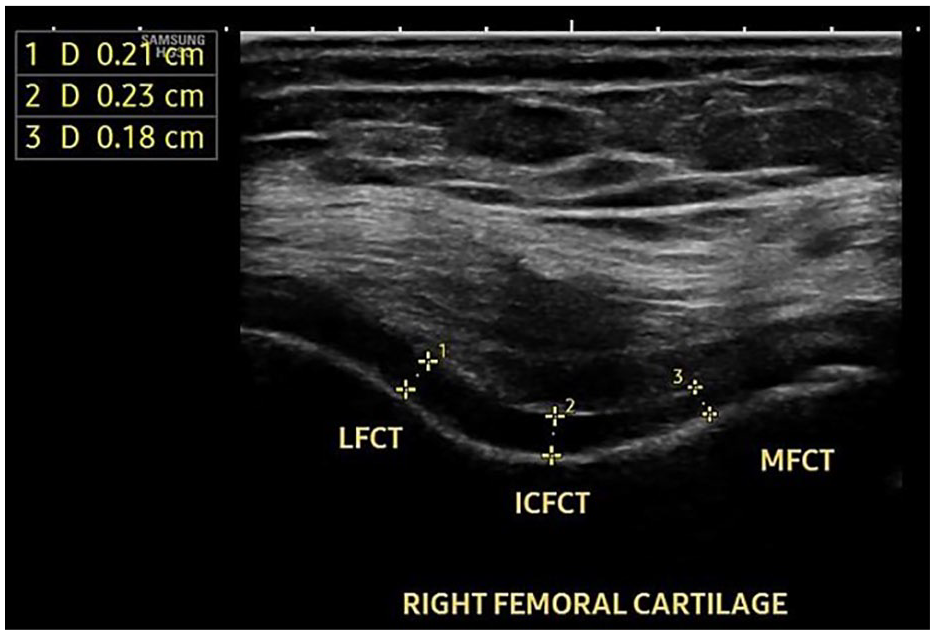
Ultrasound scan of the right knee femoral cartilage of a 48-year-old female patient with right knee osteoarthritis showing decreased MFCT, ICFCT, and LFCT. MFCT = medial femoral cartilage thickness; ICFCT = intercondylar femoral cartilage thickness; LFCT = lateral femoral cartilage thickness.
Microbiome Analysis
Bacterial phyla analysis
The sensitivity testing of the real-time PCR assay revealed that a minimum of 25 CFU/ml of spiked whole blood are required to generate a significant curve with detectable cycle threshold.
All 40 (100%) patients showed positive bacterial DNA (16S rRNA) in both blood and SF samples. Actinobacteria was positive in all 40 (100%) blood and SF samples; Firmicutes was positive in 39 (97.5%) blood samples and 38 (95%) SF samples; and Proteobacteria was positive in all 40 (100%) blood samples and 39 (97.5%) SF samples. On the other hand, Bacteroidetes was positive in only 1 (2.5%) SF sample and was negative in all blood samples. Regarding bacterial phyla abundance, Firmicutes was the most abundant in patients’ blood (48.49%) and SF (63.59%). The percentage of the different bacterial phyla relative abundance in SF and blood of patients is demonstrated in
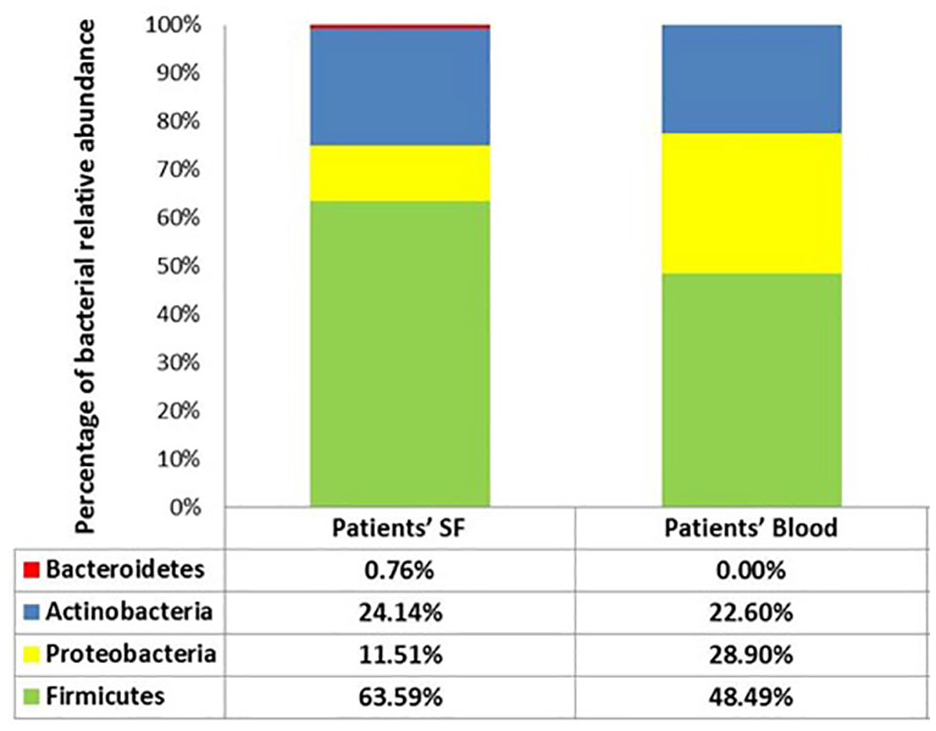
Comparison of bacterial relative abundance percentage in patients’ SF and blood. SF = synovial fluid.
Comparison of the Bacterial Relative Abundance between SF and Blood of the Patients (n = 40).
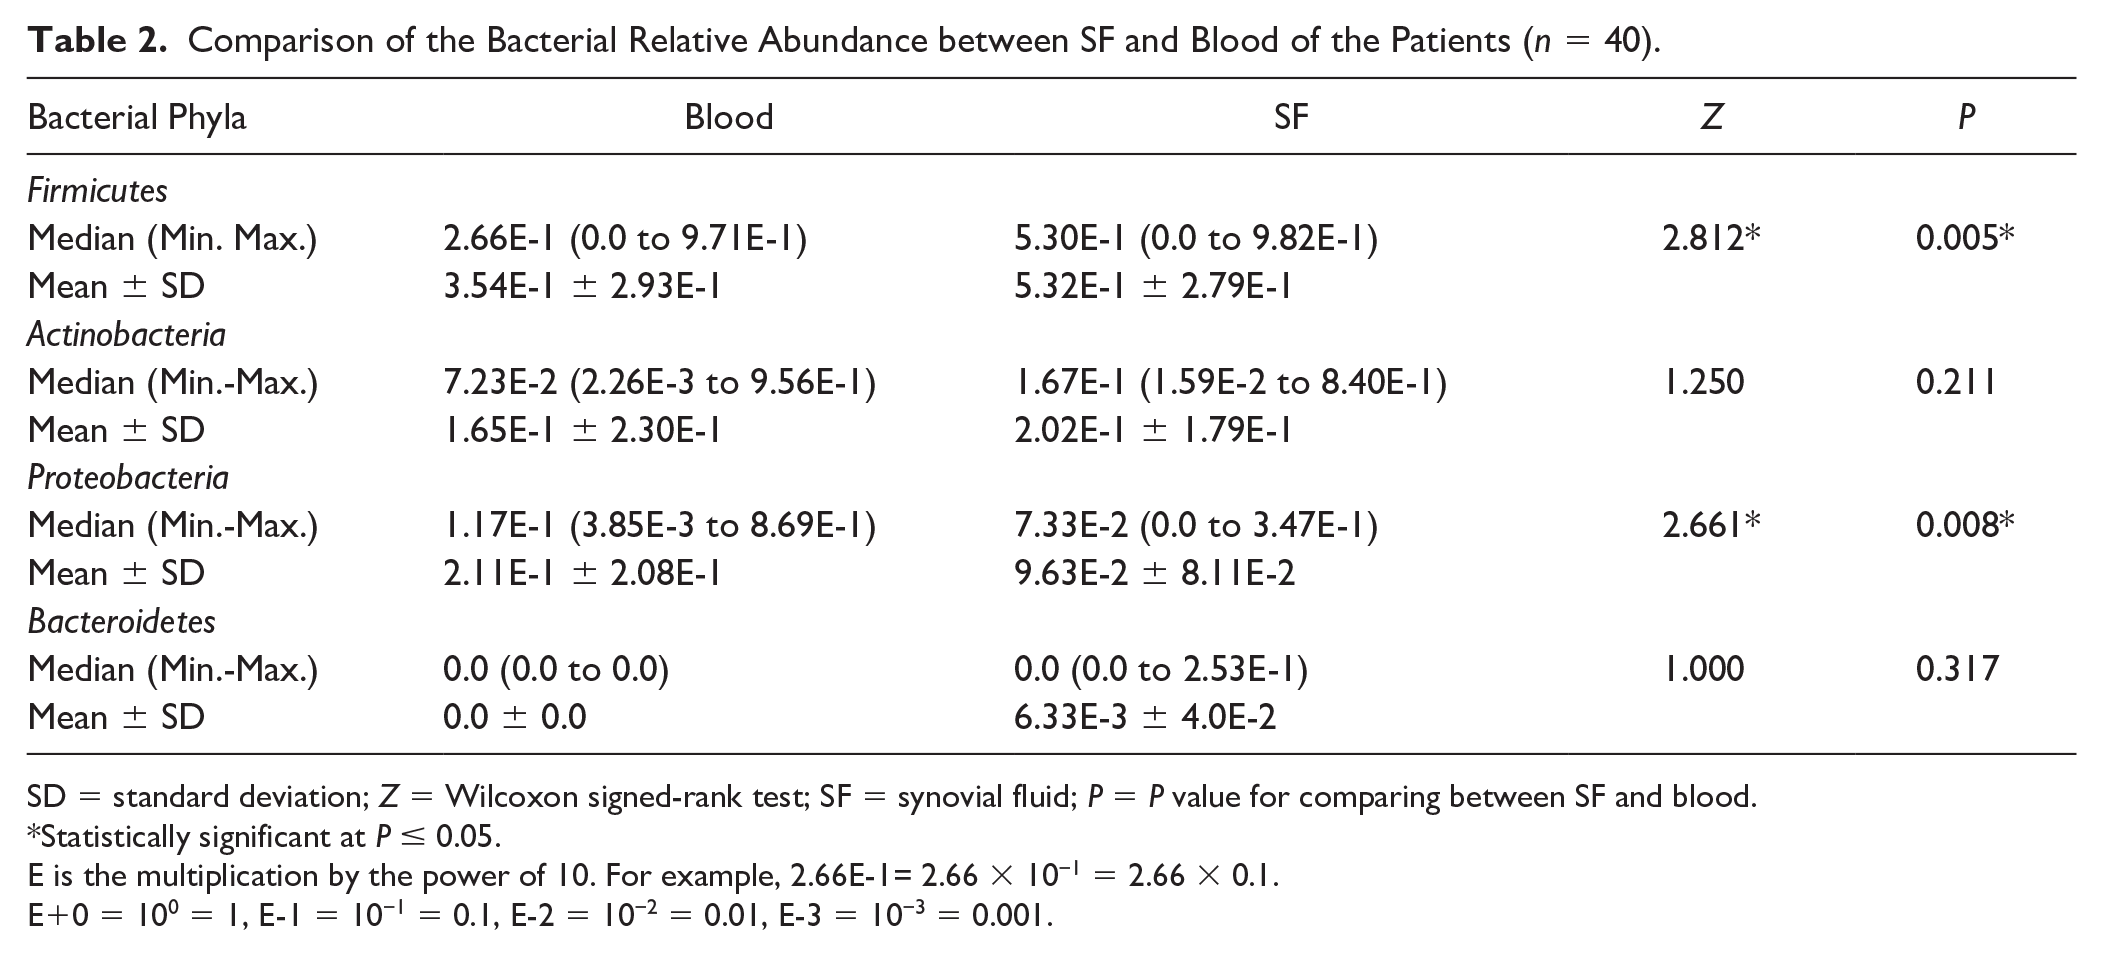
SD = standard deviation; Z = Wilcoxon signed-rank test; SF = synovial fluid; P = P value for comparing between SF and blood.
Statistically significant at P ≤ 0.05.
E is the multiplication by the power of 10. For example, 2.66E-1= 2.66 × 10−1 = 2.66 × 0.1.
E+0 = 100 = 1, E-1 = 10−1 = 0.1, E-2 = 10−2 = 0.01, E-3 = 10−3 = 0.001.
Alpha diversity
Shannon diversity index, which considers both species richness and evenness, demonstrated a similar degree of microbial diversity in the blood and SF of patients. The mean diversity index of patients’ blood is 1.09, and that of SF is 1.13.
Analysis of Serum and SF LPSs
The mean serum LPS level was 156.6 ± 42.12 ng/ml and the mean SF LPS level was 125.84 ± 24.73 ng/ml. Serum LPS showed statistically significant higher levels compared to SF LPS (t = 4.702, P < 0.001).
Microbiome and FCT
A statistically significant negative correlation was demonstrated between lateral FCT and Firmicutes relative abundance in both patients’ blood and SF (

Correlation between Firmicutes PCR results in synovial fluid and blood with LAT FCT in patients’ group. PCR = polymerase chain reaction; LAT FCT = lateral femoral cartilage thickness; rs = Spearman coefficient.
Discussion
Microbiome Detected in the Blood and SF of KOA Patients
In the current study, microbiome was detected in all (100%) blood samples of KOA patients with the predominant phyla being Firmicutes, Proteobacteria, and Actinobacteria, respectively, while Bacteroidetes were not detected. Similarly, Arbeeva et al. 15 detected microbiome in the blood of KOA patients with Firmicutes followed by Proteobacteria being the most abundant phyla. When gut dysbiosis occurs in inflammatory diseases as OA, disruption of the mucosal integrity occurs with increased intestinal permeability and translocation of microbiomes into the blood stream where they become persistent and induce systemic inflammation.30,31
Microbiome was also detected in all (100%) SF samples of our KOA patients. The most abundant bacterial phyla were Firmicutes (63.59%), followed by Actinobacteria (24.14%) and Proteobacteria (11.51%) with minimal amount of Bacteroidetes. Similarly, Firmicutes was the most abundant phylum in the gut and cartilage of KOA patients in the study by Boer et al. 12 and Dunn et al., 17 respectively. On the contrary, Zhao et al. 16 found that the most abundant phyla in the SF of KOA patients were Proteobacteria, Bacteroidetes, and Firmicutes, respectively; however, they didn’t specify the type of KOA, whether primary or secondary KOA. This controversy could be attributed to different personal and dietary habits, geographical distribution, and ethnic differences.32,33 Microbiome was significantly higher in the SF than in the blood of KOA patients which might be attributed to the progressive accumulation and trapping of the translocated microbiome by synovial inflammation inside the arthritic joint as suggested by Moen et al. 34
Firmicutes Predominance, Bacteroidetes Scantiness
The blood and the SF of KOA patients showed the predominance of the Firmicutes phylum and the scantiness of the Bacteroidetes phylum. It was found that high fat diet and obesity disturb gut microbiota diversity with increased production of pro-inflammatory bacteria (endotoxin producing) as Firmicutes and Proteobacteria and decreased production of anti-inflammatory bacteria (protective to the intestinal barrier) as Bacteroidetes. 35 Also, increased Firmicutes/Bacteroidetes ratio was associated with high fat diet and gut dysbiosis. 35 In this context, Xiang et al. 35 suggested that gut dysbiosis is in the form of increased Firmicutes and decreased Bacteroidetes, which is similar to our results together with increased Firmicutes/Bacteroidetes ratio that is associated with OA results in increased gut permeability with the induction of low-grade inflammation in the whole body and aggravation of OA process.
LPSs Detected in the Blood and SF of KOA Patients
LPSs were detected in the blood of KOA patients, and they are pro-inflammatory endotoxins produced by gut microbiota during gut dysbiosis, where they translocate through the disrupted intestinal barrier into the circulation inducing systemic inflammation that is involved in different diseases.36,37 Therefore, increased systemic LPSs indicate gut dysbiosis.36,37 Huang et al. 13 and Loeser et al. 38 speculated that LPSs pass from the gut into the circulation in KOA patients through the increased gut permeability associated with gut dysbiosis allowing more bacterial load to pass into the circulation.
LPSs were also detected in the SF of all KOA patients, but they were significantly lower than serum LPS, which is similar to the results of Huang et al. 13 LPSs are normally masked by natural inhibitors that are present in the serum and other biological fluids. Several methods such as heating and dilution were used in a trial to decrease LPS inhibition, but still not completely effective. 13 Huang et al. 13 found that the percentage of LPS inhibition in serum was 60-90%, while that of LPS inhibition in SF was 64-100%. Therefore, the higher level of LPS inhibition in the SF might explain why SF LPS level was lower than that in the serum.
Microbiome and Cartilage
The suggested role of microbiome in cartilage degeneration was first supported by Dunn et al., 17 who found microbial DNA in the cartilage of KOA patients. They also suggested that the thinning and erosions in the osteoarthritic cartilage increases its exposure directly to the blood and to the inflammatory mediators in the systemic circulation, which in turn makes it more liable to the faster and higher accumulation of bacterial DNA. 17 Furthermore, the cartilage-gut-microbiome axis explained that microbiota enters from the circulation into OA joint through the subchondral vascular channels of the calcified zone of the cartilage and the neoangiogenesis that is formed at the osteochondral junction of the OA cartilage creating a state of “focal dysbiosis.” 39 Neoangiogenesis in the osteoarthritic cartilage is associated with hypertrophied chondrocytes and continuous proliferation of endothelial cells that creep more and more inside the cartilage inducing more damage.40,41 Neoangiogenesis occurs due to the increased production of pro-angiogenic factors such as vascular endothelial growth factors (VEGF) and transforming growth factor-beta (TGF-β).41,42 These pro-angiogenic factors (VEGF, TGF-β, and other cytokines) were also found to be induced by microbiome and its metabolites. 43 Thus, one would assume that microbiomes are carried by blood into the OA cartilage producing pro-angiogenetic factors provoking the already ongoing neoangiogenesis in the OA cartilage with further cartilage destruction. In this context, new treatment lines directed toward inhibiting neoangiogenesis have been proposed to stop cartilage destruction.41,42 Also, probiotics were found to downregulate VEGF and thus hinder the process of neoangiogenesis. 44
Consequently, we assumed that measuring the FCT in our patients using US might give us a new clue of the relation between microbiome and KOA cartilage. Our results demonstrated that decreased lateral FCT correlated significantly with increased Firmicutes relative abundance in both the blood and SF of KOA patients. Furthermore, it correlated significantly with both increased Proteobacteria and Actinobacteria relative abundance in the blood of KOA patients. Thus, we assume that there is an association between increased bacterial DNA load (both in blood and in the knee joint) and decreased lateral FCT. This relation might suggest a potential role of microbiome in cartilage degeneration; nevertheless, future longitudinal follow-up studies are needed to prove this relation.
Medial FCT versus Lateral FCT
Although our results showed that there was more thinning in the medial versus the lateral FCT, no correlations were found between any of the bacterial phyla and the medial FCT. We assumed that this difference in correlation studies between lateral and medial FCT may be attributed to the different patterns of vascular supply to the femoral condyles. Substantial anatomical variations in the blood supply of the medial and lateral femoral condyles at the site of attachment of the femoral cartilage were reported. 45 The lateral femoral condyle receives both extraosseous blood supply from the superior and inferior lateral genicular arteries and intraosseous blood supply from an arcade of vessels that give out several branches to the subchondral bone with no areas of limited vascularity.45-48 Inversely, the medial femoral condyle receives extra osseous blood supply from both the superomedial genicular artery and the descending genicular artery and intraosseous blood supply from a single vessel supplying the subchondral bone with possible areas of limited vascular supply.45,46,48 Therefore, we assume that microbiome, being carried by blood, is directed toward the more vascular lateral femoral condyle where the lateral femoral cartilage is attached to access the synovial cavity. Nevertheless, the effect of microbiome on the medial articular cartilages (which is more affected by OA in our study) cannot be excluded but might be greatly masked by the inevitable considerable effect of mechanical loading and hence the lack of correlation.
Future Perspectives
Proper understanding of the contribution of microbiome to the initiation and progression of the inflammatory process and cartilage degeneration in KOA will surely influence future diagnostic and therapeutic strategies of KOA. 49 Several studies proposed that screening specific microbial profiles in KOA patients might act as potential diagnostic biomarkers for KOA.49,50,51 Moreover, probiotics targeting microbiome was found to inhibit joint degeneration, cartilage damage, and overall KOA progression in both humans and mice, which stands as a therapeutic potential to KOA.52,53 Therefore, we hope that our study might aid for the better understanding of the contribution of microbiota in KOA and thus finding more promising lines of diagnosis and treatment for KOA.
There are two main limitations of this study. First, the analysis of microbiome was done on the phylum level only. Analysis of individual genera and species would give more interesting findings in terms of diagnostic, prognostic, and therapeutic parameters. Second, a larger sample size is needed to establish a causal relationship between microbiome and articular changes in KOA.
Conclusions
Microbiome and LPSs are present in the blood and SF of primary KOA patients. Microbiome (Firmicutes) is associated with decreased lateral FCT. This might provide a potential link between both systemic and local microbiomes and cartilage affection in KOA patients.
Footnotes
Acknowledgments and Funding
The author(s) received no financial support for the research, authorship, and/or publication of this article.
Declaration of Conflicting Interests
The author(s) declared no potential conflicts of interest with respect to the research, authorship, and/or publication of this article.
Ethics Approval
The study was approved by the local ethical committee of Faculty of Medicine, Alexandria University (ethics board approval number: 0201453, IRB number: 00012098). Helsinki ethical principles for medical research for human subjects were followed.
Informed Consent
A written informed consent was obtained from all patients before enrollment in the study.
Availability of Data and Materials
The data sets used and/or analyzed during the current study are available from the corresponding author on reasonable request.