
Abstract
Objective
Ultra-short TE (UTE) sequences on MRI are a technique that improves the visualization of tissues with short T2 relaxation time, such as deep cartilage layers. In addition, T2* relaxation time calculated from the UTE has the potential to evaluate water molecules bound to the cartilage matrix. This study was performed to determine if there is an association between UTE-T2* relaxation time by cartilage layer and histological degeneration in knee osteoarthritis (OA).
Design
Seven knees that had undergone total knee arthroplasty (TKA) were included in the study, and the lateral tibial cartilage, which had the least degeneration of the resected bones, was used as the sample. The T2* relaxation time of 4 patients with no abnormal findings on MRI was the reference relaxation time. Histological degeneration of TKA samples was assessed by the Mankin score and graded as the early OA group (≤3 points) and the advanced OA group (≥4 points). The association between T2* relaxation time and Mankin grade in each cartilage layer was compared. The effect of angiogenesis to the tidemark on T2* relaxation time was also compared.
Results
T2* relaxation time of the cartilage layer was significantly longer in early OA than that in the control group. In the deep cartilage layer, the mean T2* relaxation time for angiogenesis (−) was 15.7 ms, whereas it was significantly shorter for angiogenesis (+) at 8.2 ms.
Conclusions
The UTE-T2* relaxation time was associated with histological cartilage degeneration, suggesting a potential application in monitoring early cartilage degeneration.
Keywords
Introduction
Osteoarthritis (OA) is a joint disease with pain that impairs activities of daily living and decreases quality of life (QOL). Knee OA is one of the most common musculoskeletal disorders and is a slow, but progressive disease. 1 OA is thought to be caused by a number of factors, including degeneration and wear of articular cartilage and inflammatory and degenerative changes in other intra-articular tissues.2-4 Cartilage is avascular tissue composed of chondrocytes and extracellular matrix, it has a low capacity for repair, and once degenerated, the changes are irreversible, both structurally and functionally. 5
Conservative treatments such as exercise therapy, analgesics, and intra-articular injections are the first-line treatment to prevent progression and improve symptoms. Surgical treatment is required for patients who do not obtain sufficient pain relief and functional improvement with conservative treatment. The guidelines of the American Academy of Orthopaedic Surgeons and the Osteoarthritis Research Society International also emphasize the importance of patient education, exercise, and weight loss in the treatment of OA.6,7 Therefore, it is important to detect cartilage degeneration at an early stage, before morphological changes of the joint become apparent.
Cartilage consists of a specific structure in which the orientation of collagen fibers and the morphology of chondrocytes change with depth from the surface to the superficial, middle, and deep layers.8,9 In the superficial layer, collagen fibers are oriented parallel to the cartilage surface and antagonize shear forces applied to the articular surface. In the deeper layers, the collagen fibers are oriented perpendicular to the tidemark, contributing to the bonding with the subchondral bone and to the load-dispersing action.
Conventional clinical MRI evaluation can detect changes in tissue morphology, but it is relatively insensitive to early degeneration of the tissue. Quantitative MRI may be useful for assessment of degenerative changes before the appearance of macroscopic damage. T2 mapping is versatile and allows quantitative evaluation of collagen fiber orientation and water content.10,11 However, T2 relaxation time in the deep layers of articular cartilage is very short, and it is difficult to obtain data in this region using T2 mapping.12,13 In recent years, the ultra-short TE (UTE) sequence, in which TE can be shortened to the microsecond order due to improvements in MRI technology, has been applied in clinical practice. 14 UTE imaging can detect signals from short T2 tissues, allowing objective evaluation of tissues by T2* relaxation time. 15
The purpose of this study was to evaluate the relationship between MRI UTE-T2* relaxation time and histological degeneration in different cartilage layers of knee OA. We hypothesized that UTE-T2* relaxation time measured by in vivo MRI quantifies changes within the cartilage of early OA.
Materials and Methods
Subjects
The study was approved by the clinical research review board at Sapporo Medical University Hospital (312-93). Patients were asked to provide written, informed consent, which was obtained after thorough written and oral explanations. The subjects were 7 patients with knee OA who had undergone total knee arthroplasty (TKA; 5 females, 2 males; mean age 74.3 [69-82] years; mean body mass index [BMI] 25.3 kg/m2). Kellgren-Lawrence (KL) grade assessed by standing radiographs was grade 3 in 2 patients and grade 4 in 5 patients. These subjects were selected for TKA because of severe cartilage loss in the patellofemoral joint and medial compartment. Another 4 knees with KL grade 1 (3 females, 1 male; mean age 66.3 [59-73] years; mean BMI 26.1 kg/m2) with no abnormal joint findings on radiographs and MRI examination were included in the control group. Exclusion criteria were trauma, fracture, previous knee surgery, or inflammatory diseases such as rheumatoid arthritis.
MR Data Acquisition
Before surgery, a UTE sequence for T2* relaxation time measurements was performed in addition to routine MRI. The imaging equipment used was a 3T-MRI scanner (Ingenia; Philips Healthcare, Best) and a dS knee 8ch coil (Philips Healthcare). T2* relaxation time measurements were acquired using a UTE sequence as follows: TR= 27 ms, TE = 0.16/4.5/9.0/13.4/17.8/22.3 ms, slice thickness = 3 mm, field of view = 140 mm, matrix size = 208 × 208, and scanning time = 8 minutes 44 seconds. The routine MRI protocol included coronal and sagittal T2-weighted imaging, proton density-weighted imaging, and three-dimensional fat-suppressed gradient-echo sequence. For the UTE sequence, imaging was performed 20 minutes after the patient was placed on the examination table because loading due to walking and other factors may affect the measurements. 16
Post-Processing and Image Analysis
IntelliSpace Portal (ISP: Philips Healthcare) was used for T2* mapping analysis and measurement. For T2* mapping analysis, 6 images with different TEs (TE = 0.16-22.3 ms) were loaded into ISP and calculated by fitting the data with a mono-exponential decay curve, as shown in the following equation.
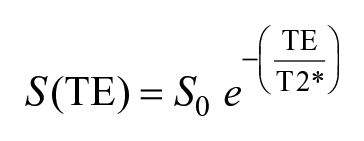
S(TE) is the signal intensity measured at each TE, and S0 is the initial signal intensity at time t = 0. Cartilage segmentation was performed by a single radiologist (15 years of experience). High-intensity linear signals near the osteochondral junction in UTE images have been identified as deep layers of non-calcified cartilage and calcified cartilage.14,17 The boundary between the subchondral bone and the non-calcified cartilage layer was manually segmented using the UTE image (TE = 0.16 ms) as a reference. The cartilage surface was further segmented in the TE= 22.3 ms image. The cartilage was automatically trisected by ISP into deep, middle, and superficial layers based on the cartilage thickness (
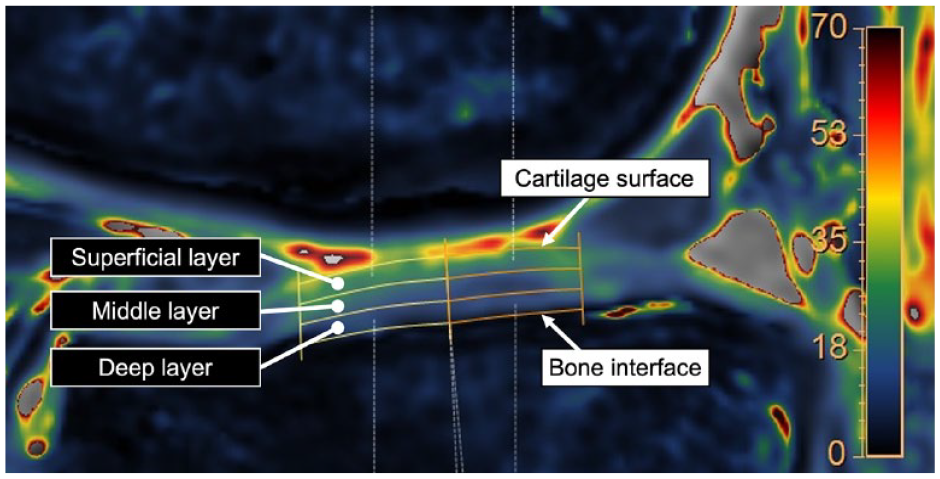
The T2* relaxation time is measured by manually specifying the cartilage surface and the subchondral bone boundary. Cartilage stratification is performed using the method in which the analysis software automatically divides the cartilage into 3 equal sections.
Tissue Sampling and Processing
The interval from MRI to surgery was within 2 weeks. TKA was performed by an orthopedic surgeon. Both the femur and tibia were osteotomized using the thickness of the implant as a reference. Lateral tibial cartilage, which had the least degeneration of the resected bones, was used as a sample. The excised lateral tibial cartilage was immediately covered with fresh gauze to prevent drying, and the tissue processing was performed within 2 hours after excision. For matching between the preoperative MRI and tissue sections, the bone cut surface was reconstructed by preoperative 3D-MRI using the implant placement angle and the amount of bone resection measured from the postoperative x-ray images (
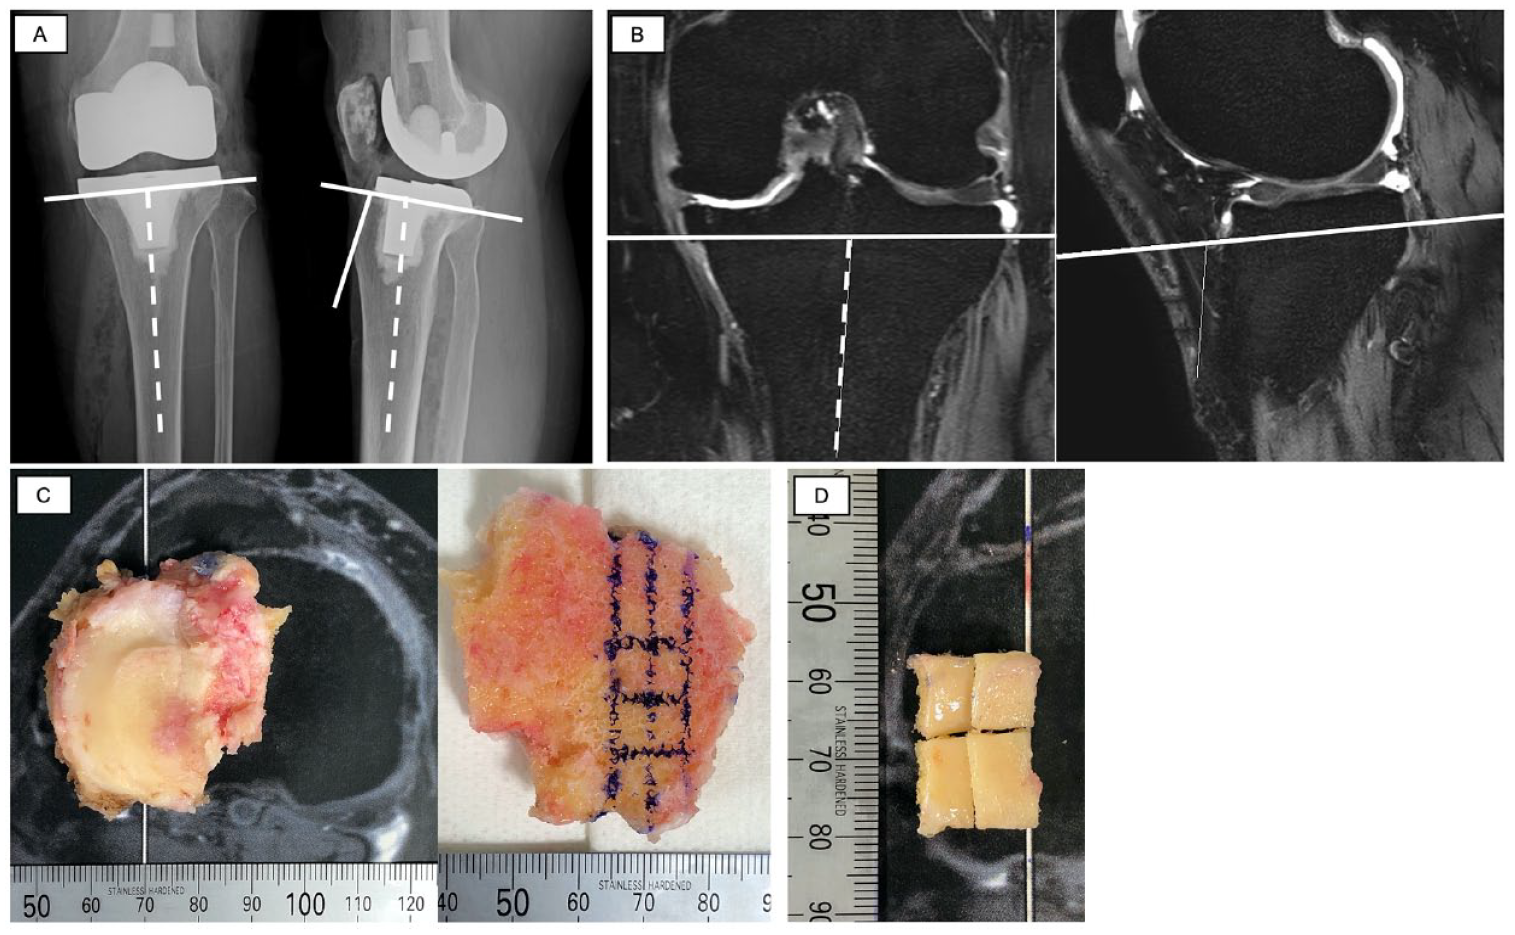
Preoperative MRI and tissue section matching methods. (
Histological Evaluation
Osteochondral fragments were immersed in 4% paraformaldehyde and fixed at 20 °C for 24 hours. The tissues were then immersed in phosphate buffer containing 10% ethylenediaminetetraacetic acid and decalcified. Paraffin-embedded specimens were cut into 4-mm-thick slices, and sections were stained with safranin O. Histological evaluation of the cartilage was performed with the Mankin system. 18 The Mankin score was evaluated by two orthopedic surgeons (Y.M. [15 years of experience], Y.O. [17 years]), and the average score of the two surgeons was used. In this study, the grade was classified into two groups: grade 1 (early OA group) with 0 to 3 points and grade 2 (advanced OA group) with 4 or more points. 19
Statistical Analysis
The Steel-Dwass test was used to compare the T2* relaxation time and Mankin grade by ROI for each layer. Comparison of T2* relaxation time by the presence of angiogenesis of tidemarks was analyzed by the Mann-Whitney U test. These statistical analyses were performed using commercially available software, JMP Pro version15 (SAS Institute Inc., Cary, NC), assuming significance at a level of P < 0.05.
Results
In the control group, MRI findings such as joint edema, meniscal lesions, bone marrow edema, and cartilage defects were not observed. Twenty-seven samples were obtained from the lateral tibia of 7 knees. Nine samples were Mankin grade 1 (early OA), and 18 samples were Mankin grade 2 (advanced OA; Table 1 ). Six of the 27 samples had angiogenesis of the tidemark. There were 7 samples with perfect inter-rater agreement on the Mankin score, 10 samples with a score difference of 1 point, 10 samples with a score difference of 2 points, and no disagreement of 3 points or more.
Mankin Grade Classification.
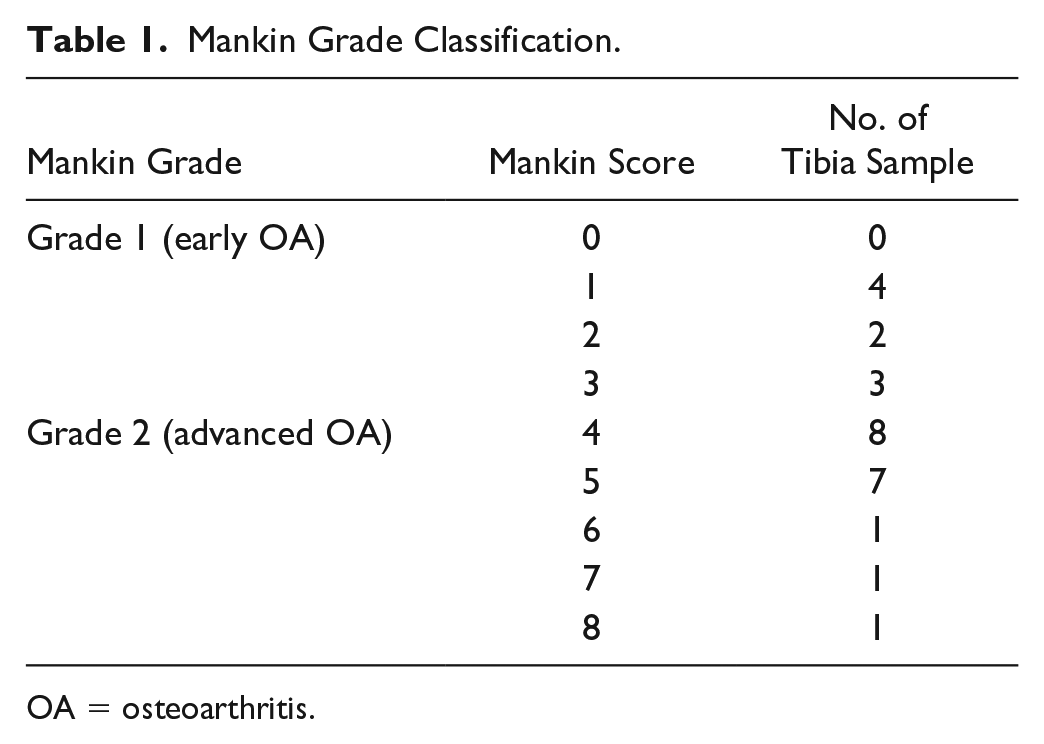
OA = osteoarthritis.
The mean T2* relaxation times for the early OA group were: deep: 19.6 ± 4.3 ms; middle: 29.6 ± 7.0 ms; and deep + middle: 24.6 ± 7.0 ms. In contrast, the mean T2* relaxation times for the control group were: deep: 12.1 ± 2.1 ms; middle: 18.7 ± 4.2 ms; and deep + middle: 15.4 ± 2.6 ms. Early OA showed significantly longer T2* relaxation time compared to controls in the deep (mean difference 9.5 ms; 95% confidence interval [CI] 2.2, 12.4; P = 0.001), middle (mean difference 8.3 ms; 95% CI 3.0, 19.4; P = 0.007), and deep + middle (mean difference 9.4 ms; 95% CI 3.7, 14.6; P = 0.002) layers (
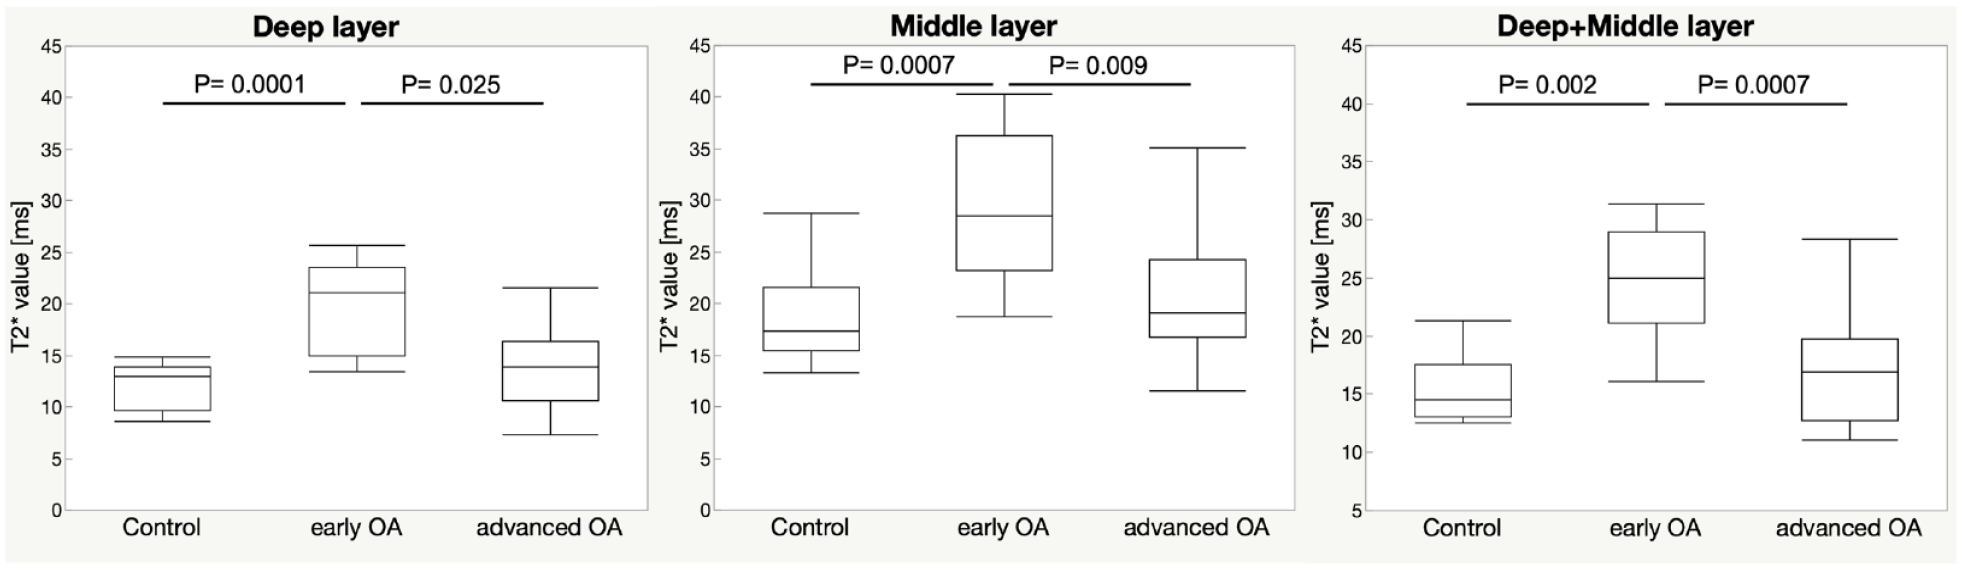
Comparison of T2* relaxation time by Mankin grade and cartilage layer. OA = osteoarthritis.
A comparison of UTE T2* relaxation time by angiogenesis (+/−) is shown in Figure 4 . In the deep layer, the mean T2* relaxation time for angiogenesis (−) was 15.7 ms, while the mean relaxation time for angiogenesis (+) was 8.2 ms, a significant shortening (P = 0.04). On the other hand, no significant differences were found for the intermediate (P = 0.12) and deep + intermediate (P = 0.08) layers.
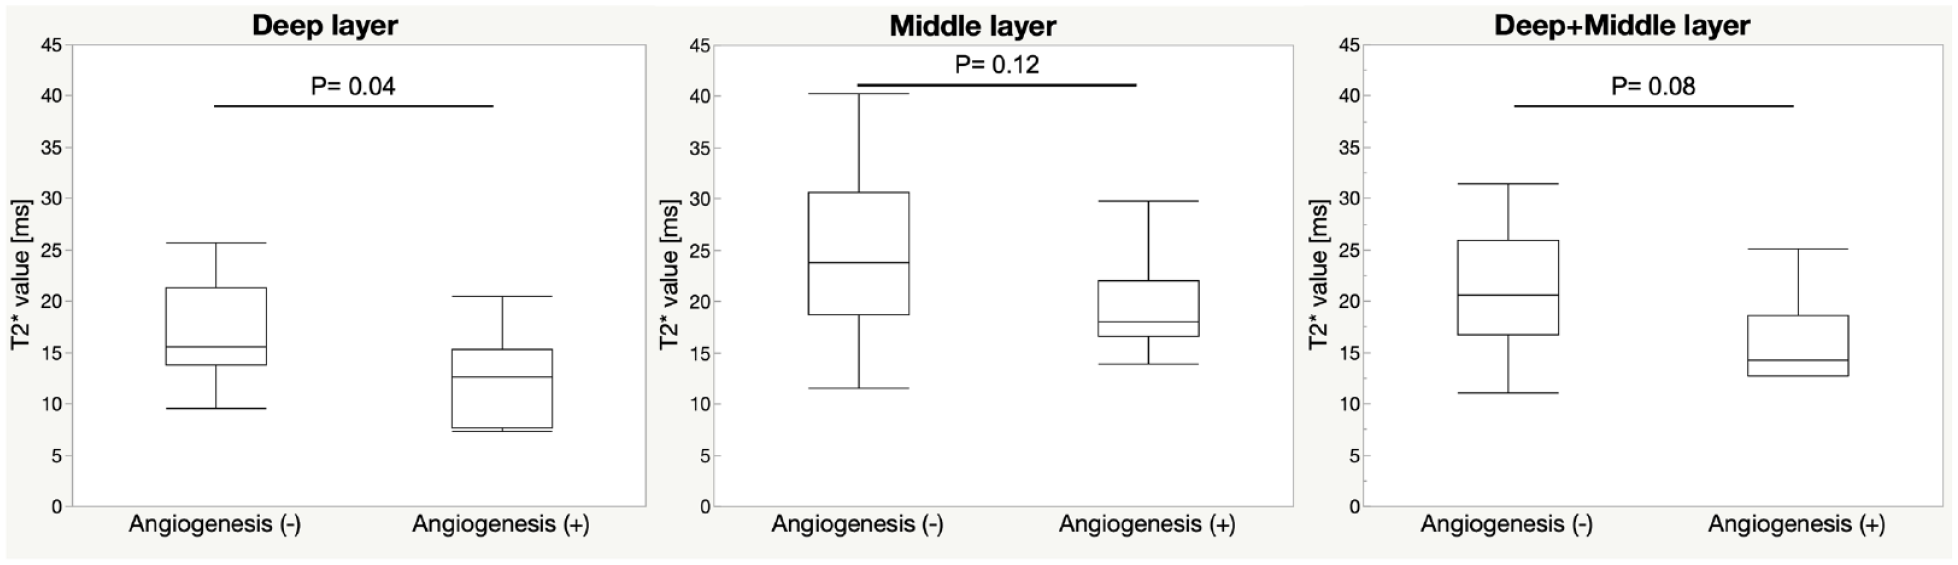
Comparison of T2* relaxation time by cartilage layer with and without angiogenesis.
Discussion
The association of in vivo MRI UTE-T2* relaxation time with histological degeneration in knee OA samples was analyzed. T2* relaxation time by cartilage layer was significantly longer in early OA. Samples with angiogenesis were significantly associated with shorter T2* relaxation time in deep layers. To the best of our knowledge, this is the first study to compare in vivo MRI UTE-T2* mapping with histological evaluation of cartilage layers.
Knee OA is a highly prevalent and progressive disease, requiring surgical treatment for advanced cases. Therefore, early detection of cartilage degeneration enables interventions such as exercise therapy to maintain a high QOL.20-22 However, a method for noninvasive evaluation of cartilage degeneration has not been established. MRI has been used to evaluate cartilage morphology and signal changes subjectively, but recently, objective evaluation methods using mapping images have been demonstrated. T2* analysis with UTE-MRI, which can shorten TE to the microsecond order, is a new technique that can detect signals from deep cartilage layers, which have predominantly short T2 characteristics, and evaluate their composition. 14
Williams et al. 12 reported that UTE-T2* mapping of cartilage is sensitive to the interaction between water molecules and collagen fibers and is superior to T2 mapping, especially for detecting early degeneration and assessing deep cartilage layers. Yang et al. 13 compared histological evaluation (Mankin score) with T2* relaxation time in femoral cartilage from arthroplasty patients. They reported that T2* relaxation time shortened as the grade of histological evaluation progressed, but there was no significant difference between groups with lower histological degeneration. Their MRI was performed ex vivo, and the temperature differences and magnetic susceptibility of the measurement environment that affected T2* relaxation time were different from those in vivo. Therefore, the present study was performed in vivo because the measured relaxation time may not reflect the physiological environment. Bittersohl et al. 23 reported shorter T2* relaxation time in the deep layer of cartilage than in the superficial layer in asymptomatic healthy volunteers by dividing the ROI into two sections in the direction of cartilage depth. This is believed to reflect the layered structure of cartilage, and it has been reported that it is difficult to distinguish whether changes in T2* relaxation time in the overall ROI are due to cartilage degeneration, and important changes may not be detected. In the present study, in vivo MRI was used to minimize the effects of magnetic susceptibility, temperature, and other factors on T2* relaxation time, and detailed T2* measurement was possible by analyzing the measurements in layer-specific ROIs.
Few studies compared early OA with controls, making it difficult to determine whether T2* relaxation time was prolonged or shortened in early OA. In the present study, T2* relaxation time was increased in early OA compared to the control group. Early changes associated with OA in cartilage have been reported to include chondrocyte proliferation and an evanescent increase in water content of the cartilage. 24 Szarek et al. 25 quantified the morphological changes of collagen fibers and networks in cartilage during the early stages of OA and showed that the variation in collagen fiber orientation increases with the progression of early OA in both superficial and deep layers. The increase in T2* relaxation time may be attributed to the irregular collagen fiber networks due to the progression of OA and the increased mobility of water molecules due to the wider space between fibers. On the other hand, the advanced OA groups had shorter T2* relaxation times, which is consistent with previous studies. The shortening of T2* relaxation times may reflect the decrease in proteoglycans and the decrease in water binding to the proteoglycans as cartilage degeneration progresses. 13
In the present study, in which T2* relaxation time was evaluated by cartilage layer, a shortening of T2* relaxation time in the deep layer was observed in samples with angiogenesis. In OA, increased osteoclast activity causes a groove to extend from the subchondral bone into the articular cartilage, eventually crossing the tidemark and entering normally non-vascularized cartilage. It has been reported that angiogenesis passing across tidemarks is associated with local inflammation, loss of proteoglycan, and decreased load-bearing capacity of cartilage.26,27 UTE-T2* relaxation time of cartilage, reflecting the interaction between water molecules and collagen fibers, has been reported to be more sensitive than T2 mapping analysis, especially in the detection of early degeneration and the assessment of deep cartilage layers. 12 UTE-T2* mapping improves sensitivity to small changes in collagen fiber orientation in deep layers that are not captured by T2 mapping. Therefore, we speculate that the shortening of T2* relaxation times reflects a decrease in water content due to the loss of proteoglycans as cartilage degeneration progresses. T2* mapping analysis may be able to detect changes in cartilage layers, but further studies are needed.
Since OA worsens progressively over time, preventive treatment of OA can delay knee dysfunction. Consequently, a tool for diagnosing early OA is needed. In addition to detecting cartilage degeneration at an early stage, it is important to be able to evaluate the progression of OA objectively and over time as an indicator of OA progression. In the future, when new treatments such as regenerative medicine are applied, it is expected to become more important as a method to evaluate the effectiveness of such treatments. However, although MRI does not involve x-ray exposure, it is more expensive than radiography, so the interval between follow-up examinations should be considered.
There were several limitations to the present study. First, the sample size was small, efforts were made to collect more osteochondral fragment samples from each specimen to the extent possible. Second, the sample was lateral tibia of a medial OA, although histological evaluation and comparison could be performed. MRI showed that the cartilage morphology of the outer tibia was preserved, but the possibility of articular degeneration and inflammation could not be excluded. Third, histological evaluation of the control group was difficult due to ethical issues. Fourth, the ROI for the T2* relaxation time measurements was drawn manually. It is possible that each of the trisected ROIs does not reflect T2* relaxation times corresponding to the anatomical layering of cartilage. In a previous study on the thickness of each layer, it was reported that the deep layer corresponds to 30% of the subchondral bone and the intermediate layer to 55% above it. 28 However, the sample used in this study showed no cartilage loss on MRI, and cartilage thickness was preserved. We believe that the stratification of the deep and middle layers in this study was appropriate. However, error was minimized by referring to the original images. Despite these limitations, this is the first study to compare in vivo MRI UTE-T2* mapping by cartilage layers, and it may be useful as a noninvasive and objective method of assessment as an indicator of OA progression.
Conclusion
MRI UTE-T2* relaxation time was increased in early OA compared to the control group. UTE-T2* mapping is associated with histologic degeneration of cartilage and may detect early OA and cartilage layer changes.
Supplemental Material
sj-docx-1-car-10.1177_19476035231205685 – Supplemental material for Ultra-Short Echo Time–MRI T2* Mapping of Articular Cartilage Layers Is Associated with Histological Early Degeneration
Supplemental material, sj-docx-1-car-10.1177_19476035231205685 for Ultra-Short Echo Time–MRI T2* Mapping of Articular Cartilage Layers Is Associated with Histological Early Degeneration by Rui Imamura, Atsushi Teramoto, Yasutaka Murahashi, Yohei Okada, Shinichiro Okimura, Yoshihiro Akatsuka, Kota Watanabe and Toshihiko Yamashita in CARTILAGE
Footnotes
Acknowledgments and Funding
The author(s) received no financial support for the research, authorship, and/or publication of this article.
Declaration of Conflicting Interests
The author(s) declared no potential conflicts of interest with respect to the research, authorship, and/or publication of this article.
Ethical Approval
The study was approved by the clinical research review board at Sapporo Medical University Hospital (312-93).
References
Supplementary Material
Please find the following supplemental material available below.
For Open Access articles published under a Creative Commons License, all supplemental material carries the same license as the article it is associated with.
For non-Open Access articles published, all supplemental material carries a non-exclusive license, and permission requests for re-use of supplemental material or any part of supplemental material shall be sent directly to the copyright owner as specified in the copyright notice associated with the article.