
Abstract
Objective
To characterize dual-energy computed tomography (DECT) changes depicting hyaline cartilage changes in gout patients with and without osteoarthritis (OA) and in comparators without gout.
Design
Patients with suspected crystal-associated arthropathy were enrolled and underwent bilateral DECT scans of the knees. Standardized regions of interest were defined in the femorotibial hyaline cartilage. Five DECT parameters were obtained: CT numbers in Hounsfield units (HU) at 80 and 140 kV, the electron density (Rho), the effective atomic number (Zeff), and the dual-energy index (DEI). Zones were compared between patients with gout, with and without knee OA, and between patients with gout and comparators without gout, after adjustment for confounders.
Results
A total of 113 patients with gout (mean age 63.5 ± 14.3 years) and 15 comparators without gout (mean age 75.8 ± 11.5 years) were included, n = 65 (51%) had knee OA, and 466 zones of hyaline cartilage were analyzed. Older age was associated with lower attenuations at 80 kV (P < 0.01) and 140 kV (P < 0.01), and with Rho (P < 0.01). OA was characterized by lower attenuation at 140 kV (P = 0.03), but the lower Rho was nonsignificant after adjustment for confounders. In gout, hyaline cartilage exhibited lower Rho values (adjusted P = 0.04). Multivariable coefficients of association with Rho were −0.21 [−0.38;−0.04] (P = 0.014) for age, −4.15 [−9.0;0.7] (P = 0.093) for OA and 0.73 [−0.1;1.56] (P = 0.085) for monosodium urate volume.
Conclusion
Gout was associated with DECT-detected changes in cartilage composition, similar to those observed in older patients, with some similarities and some differences to those seen in OA. These results suggest the possibility of potential DECT biomarkers of OA.
Keywords
Introduction
Gout—the most common inflammatory form of arthritis—is secondary to monosodium urate (MSU) crystal deposition within joints and soft tissues, related to chronic hyperuricemia. 1 Its association with the most common type of arthritis—osteoarthritis (OA)—is being increasingly considered.2,3 Patients with gout exhibit more severe OA than controls and are at higher risk of needing total knee replacement, suggesting a potential role of MSU crystals in accelerating OA processes.4,5
Dual-energy computed tomography (DECT) is an efficient tool for the diagnosis of gout and for monitoring MSU deposition during follow-up of patients receiving urate-lowering therapy (ULT), though it is rarely used routinely in clinical practice due to cost and availability.6 -9 Unlike conventional computed tomography (CT), which measures X-ray attenuation at a single level of energy, DECT uses 2 levels of energy, usually 80 and 140 kV, and gives 5 common parameters that are useful in identifying the chemical composition of tissues being imaged: attenuation (expressed in Hounsfield units, HU) measured at 80 and 140 kV, effective atomic number (Zeff), electron density (Rho), and dual-energy index (DEI). 10 The photoelectric effect predominates at low energies and strongly relates to the chemical composition of the tissue exposed to the energetic beam, providing an averaged atomic number of the considered voxel (Zeff). The higher the atomic number of the compound under study (e.g., calcium), the more sensitive it is to the photoelectric effect. 11 Compton scattering predominates at high energies and is related to tissue volumetric mass. This provides an assessment of the electron density (Rho) of the considered voxel. The DEI provides information combining the photoelectric effect, predominantly, and Compton scattering, to a lesser extent. DEI can be used to discriminate types of calcium crystals.12,13 DECT can identify MSU crystals because of their specific biochemical signature and thus enables a quantitative assessment of MSU deposition based on the abovementioned parameters. Conventional CT is unable to provide such quantitative information. Typically, MSU deposits have a low atomic number and their presence has a neutral impact on the photoelectric effect while increasing the tissue volumetric mass, resulting in the same Zeff as surrounding soft tissue, but with an increased Rho. Whereas the sensitivity of DECT detection of MSU deposits in soft tissues is now well established, the ability of DECT to detect intra-articular MSU crystal deposits, presumably those potentially involved in OA pathogenesis, has not been studied.14,15 To date, ultrasonography (US) is the only technique capable of identifying significant MSU deposition in intra-articular cartilage, visualized by the double contour (DC) sign that disappears with urate depletion.16,17 So far, efforts to achieve DECT detection of intra-articular MSU crystal deposits other than massive tophi have been unsuccessful, 18 and the frequent MSU-coded meniscal deposits observed are considered to be artifacts since menisci have DECT attenuation properties similar to those of MSU. Furthermore, while DECT has shown its ability to detect the biochemical signature of meniscal and cartilage changes induced by the presence of calcium crystals, potential changes induced by MSU crystals in gout have not been studied. Furthermore, it is unknown whether or not DECT can characterize cartilage changes associated with OA occurring in patients with gout.11,13
The aims of the study were to characterize DECT depiction of changes in knee hyaline cartilage occurring in patients with gout compared to patients without gout, and to compare the biochemical signatures of hyaline cartilage in gout patients with and without concomitant OA. A secondary objective was to determine whether patients exhibiting the US DC sign signaling the presence of large intra-articular MSU deposits have hyaline cartilage DECT attenuation parameters different from gout patients not exhibiting the DC sign.
Methods
In Vivo Assessment of Knee MSU Deposition
Patients
From April 2016 to November 2018, we prospectively enrolled patients with suspected acute or chronic crystal-associated arthropathy in the CRYSTALILLE inception cohort. All underwent DECT and US examinations of the knees, within a maximal 2-week interval.
Patients fulfilling the American College of Rheumatology (ACR)/European League Against Rheumatism (EULAR) 2015 criteria 7 for the diagnosis of gout were assigned to the gout group; patients not fulfilling these criteria were assigned to the comparator group defined as including patients not having gout but having suspected symptoms of crystal-related arthropathy. Additional details on the cohort design are reported elsewhere. 19 This study was approved by a French national review board (Comité de Protection des Personnes [CPP] protocol number 2020-045B, EudraCT clinical trial number 2020-A01269-30) and patients provided informed consent.
US assessment
Examinations were performed by 2 trained musculoskeletal radiologists (JFB and JL) using an Aplio 400 US machine (Canon Medical Systems, Tochigi, Japan) with a 12-MHz probe. The DC sign was assessed on the patellofemoral joint using a suprapatellar short axis view with the knee in maximal flexion. 20 The DC sign was defined as an echogenic line on the outer surface of the joint cartilage parallel to the subchondral bone.21,22 Patients with knees positive for the DC sign were assigned to the DC+ group, the others to the DC− group. All scans classified as DC+ were reviewed and collectively confirmed on recorded images by CM, JL, and JFB.
DECT protocol
DECT scans were performed using a single-source CT system (Somatom Definition Edge; Siemens Healthineers). The 2 knees were scanned simultaneously using a previously described clinical DECT protocol, 11 the main features of which are tube potentials, 80 and 140 kV; tube current-time products, 125-216 and 30-55 mAs, respectively; beam collimation, 128 × 0.6 mm; pitch, 0.7. Images were reconstructed at a 0.75/0.2-mm-section thickness/overlap.
Analysis of DECT images
DECT images were postprocessed using the DE Rho/Z software (Syngo.via VB10B; Siemens Healthineers). Two observers (CM and JL) selected standardized regions of interest (ROIs) on a predefined standardized coronal slice in the center of the joint in the sagittal plane, in each lateral and medial compartment of femorotibial hyaline cartilage on grayscale DECT images (encompassing both femoral and tibial cartilage in the same ROI), that were then copied-pasted on DE Rho/Z maps ( Fig. 1 ). This single standardized coronal slice was chosen because it offered the largest surface of weight-bearing cartilage where OA changes are likely to occur, and for feasibility reasons due to the time-consuming nature of the procedure. For each ROI, we recorded 5 DECT attenuation parameters: CT numbers (in HU) at 80 (low) and 140 (high) kV, with the corresponding DEI, and the derived Rho and Zeff. ROIs containing chondrocalcinosis on grayscale images visible on the standardized coronal slice were excluded from the analysis for their known effect on DECT attenuation parameters. 13 The presence of chondrocalcinosis on grayscale images outside the predefined ROIs was noted. The presence or absence of OA—defined by the presence of osteophytes, definite narrowing of joint space and/or subchondral sclerosis, which corresponds to grades 2 to 4 of the Kellgren-Lawrence scale—was noted on grayscale images and determined patient assignment to having or not having OA (OA+ or OA−) ( Fig. 2 ).
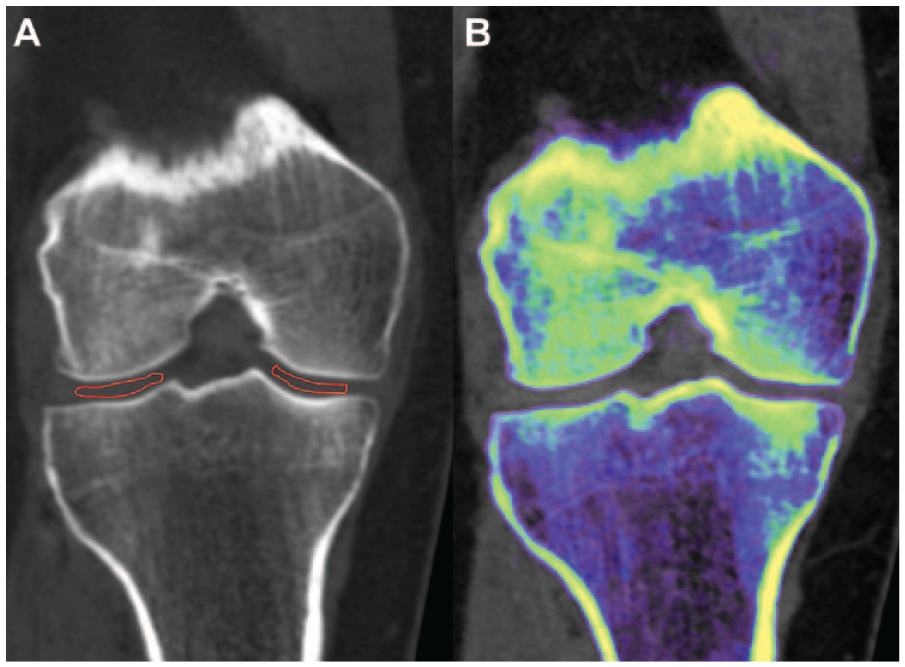
Regions of interest (ROIs) of hyaline cartilage drawn on knee scans. (A) Conventional grayscale computed tomography images with ROI drawn in the femorotibial cartilage and (B) corresponding color-coded images obtained with RH/Z software.
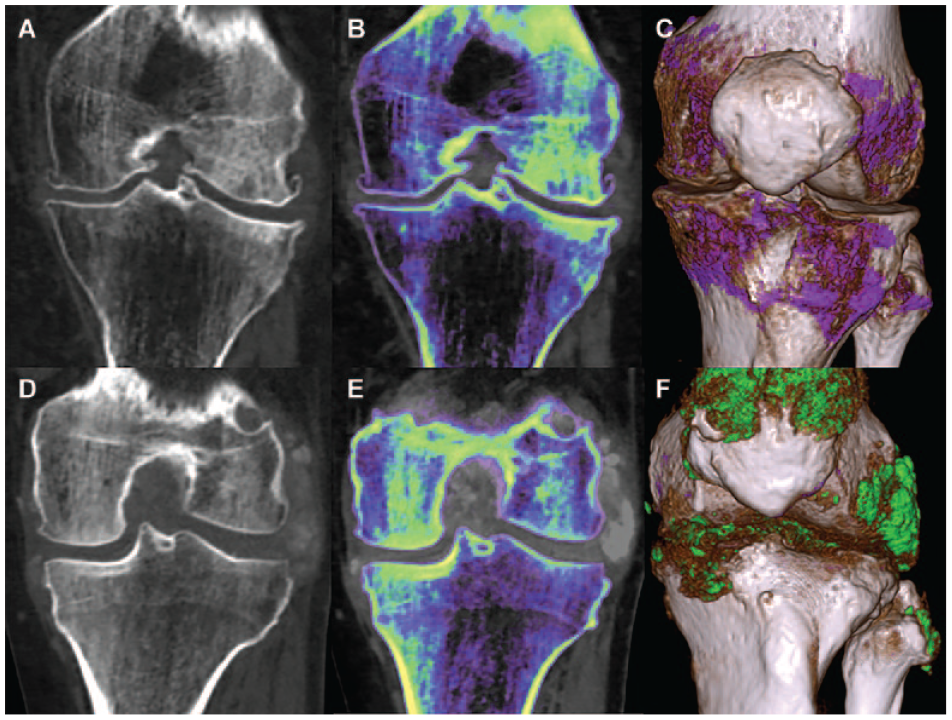
Dual-energy computed tomography scans of knee. (A-D) Conventional grayscale computed tomography images, (B-E) corresponding color-coded images obtained with RH/Z software and (C-F) with gout software. Presence of osteophytes and joint space narrowing in a patient with osteoarthritis (A-C). Periarticular crystal deposits and bone erosion in a patient with gout (D-F).
In Vitro Study: DECT Parameters of Different MSU Concentrations
We used phantoms (Computerized Imaging Reference Systems, Norfolk, VA) composed of 2 rods of MSU (200 and 600 mg/ml), water, and 1 rod of MSU-free resin (referred to as MSU 0 phantom). All phantoms were scanned simultaneously with the acquisition parameters described above. Four 0.5-cm2 ROIs were drawn on 3 consecutive slices of each phantom to obtain the same 5 DECT parameters.
Statistical Analysis
Data were analyzed using R software (version 3.4.2; R Foundation for Statistical Computing, Vienna, Austria). Qualitative variables were reported as numbers (%), while quantitative variables as mean ± standard deviation (SD). In vitro, phantoms with high versus low MSU concentrations were compared using the Mann-Whitney-Wilcoxon test.
Patient characteristics between groups of interest were compared using Student t or Wilcoxon-Mann-Whitney tests and chi-square or Fisher exact tests, where appropriate.
Linear mixed models were used to compare DECT parameters first between OA+ and OA− groups among patients with gout, second between patients with gout and comparators without gout, and finally between DC+ gout patients and the comparator group. Each model included adjustments on the variables which differed between groups in bivariable testing. The patient was included in random effects to consider hierarchical structure. Model validation was assessed graphically using residuals (normality and homoscedasticity). When conditions were not satisfied even after log-transformation, permutation tests were implemented. The statistics obtained from the initial data were then compared with this distribution to estimate a P value. P values were corrected within each DECT using Holm’s technique. If a DECT parameter value among Zeff, Rho, and DEI was to be found associated with gout and/or OA, independent associations with the parameter and covariables were assessed by linear mixed models explaining the DECT parameter and integrating each covariable one-by-one in fixed effects. Patients were considered in random effects as multiple cartilage ROIs were used for each patient. Relevant variables with P < 0.2 were integrated in the multivariable model to calculate adjusted results. The regression conditions were checked for each model.
The significance level was set at 5%.
Results
DECT Discrimination of Increasing MSU Crystal Concentrations Through Increasing Rho Values in Vitro
Phantoms exhibited increasing Rho values (P = 0.03) as well as CT numbers at 80 kV (P = 0.03) and 140 kV with increasing MSU concentrations. Neither Zeff (P = 0.88) nor the DEI (P = 0.89) varied significantly with MSU concentrations.
For the high MSU concentration phantom (600 mg/ml), mean ± SD Zeff was 6.8 ± 0.2, mean Rho 220.5 ± 11.6, mean CT number at 80 kV 179.4 ± 4.5, mean CT number at 140 kV 201.1 ± 6.1, and mean DEI −0.0091 ± 0.0031.
For the low MSU concentration phantom (200 mg/ml), mean ± SD Zeff was 6.8 ± 0.1, mean Rho 105.1 ± 2.2, mean CT number at 80 kV 66.7 ± 5.9, mean CT number at 140 kV 84.0 ± 2.7, and mean DEI −0.0081 ± 0.002. Significantly different parameters characterized MSU crystal concentrations: Rho (P = 0.03), CT number at 80 kV (P = 0.03), and CT number at 140 kV (P = 0.03) ( Fig. 3 ).
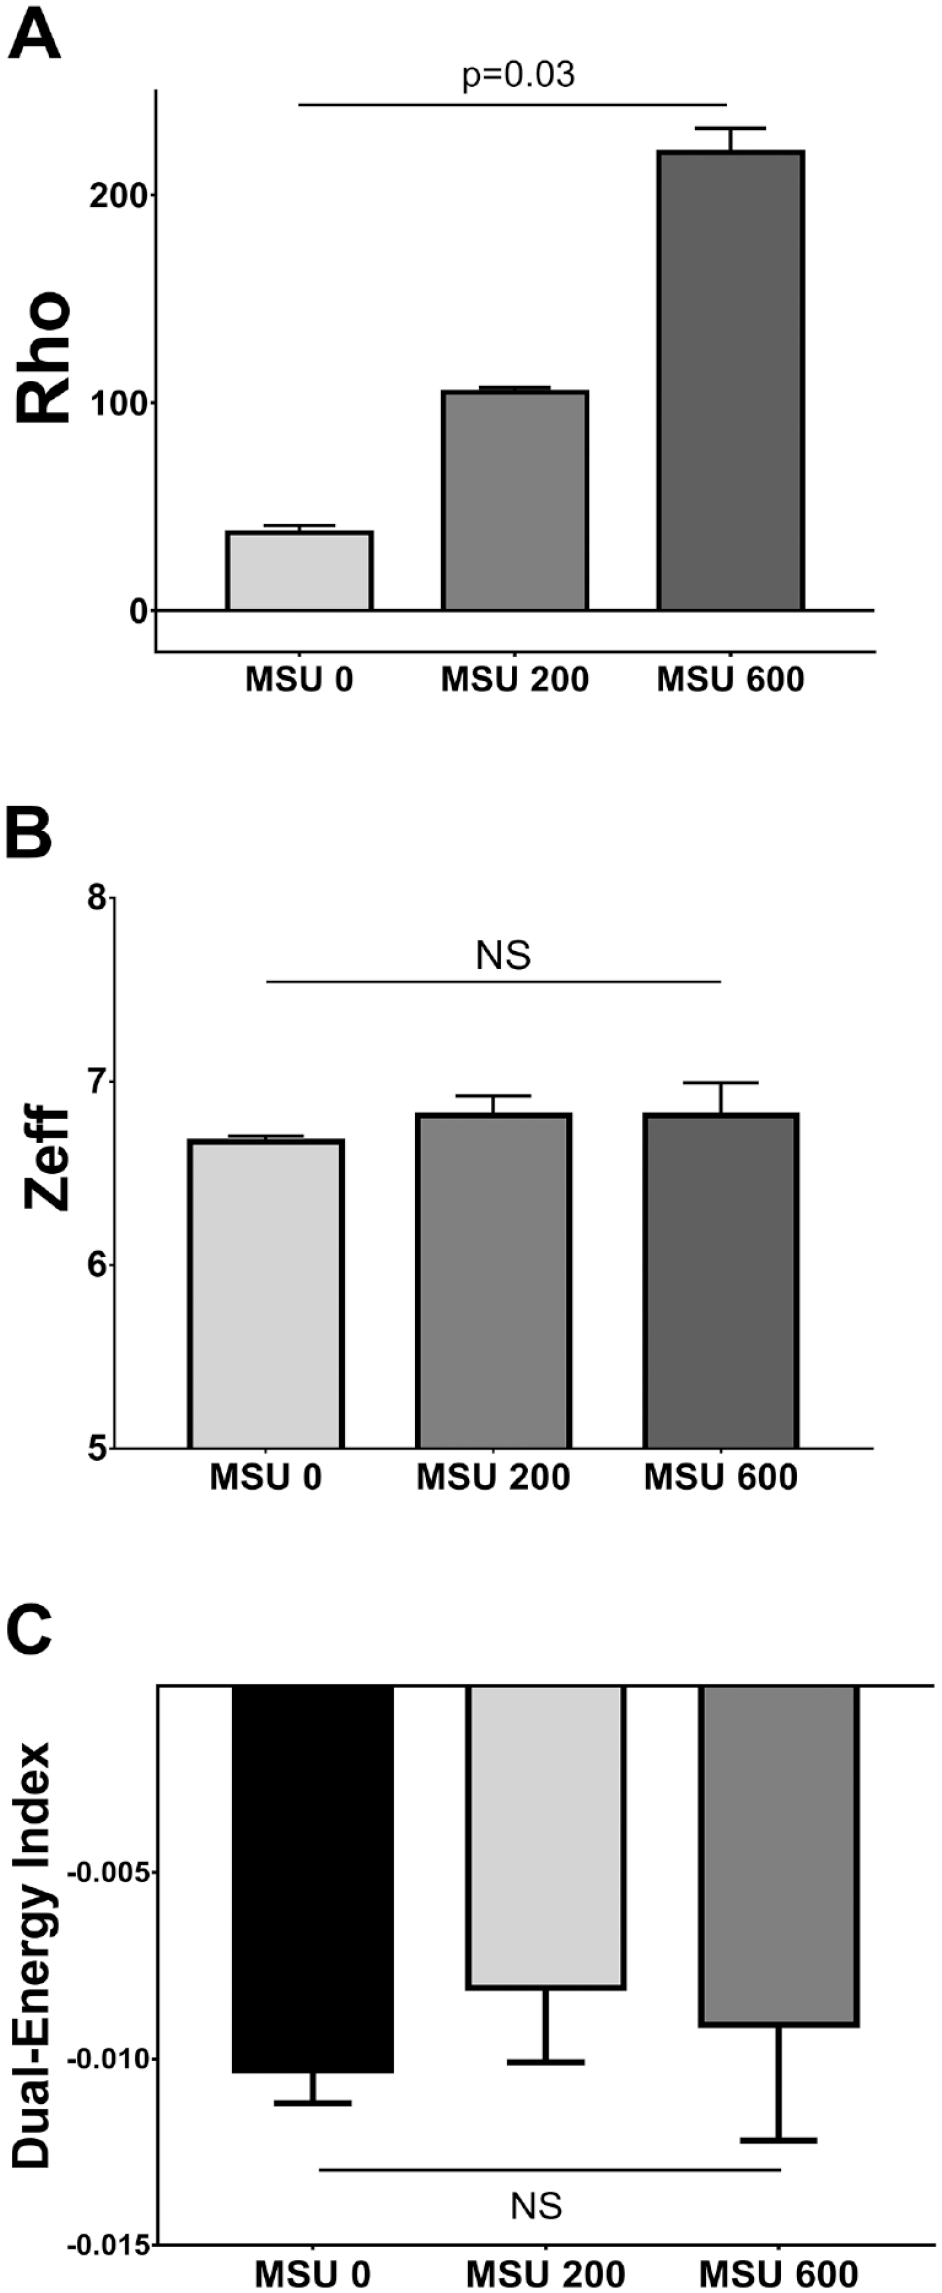
DECT values of (A) Rho, (B) Zeff, and (C) dual-energy index of phantoms of increasing MSU concentrations compared with resin and water. DECT dual-energy computed tomography, Rho electron density, Zeff effective atomic number, MSU monosodium urate (0, 200, and 600 concentrations in mg/ml). DECT = dual-energy computed tomography; MSU = monosodium urate.
In Vivo Assessment of Modifications in DECT Parameters in OA and Gout
Study sample
A total of 141 patients were initially assessed, 13 of whom were excluded because they did not have both US and DECT examinations in the predefined time frame: 113 had gout and 15 were in the comparator group. The mean age of the study sample was 65 ± 14.5 years (63.5 ± 14.3 years in the gout group, 75.8 ± 11.5 years in the OA group). The gout group was composed of 97 men and 16 women; the OA group was composed of 6 men and 9 women. A total of 466 hyaline cartilage ROIs were included in the analysis, 44 ROIs were excluded because of the presence of chondrocalcinosis on the standardized slice, and 2 ROIs were excluded because joint space narrowing prevented defining the ROI ( Fig. 4 ). The characteristics of the study sample are detailed in Table 1 . Patients in the comparator group mainly had calcium pyrophosphate deposition (CPPD) disease (n = 11), psoriatic arthritis (n = 2), polymyalgia rheumatica (n = 1), and OA alone (n = 1). Across the entire sample, 65 (51%) of patients had knee OA. Gout duration was on average 8.9 ± 9.7 years and mean serum urate was 7.3 mg/dl. When compared with gout patients without the US DC sign, patients with at least 1 knee with the US DC sign had serum urate levels of 8.4 ± 2.6 mg/dl versus 7.0 ± 2.1 mg/dl (P = 0.03), volumes of urate deposition 3.9 ± 6.5 cm3 versus 0.4 ± 1.8 cm3 (P < 0.001), and tophi-positive US 76.9% versus 48.3% (P = 0.02). Characteristics of patients and subgroups (with and without OA, with and without the DC sign) are detailed in Table 1 .
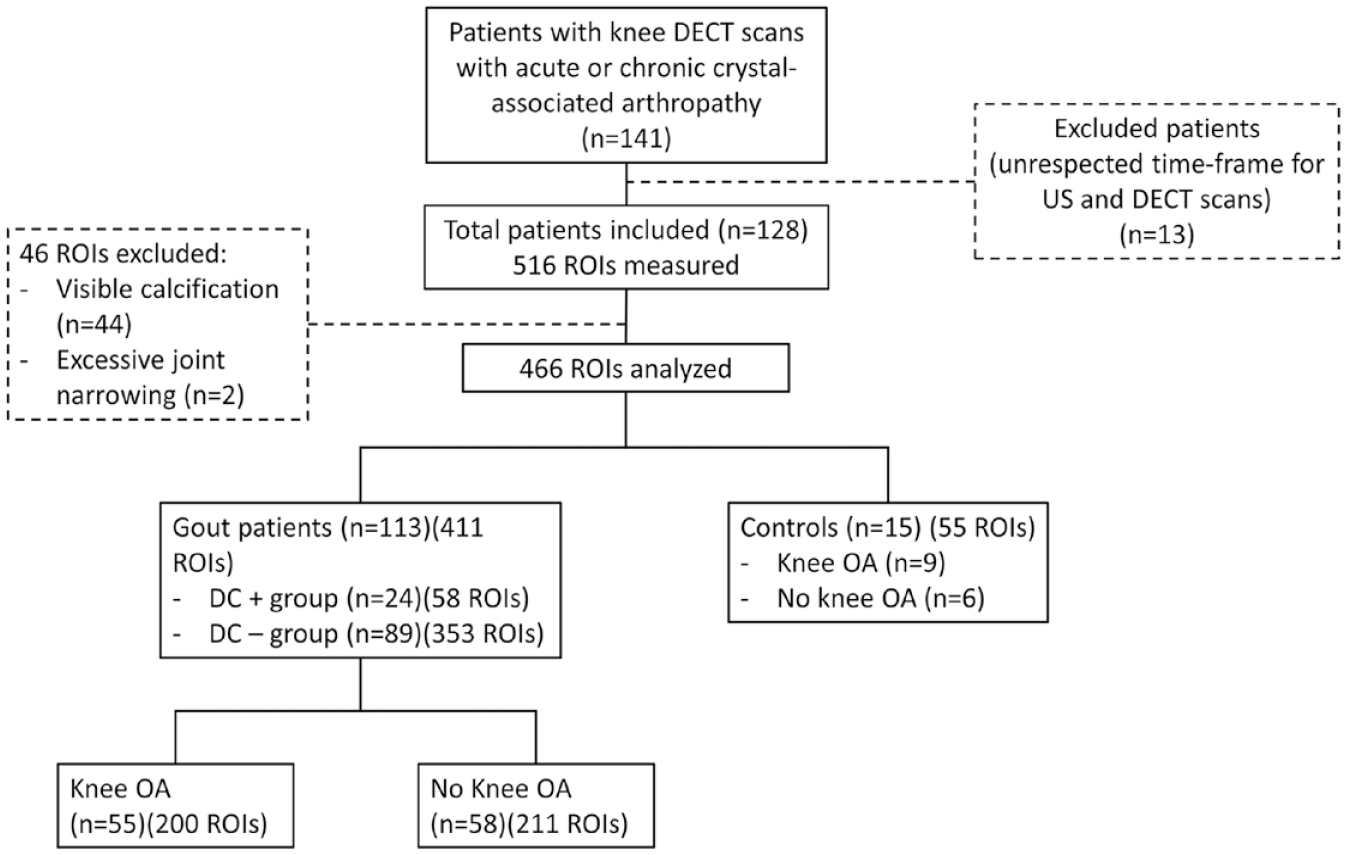
Study flowchart. ROI = region of interest; US = ultrasonography; DECT = dual-energy computed tomography; DC+ = presence of US double contour sign; DC- = absence of US double contour sign; OA = osteoarthritis.
Characteristics of the Study Population and of Gout Patients With and Without OA, and With and Without A US Double Contour Sign.
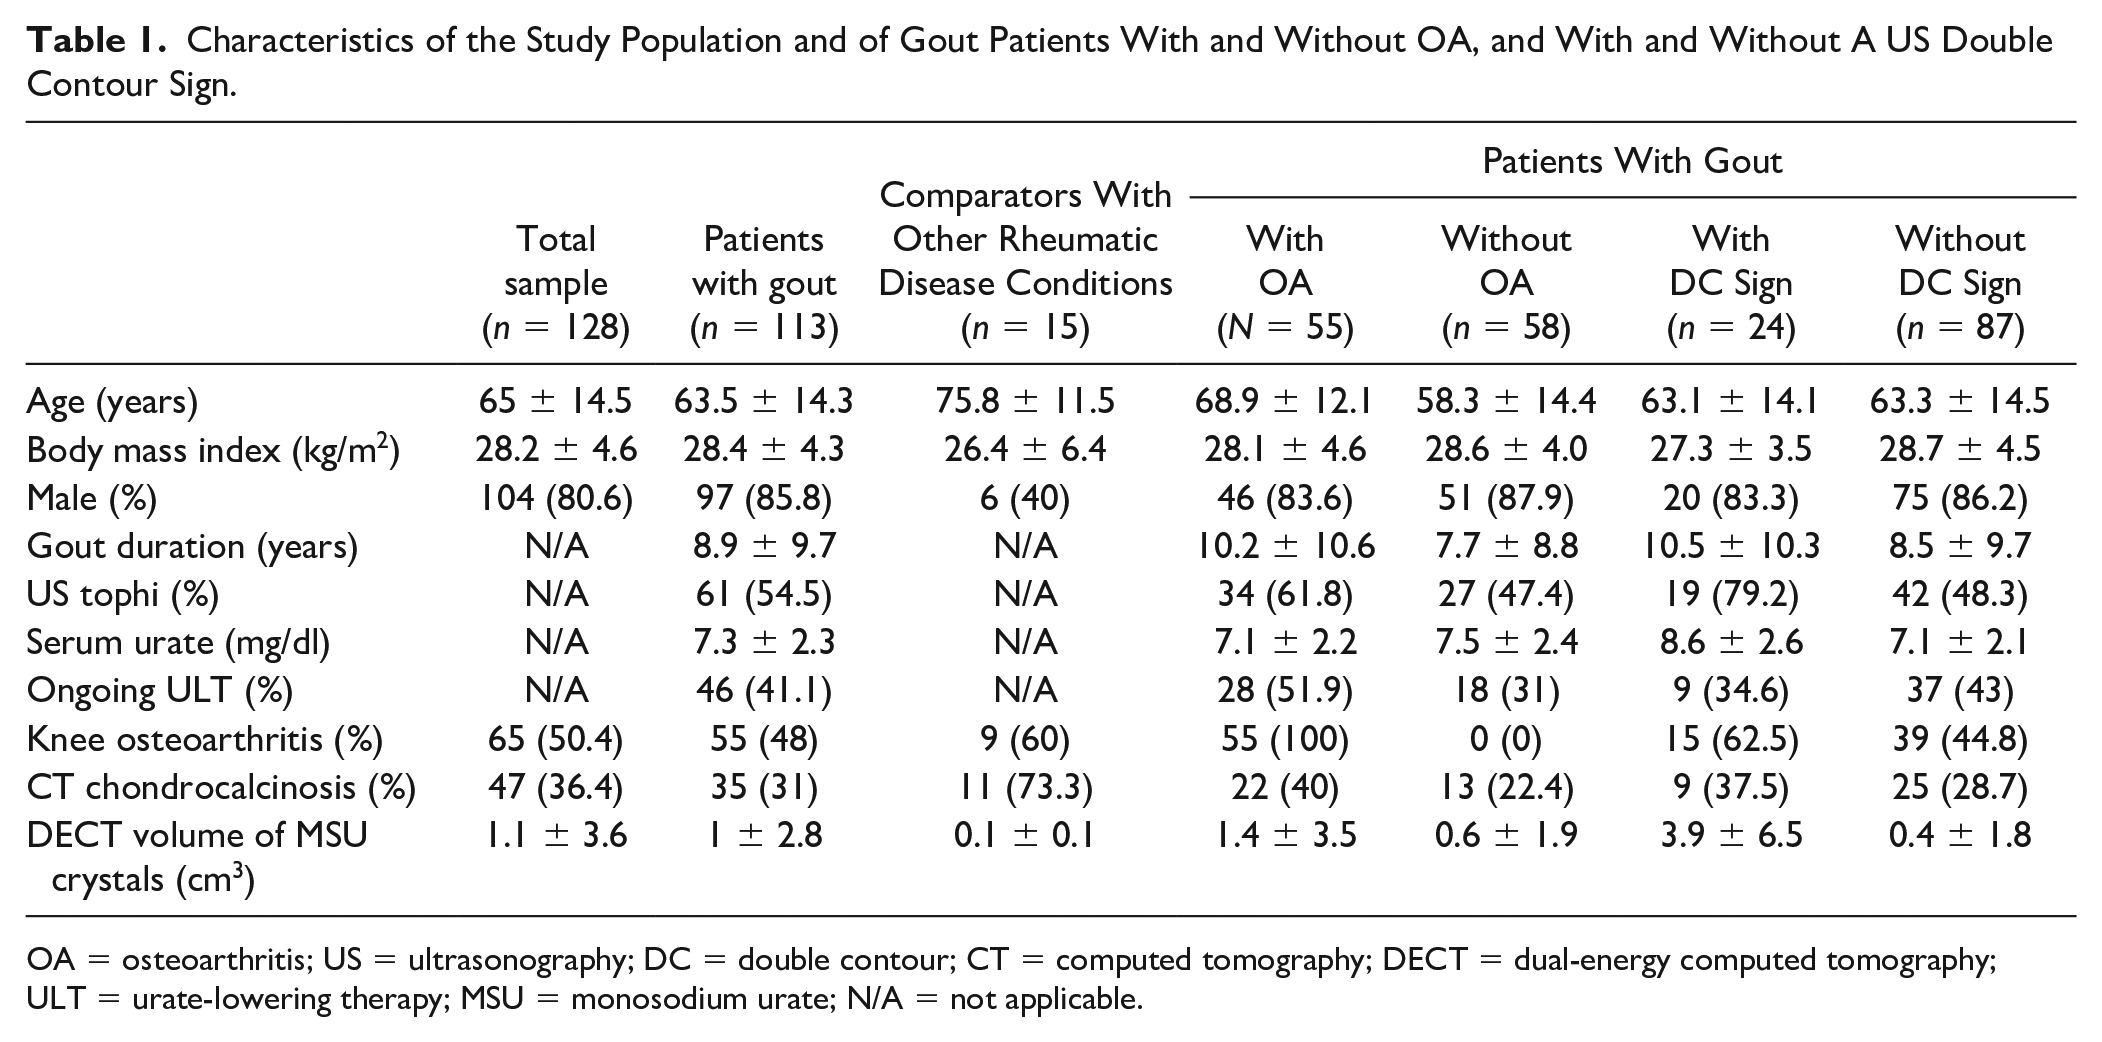
OA = osteoarthritis; US = ultrasonography; DC = double contour; CT = computed tomography; DECT = dual-energy computed tomography; ULT = urate-lowering therapy; MSU = monosodium urate; N/A = not applicable.
OA associated with lower Rho and attenuation values at 140 and 80 kV in knee hyaline cartilage of patients with gout, mainly mediated by age
Among the 113 patients with gout, 55 patients had knee OA and 58 did not. Patient characteristics of the 2 subgroups are compared in Suppl. Table S1. Age (P < 0.001), volume of MSU crystal deposition (P < 0.05), ongoing ULT (P < 0.05), presence of chondrocalcinosis outside ROIs (P = 0.07), and positive DC sign (P = 0.06) differed between groups with P values <0.2 and were adjusted for in the linear mixed model. Of note, body mass index did not differ significantly between patients with and without OA (P = 0.29) and was not included in the model. DECT parameters for each group are presented in Table 2 with their unadjusted and adjusted P values. While attenuations at 80 and 140 kV, and Rho, were significantly lower in univariable analysis (P < 0.01, P < 0.01, and P < 0.05, respectively), only the attenuation at 140 kV remained significantly modified after adjustment (P = 0.03). Neither Zeff nor DEI values were associated with OA or age.
Comparison of Values of DECT Parameters Between OA+ and OA− Groups in Patients With Gout.
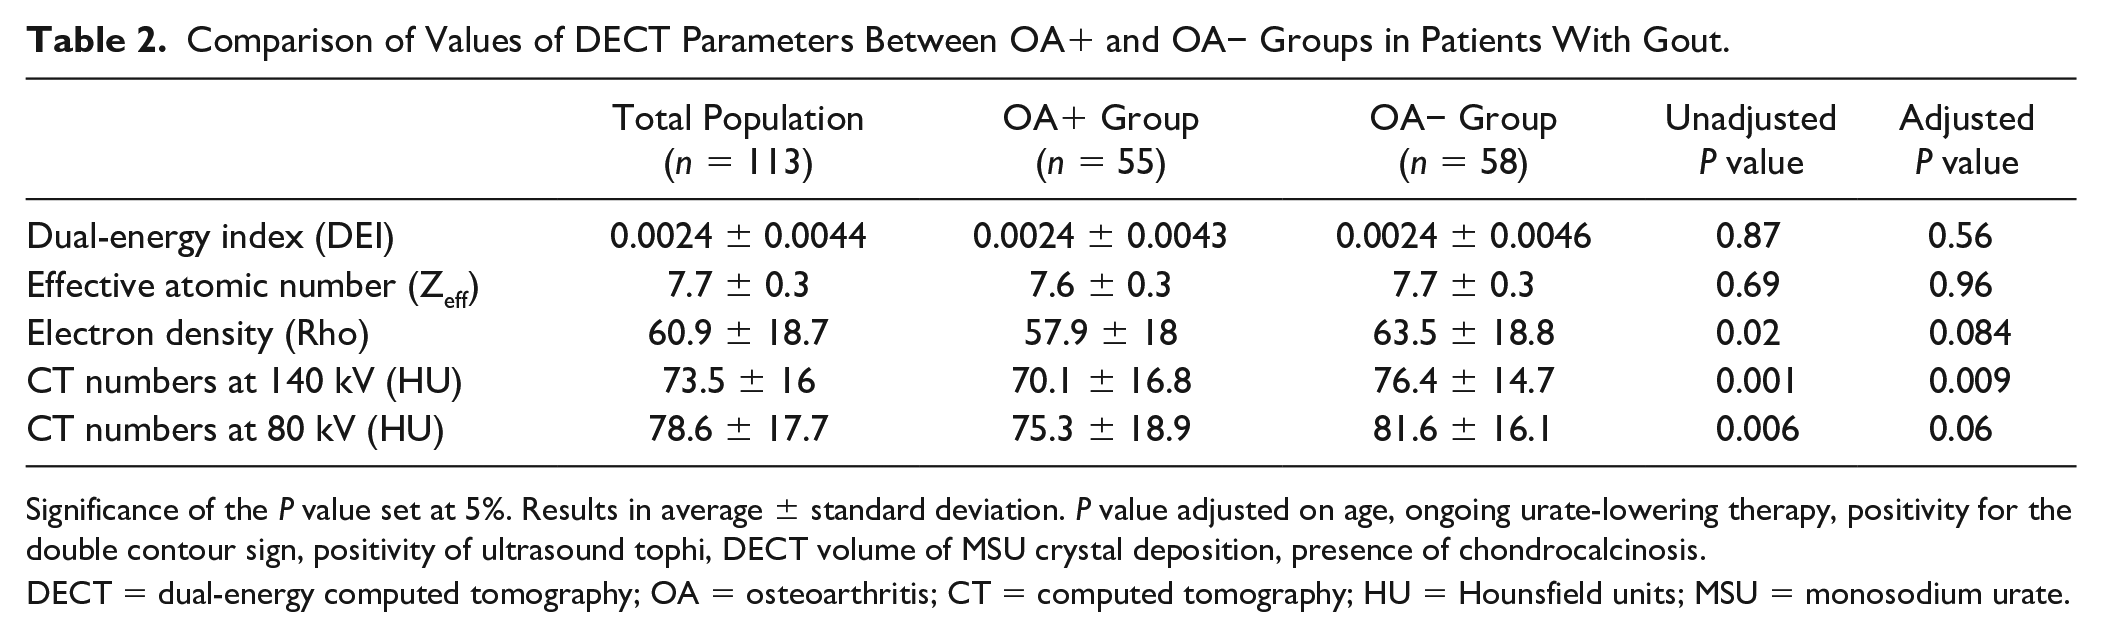
Significance of the P value set at 5%. Results in average ± standard deviation. P value adjusted on age, ongoing urate-lowering therapy, positivity for the double contour sign, positivity of ultrasound tophi, DECT volume of MSU crystal deposition, presence of chondrocalcinosis.
DECT = dual-energy computed tomography; OA = osteoarthritis; CT = computed tomography; HU = Hounsfield units; MSU = monosodium urate.
In the multivariable model, age was the only variable exhibiting an independent association with lower attenuations at 80 kV (P < 0.01) and 140 kV (P < 0.01) and with Rho (P < 0.01).
Lower Rho values for knee hyaline cartilage in gout patients than in comparators
Rho values recorded in the knees of the 15 individuals in the comparator group were compared to those recorded in the 113 patients with gout. Patient characteristics of the 2 groups are detailed in Table 1 . Age (<0.001), gender ratio (P < 0.001), and presence of chondrocalcinosis outside ROIs (P < 0.01) differed between groups and were adjusted for in the linear mixed model. DECT parameters for each group are presented in Table 3 with their unadjusted and adjusted P values. After adjustment, hyaline cartilage from gout patients exhibited lower Rho values than hyaline cartilage from comparators (P = 0.04). When comparing only the 24 patients with extensive MSU deposition on the cartilage surface based on a positive US DC sign to the comparator group, Rho values were similar between groups with values of 63.4 ± 21.8 and 64.6 ±19.8, respectively (adjusted P = 0.23) (Suppl. Table S2). Neither Zeff nor DEI values were associated with any of the variables, including gout.
Comparison of Values of DECT Parameters Between Patients With Gout and Comparator Group.
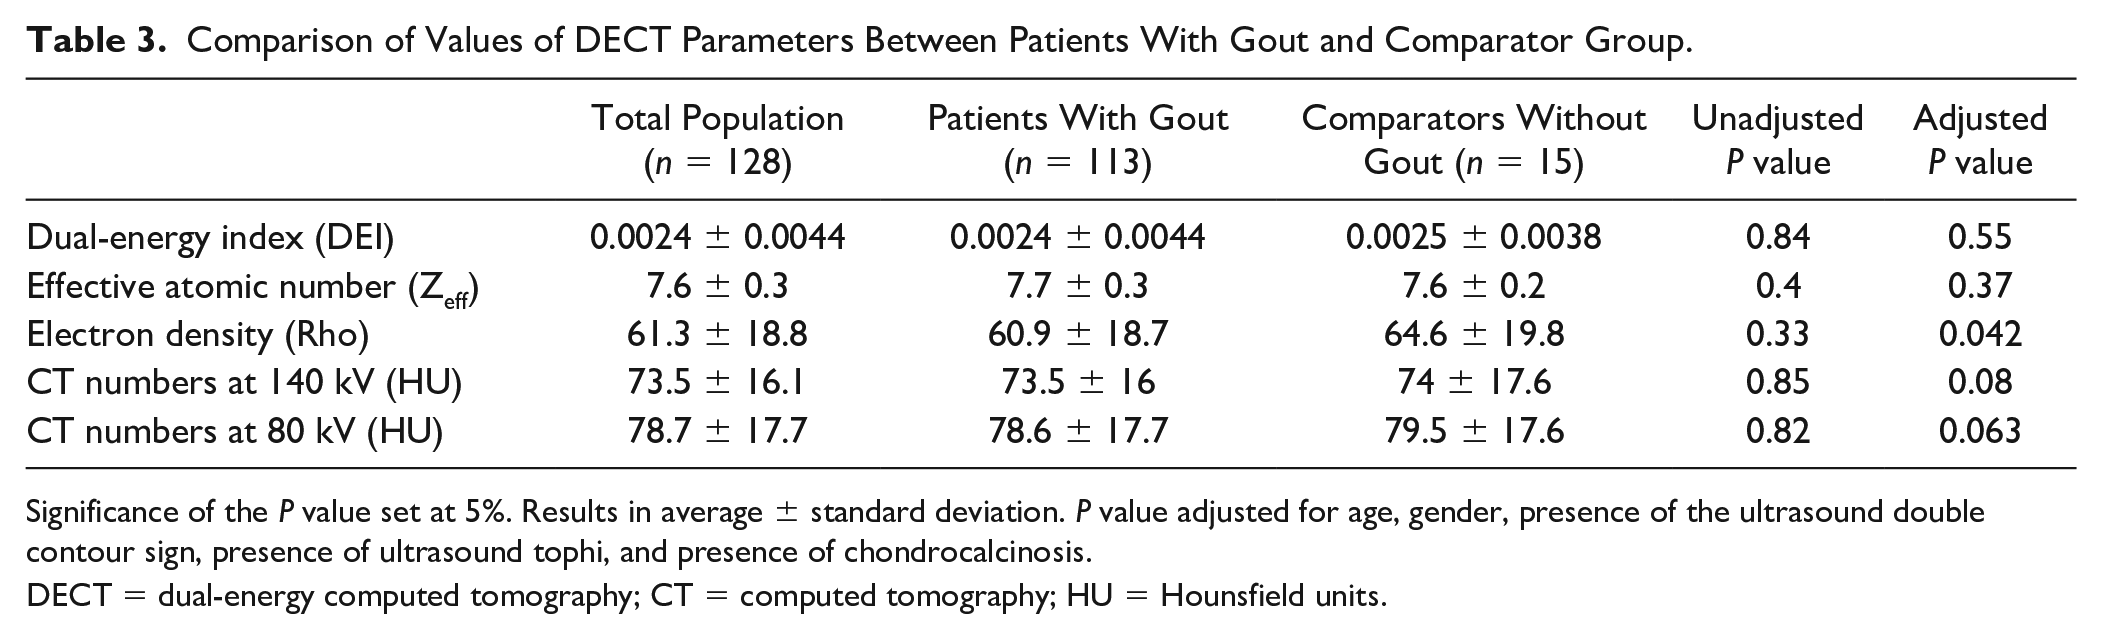
Significance of the P value set at 5%. Results in average ± standard deviation. P value adjusted for age, gender, presence of the ultrasound double contour sign, presence of ultrasound tophi, and presence of chondrocalcinosis.
DECT = dual-energy computed tomography; CT = computed tomography; HU = Hounsfield units.
In the overall sample, only one variable significantly associated with changes in Rho: age
Rho in hyaline cartilage was identified in the previous step as the DECT parameter that could change with age, OA, and/or gout. Associations between Rho hyaline cartilage values and OA/gout-relevant parameters were tested in bivariable and multivariable analyses ( Table 4 ). Age and knee OA both exhibited a significant negative association with Rho values (P = 0.0017 and 0.017, respectively) and the volume of periarticular MSU crystals measured with DECT was positively associated with Rho values (P = 0.19). All 3 of these variables were included in the multivariable model. The negative association of age with hyaline cartilage Rho value was the only one to remain statistically significant: multivariable coefficient of association = −0.21 [−0.38; −0.04] (P = 0.014) ( Table 4 ).
Bivariable and Multivariable Associations With Values of Electron Density (Rho) of Knee Hyaline Cartilage in the Entire Sample (n = 128).
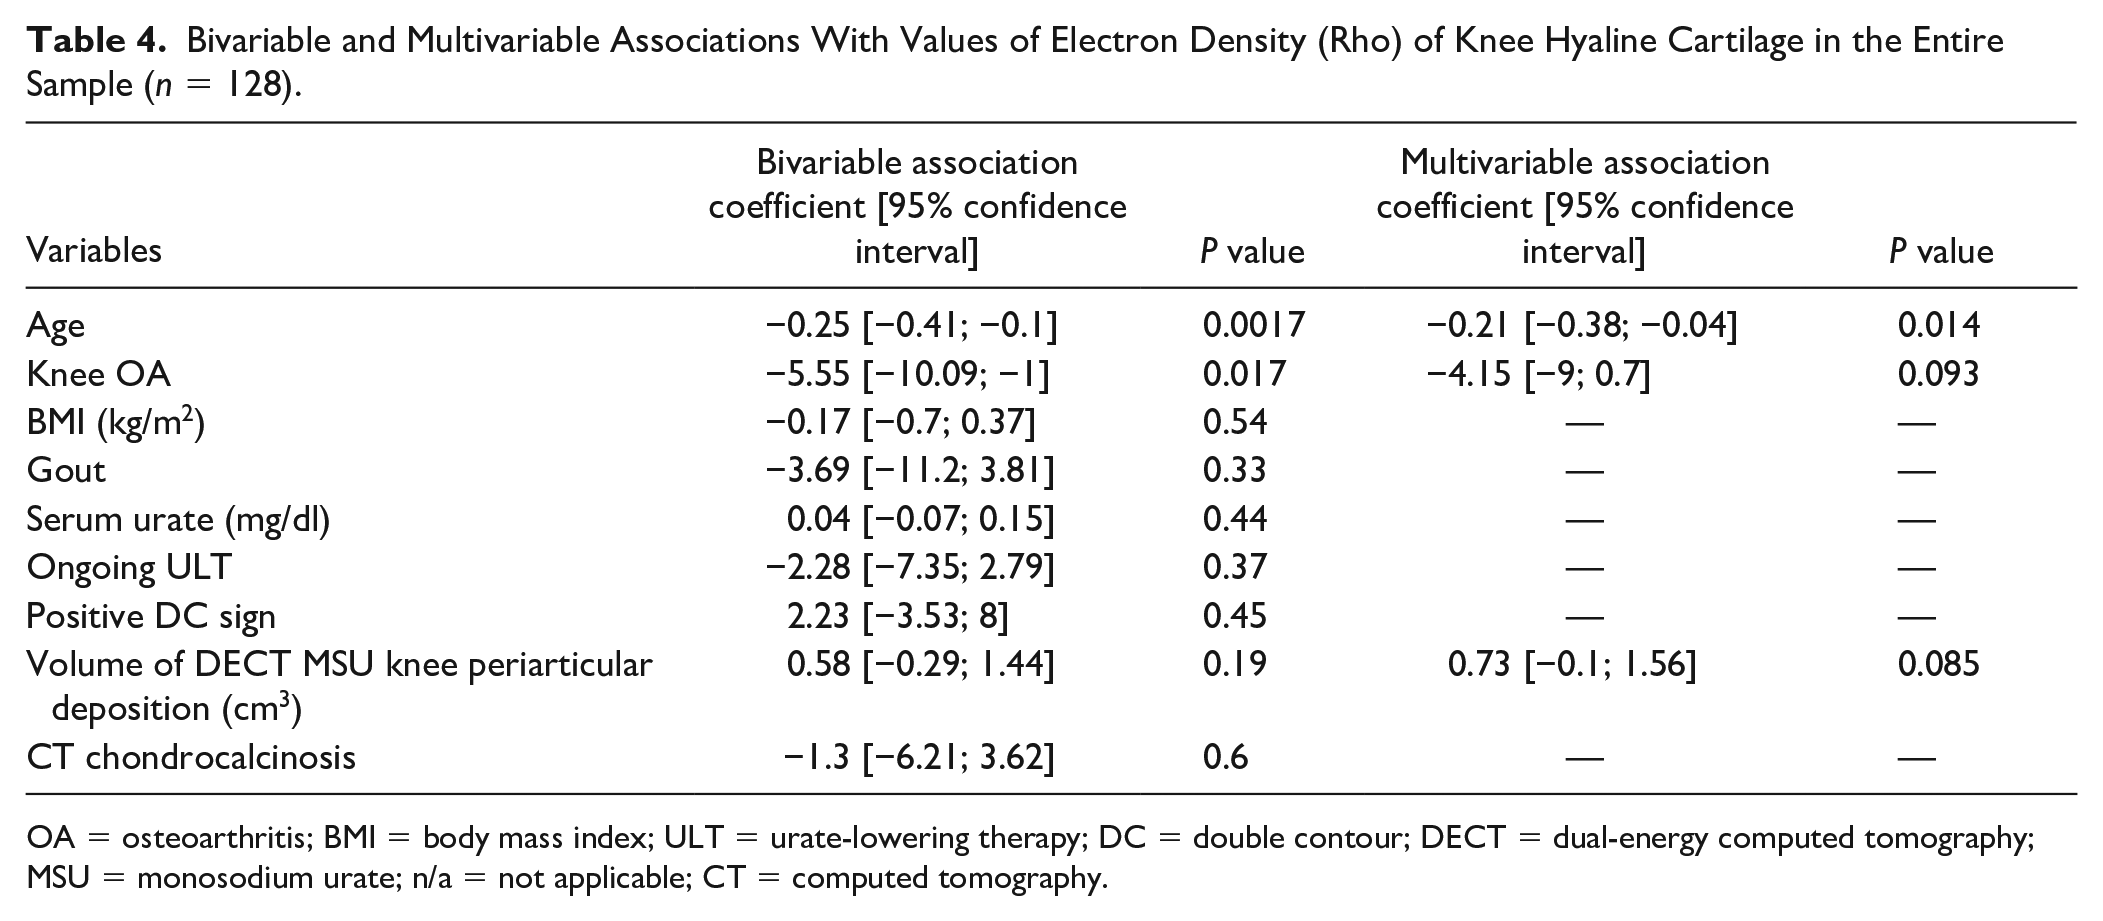
OA = osteoarthritis; BMI = body mass index; ULT = urate-lowering therapy; DC = double contour; DECT = dual-energy computed tomography; MSU = monosodium urate; n/a = not applicable; CT = computed tomography.
Discussion
This study demonstrated that lower values for DECT parameters in knee hyaline cartilage were associated with older age in both gout and OA patients. In patients with gout, the only DECT parameter that changed was electron density: cartilage Rho was lower. In cases of greater US-detected MSU crystal deposition on the cartilage surface or in periarticular tissues, DECT assessment showed higher Rho values as expected from the in vitro phantom study, “hiding” the disease-related lower cartilage Rho values. The only parameter that seemed to discriminate between OA and OA-free cartilage among patients with gout was 140 kV attenuation that decreased, while the observed decrease in the OA cartilage Rho value appeared to be primarily related to older age, as shown by the whole-sample multivariable analysis. Older age appeared to be the one condition associated with the most substantial changes in knee hyaline cartilage DECT parameters, with significant decreases observed in Rho, but also in attenuations at 80 and 140 kV.
Gout was associated with a decrease in the electron density, Rho, of knee hyaline cartilage similar to what is also observed with older age. There is an increasing body of evidence of a reciprocal relationship between gout and OA, but the nature of the relationship remains hypothetical. 3 Both clinical DECT and cadaveric studies have reported that the joint damage observed in OA is very similar to that seen in the presence of MSU crystals.23,24 A survey with clinical confirmation performed in the United Kingdom suggested that knees affected with gout flares were 3 times more likely to be the site of OA as well. 25 Conversely, cartilage damage in OA could be associated with increased MSU crystal deposition by promotion of crystallization and the inflammatory response to the presence of MSU crystals. 26 In contrast to rheumatoid arthritis in which joint damage is closely related to inflammation, 27 one of the major questions in gout is whether disease-related OA-like cartilage damage is induced by enhanced local inflammation and/or whether gout induces catabolic reactions in chondrocytes in the manner of accelerated aging. 28 In our study, hyaline cartilage from gout patients shared changes in Rho values similar to those observed more markedly in aging, which could suggest that gout may accelerate catabolic reactions in chondrocytes. Although OA may be associated with some extent with lower Rho values, OA and gout were not associated with the same changes in DECT parameters, suggesting that modifications of cartilage composition and ultimately damage may occur via different pathways in the 2 diseases.
Electron density, Rho, also appears to be the key DECT parameter not only to detect but also to quantify MSU crystals. Significant intra-articular MSU crystal deposition may act as a confounder when using DECT to study cartilage modifications associated with gout/age and/or OA. Zeff plays a central role in discriminating MSU among other materials, especially calcium-containing crystals. 11 While MSU crystals affect Compton scattering (explaining most of the Rho value), they are not expected to modify photoelectric absorption (explaining most of the Zeff and DEI values). This contrasts with the effect of calcium-containing crystals, which is why in our in vitro study Zeff and DEI remained constant whatever the MSU concentration.10,13 Conversely, Rho significantly increases with MSU concentration as shown by our phantom study, which is the basis of the color-coded images classically obtained to exhibit the presence of MSU crystals on DECT images. Basically, algorithms used in postprocessing software consider that at constant Zeff, there is a cutoff Rho value above which any type of material is considered to contain MSU. So far, this method (adding up all voxels exceeding the threshold for MSU positivity) has been found pertinent for the assessment of overall MSU deposition volume, but not for the measurement of local MSU concentration/density which would require increasing thresholds of Rho values to obtain heatmaps of MSU crystal density. In our study, hyaline cartilage studied in DC+ knees exhibited a constant numerical increase in Rho (compared to DC− knees) that did not reach statistical significance, and most importantly did not reach the Rho threshold necessary for coding as MSU. Most likely, this would be related to the limited spatial resolution of DECT (600 µm in our protocols) which does not allow the detection of individual MSU crystals whose sizes range from 2 to 40 μm 29 and which do not aggregate as much as in extra-articular structures (tophi). Furthermore, it has been shown that small aggregates of MSU crystals in US-detected tophi (<2 mm) may not sufficiently affect DECT attenuation properties, which would explain the false-negative DECT results.10,30,31 In the clinical context of gout, these results suggest that DECT, unlike US, is unable to reliably detect significant loads of intra-articular MSU crystals. In the research setting examining the relationship between gout and OA, these results underline the importance of assessing the current MSU crystal load when measuring cartilage composition changes in gout. This is particularly so with DECT. US can be used to look for the DC sign in joints or to assess the volume of MSU crystals deposited in periarticular tissue, which in our study showed a strong trend of positive association with DECT Rho values.
In gout patients, DECT can recognize the signature of OA in hyaline cartilage, that is, decreased attenuation at 140 kV. DECT has the capacity to identify material decomposition, for instance, by examining the collagen content of tissues, which is particularly interesting when assessing changes in cartilage composed mainly of collagen and proteoglycans. 32 This principle has already been applied successfully to the study of knee ligaments.33,34 The observed decrease in the attenuation at high energies (140 kV) in our study may suggest some change in the photoelectric effect of the cartilage but needs to be further explored, in particular, its potential relationship with collagen and/or proteoglycan changes. The comparator group in our study was too small to determine whether this decrease also occurs in OA knees without gout. If confirmed, determining whether this pattern arises early in the development of knee OA and whether it could serve as a potential biomarker would be a challenging objective for future research. Our univariable analysis suggested decreased Rho values associated with OA, revealed to be largely explained by age at multivariable analysis. Further studies of various stages of OA severity would be interesting to determine whether Rho changes would be associated with certain OA stages only, with potential for being considered as a useful biomarker.
We acknowledge that our study has some limitations. First, the comparator group was small and included a variety of rheumatic disease conditions; a larger group with only OA patients would have been useful to examine changes in DECT parameters observed in OA patients without gout. Currently, however, indications for DECT scans in rheumatology patients remain limited to crystal-induced arthropathies: gout in clinical routine when the technique is available and calcium-containing crystal deposition diseases for research purposes.11 -13 Second, the comparator group was mainly composed of patients with CPPD. CPPD’s own relationship with cartilage modifications and OA is being actively studied, so the comparator group might be considered imperfect. Albeit, in previous work, we were able to demonstrate that CPPD modifies DECT parameters significantly when chondrocalcinosis is not visible, which corresponds to the prespecified requirements for including knees in the present analysis. 13 Furthermore, patients of our comparator group were significantly older than patients with gout and, as a result, could be more likely to expose the cartilage to age-related alterations which were, however, adjusted for in the linear mixed model. Third, the ideal gold standard for quantification of MSU crystal deposition on the hyaline cartilage would have been histological proof obtained from an exhaustive examination of all knee structures. This was not feasible as our patients did not undergo total knee replacement. The DC sign offers a reliable alternative that is widely used in the literature.21,35 Fourth, a false-positive US DC sign may have been detected in some patients leading to their misclassification. US signs are knowingly operator-dependent. The OMERACT working group has shown that the reliability of the US DC sign is perfect when reading static images but less so when working on an ongoing US exploration. 22 As well, our patients with gout may have not displayed the full spectrum of OA severity, limiting our ability to fully examine inter-group differences in cartilage parameters.
Conclusions
In gout patients, DECT-detected changes in cartilage composition were similar to those routinely observed in older patients, with similarities and differences to changes also seen in OA. These results support the notion that gout has an effect on cartilage composition, suggesting the possibility of potential DECT biomarkers of OA. Further studies should focus on whether these changes in cartilage composition assessed with DECT appear earlier in the OA process than visible cartilage lesions.
Supplemental Material
sj-docx-1-car-10.1177_19476035231172152 – Supplemental material for Associations of Changes in Knee Hyaline Cartilage Composition Measured With Dual-Energy Computed Tomography in Gout, Aging and Osteoarthritis
Supplemental material, sj-docx-1-car-10.1177_19476035231172152 for Associations of Changes in Knee Hyaline Cartilage Composition Measured With Dual-Energy Computed Tomography in Gout, Aging and Osteoarthritis by Julie Legrand, Claire Marzin, Tuhina Neogi, Laurène Norberciak, Jean-François Budzik and Tristan Pascart in CARTILAGE
Footnotes
Author Contributions
JL designed the study, performed US examinations, read DECT scans, and drafted the manuscript. CM read DECT scans. TN edited and validated the manuscript. LN performed the statistical analyses. J-FB designed the study, performed US examinations, read DECT scans, edited, and validated the manuscript. TP designed the study, participated in clinical data collection and drafted the manuscript.
Acknowledgments and Funding
The author(s) received no financial support for the research, authorship, and/or publication of this article.
Declaration of Conflicting Interests
The author(s) declared the following potential conflicts of interest with respect to the research, authorship, and/or publication of this article: None of the authors have any conflict of interests to disclose. TN declares two grants (K24 AR070892, P30 AR072571).
Ethical Approval
This study was approved by a French national review board (Comité de Protection des Personnes [CPP] protocol number 2020-045B, EudraCT clinical trial number 2020-A01269-30) and patients provided informed consent.
References
Supplementary Material
Please find the following supplemental material available below.
For Open Access articles published under a Creative Commons License, all supplemental material carries the same license as the article it is associated with.
For non-Open Access articles published, all supplemental material carries a non-exclusive license, and permission requests for re-use of supplemental material or any part of supplemental material shall be sent directly to the copyright owner as specified in the copyright notice associated with the article.