
Abstract
Objective
The aim of this study was to longitudinally determine the prognostic value of early postoperative quantitative 3T-MRI (magnetic resonance imaging) parameters of subchondral bone marrow for 2-year clinical and MRI outcome after matrix-associated autologous chondrocyte implantation (MACI) with autologous bone grafting (ABG) at the knee.
Design
Consecutive subjects who received MACI with ABG for treatment of focal osteochondral defects received MRI follow-up 3, 6, 12, and 24 months postoperatively. Quantitative MRI included bone marrow edema-like lesion (BMEL) volume measurements and single-voxel magnetic resonance spectroscopy (MRS; n = 9) of the subchondral bone marrow. At 2-year follow-up, morphological MRI outcome included MOCART (magnetic resonance observation of cartilage repair tissue) 2.0 scores. Clinical outcomes were assessed using Lysholm scores.
Results
Among a total of 18 subjects (mean age: 28.7 ± 8.4 years, n = 14 males) with defects at the medial or lateral (n = 15 and n = 3, respectively) condyle, mean BMEL volume decreased from 4.9 cm3 at 3 months to 2.0 cm3 at 2-year follow-up (P = 0.040). MRS-based bone marrow water T2 showed a decrease from 20.7 ms at 1-year follow-up to 16.8 ms at 2-year follow-up (P = 0.040). Higher BMEL volume at 6 months correlated with lower 2-year Lysholm (R = −0.616, P = 0.015) and MOCART 2.0 scores (R = −0.567, P = 0.027). Larger early postoperative BMEL volumes at 3 months (R = −0.850, P = 0.007) and 6 months (R = −0.811, P = 0.008) correlated with lower MRS-based unsaturated lipid fractions at 2-year follow-up. Furthermore, patients with early postoperative bony defects showed worse MOCART 2.0 (P = 0.044) and Lysholm scores (P = 0.017) after 24 months.
Conclusion
Low subchondral BMEL volume and optimal restoration of the subchondral bone at early postoperative time points predict better 2-year clinical and MRI outcomes after MACI with ABG.
Keywords
Introduction
Several surgical cartilage repair techniques have been developed for the treatment of patients with symptomatic osteochondral defects to prevent the onset of early osteoarthritis (OA). 1 Significant involvement of the subchondral bone requires restoration of the bony defect. Therefore, a combination of matrix-associated autologous chondrocyte implantation (MACI) and additional autologous bone grafting (ABG) was introduced, resulting in good clinical and radiological outcomes.2-6 Quantitative magnetic resonance imaging (MRI) techniques such as T2 relaxation time measurements have been shown to provide relevant information about water and collagen content in native hyaline cartilage.7,8 T2 relaxation time measurements are also used for the assessment of cartilage repair tissue. As cartilage and the subchondral bone are thought to interact as a functional unit, postoperative integrity of the subchondral bone may be crucial for optimal cartilage repair tissue maturation.9,10
After cartilage repair surgery, bone marrow (BM) edema-like lesions (BMELs) are regularly observed, but their clinical relevance and pathogenesis still remain uncertain. Magnetic resonance spectroscopy (MRS) is a noninvasive method that may provide additional information about the biochemical water-fat composition of BM in vivo.6,11-13 Global T2 relaxation times have also been obtained from subchondral BM using imaging-based methods.14,15 However, the value of global T2 is unclear due to a mixture of signals from fat, water, granulation tissue, necrosis, and vessels contributing to the total MR signal. 16 Single-voxel MRS not only enables the extraction of the fat fraction and unsaturated lipid fraction of BM (BMunsat) but also provides T2 values (MRS T2) for only the pure water signal.
Previously, we reported that early postoperative subchondral trabecular bone parameters correlated with T2 relaxation times of the cartilage repair tissue and with the qualitative WORMS score (Whole-Organ Magnetic Resonance Imaging Score) but not with the semi-quantitative MOCART (magnetic resonance observation of cartilage repair tissue) score in a series of patients who received MACI with ABG. 5 However, an updated version of the MOCART score has recently been introduced to take into account changes of the subchondral bone. 17 Moreover, analyses of the subchondral BMEL volume over time and MRS assessment of the subchondral BM were not included in that study. Therefore, the purpose of this secondary analysis of the case series was to evaluate the longitudinal changes of BMEL volume and MRS parameters of the subchondral bone and their associations with MR morphological and clinical outcomes after MACI with ABG of the knee.
Materials and Methods
Subjects
The study was approved by the local Institutional Review Board (Ethics Commission of the School of Medicine, Technical University of Munich). All procedures performed in studies involving human participants were in accordance with the ethical standards of the institutional and/or national research committee and with the 1964 Helsinki Declaration and its later amendments or comparable ethical standards. Informed consent was obtained from all individual participants included in the study. Inclusion and exclusion criteria were described previously. 5 In a total of 18 patients included in this study, MRI and standardized clinical assessment were performed preoperatively and after 3, 6, 12, and 24 months postoperatively.
Surgery
All subjects included in this study received MACI with ABG either at the medial (n = 15) femoral condyle or at the lateral femoral condyle (n = 3). The 2-step surgical procedure and postoperative regimen were described in detail in our previous publication. 5
MRI
MRI of the knee was performed at a 3.0 T MR scanner (Ingenia, Philips Healthcare, Best, The Netherlands) using a dedicated 16-channel knee coil (Medical Advances, Milwaukee, WI, USA). MR parameters are shown in
MR Pulse Sequence Parameters.
MR = magnetic resonance; IM = intermediate; w = weighted; TSE = turbo spin echo; MESE = multi-echo spin echo; 2D = 2-dimensional; Cor = coronal; Sag = sagittal; Tra = transverse; Col = column.
Morphological MR Assessment
MR images were evaluated semi-quantitatively by 2 radiologists (M.J. and P.M.J.). Semi-quantitative Area Measurement And DEpth Underlying Structures (AMADEUS) score was used for preoperative morphological assessment as previously described.24,25 Total AMADEUS score ranges from 0 (severe defect) to 100 (no osteochondral defect). Additional International Cartilage Repair Society (ICRS) grading was performed. 26
The MOCART 2.0 score was used for postoperative morphological description of the cartilage repair area that includes the parameters “Volume fill of cartilage defect” (0-20 points), “Integration into adjacent cartilage” (0-15 points), “Surface of the repair tissue” (0-10 points), “Structure of the repair tissue” (0-10 points), “Signal intensity of the repair tissue” (0-10 points), “Bony defect or bony overgrowth” (0-10 points), and “Subchondral changes” (0-20 points). 17 A score of 100/100 represents optimal findings. The radiologists were blinded for clinical information and results of quantitative MRI. The evaluation of bony defects was based on the subscore “Bony defect or bony overgrowth” from the MOCART 2.0 score. This subscore was dichotomized into the presence of a bony defect (subscore ≤ 5 points) or the absence of a bony defect (subscore = 10 points).
Quantitative MR Assessment
Using a mono-exponential non-negative least squares fit analysis, T2 relaxation time maps were calculated pixel-wise from 2D T2 MESE images. The segmentation of artifact free cartilage was performed by one trained radiology resident (M.J.) and supervised by one experienced radiologist (P.M.J.). Areas with chemical shift artifacts were avoided. Two individual areas were segmented: (1) MACI cartilage repair tissue site (CRT2) and (2) cartilage of the posterior condyle (reference cartilage T2). “Relative CRT2” was calculated as “CRT2” divided by “reference cartilage T2” (Relative CRT2 = CRT2/reference cartilage T2). Subchondral BMELs were segmented on consecutive slices on sagittal IM-w TSE sequences by one trained radiology resident (M.J.) and supervised by one experienced radiologist (P.M.J.), and BMEL volume was calculated. Single-voxel MRS was acquired at the subchondral BM, at the central femoral condyle, and at identical sites of the contralateral condyle. BMunsat measured as the olefinic signal (at 5.28 ppm) divided by the methyl signal (at 0.90 ppm), and spectroscopic water T2 relaxation times (MRS T2) were calculated from the single-voxel MRS data. The radiologists were blinded for clinical information and results of morphological MRI.
Clinical Evaluation
Postoperative clinical outcome was captured at each time point (3, 6, 12, and 24 months after surgery) using the modified Lysholm knee score, resulting in a 100-point scale (the clinical results were considered excellent if the Lysholm knee score was >90 points; good, 84-90 points; sufficient, 65-83 points; and poor, <65 points) and the Tegner activity level using a 10-point scale (0 = sick leave or disability because of severe knee pain; 10 = competitive sports, e.g., soccer, no knee problems).27,28
Statistical Analysis
Statistical processing was performed with SPSS, version 27.0 (IBM, Armonk, NY, USA) by two authors (M.J. and P.M.J.). All tests were performed based on a 2-sided 0.05 level of significance. Normal distribution of the data was assessed using Kolmogorov-Smirnov and Shapiro-Wilk tests. Paired t tests were used to assess the longitudinal changes of parametric parameters. Unpaired t tests were used for the comparison of parametric parameters between independent groups. Wilcoxon signed-rank tests were used to assess the longitudinal changes of nonparametric parameters. Mann-Whitney U test was performed for the comparison of nonparametric parameters between independent groups. Medians, means, and standard deviations (SDs); mean differences between groups; and lower and upper 95% confidence intervals (CIs) with standard error of the mean (SEM) were calculated. Spearman’s rank correlation coefficients were obtained to assess the correlations of quantitative parameters with semi-quantitative clinical parameters and semi-quantitative imaging parameters, respectively. To determine the accuracy of BMEL volumes in predicting an excellent Lysholm score after 24 months, receiver operating characteristic (ROC) analyses were conducted and the area under the curve (AUC) was determined. Optimal cutoff values were determined using the Youden Index. Corresponding sensitivities and specificities were calculated. A multivariate linear regression model was used to assess possible predictive quantitative and semi-quantitative imaging parameters for the clinical outcome after 24 months.
Reproducibility Measurements
Good intra- and inter-reader reproducibility was reported previously for our research group.5,6
Results
Patient Characteristics
The analyzed subjects (n = 18; n = 14 males, n = 4 females) had a mean age of 28.7 ± 8.4 years (mean ± SD). The mean body mass index (BMI) was 25.0 ± 4.5 kg/m2. In 12/18 cases, surgery had been performed at the right knee (left knee, 6/18 cases). MACI with ABG was performed for osteochondral defects at the medial femoral condyle in 15/18 subjects (lateral femoral condyle, 3/18 cases). The mean defect area was 5.3 ± 2.5 cm2. Additional high tibial osteotomy (HTO) was performed in 7/18 cases for correction of varus deformity >2°. Lysholm score significantly improved from 75.3 ± 12.9 (mean ± SD) after 3 months to 87.9 ± 5.6 after 6 months, to 92.4 ± 5.2 after 12 months, and to 94.2 ± 4.4 at 24 months (P < 0.05 from 3 months to all time points). There was a statistically significant stepwise improvement of Tegner scores from 3 to 6 months (Z = −2.43, P = 0.015), from 6 to 12 months (Z = −2.33, P = 0.020), and from 12 to 24 months (Z = −2.59, P = 0.038).
Pre- and Postoperative Morphological MR Assessment
Preoperative MR images were available in 17/18 cases. Preoperative ICRS score was grade 4 in all subjects. Total AMADEUS scores ranged from 0 to 50 with a mean score of 22.9 ± 17.7. AMADEUS grades I, II, III, and IV were present in 0, 0, 5, and 12 cases, respectively. Total AMADEUS scores, AMADEUS grades, or AMADEUS subscores did not correlate with any radiologic or clinical outcome parameters (P > 0.05).
Postoperatively, the mean MOCART 2.0 score was 68.8 ± 13.5 at 3 months follow-up. There was a statistically significant increase (improvement) of MOCART 2.0 score between 3 and 6 months (80.6 ± 11.2, P = 0.003). The further increase of MOCART 2.0 scores between 6 and 12 months (84.1 ± 12.4, P = 0.178) and between 12 and 24 months (85.6 ± 11.5, P = 0.401) was not statistically significant.
We reported previously that the overall radiological outcome 24 months after MACI with ABG was good to excellent.
5
While underfilling was found in n = 6 patients after 3 months, and n = 3 patients after 6 months, only 1 patient showed persisting underfilling after 12 and 24 months. The presence of underfilling at any postoperative follow-up time point did not show a statistically significant correlation with Lysholm scores after 24 months (P > 0.05). In our cohort, all of the detected bony defects were already present at the first follow-up time point at 3 months after surgery. No new bony defect occurred at 6, 12, or 24 months follow-up. In 5/6 cases, the bony defect persisted 24 months after MACI with ABG. Only in 1 patient that showed a bony defect at 3 and 6 months, a normal subchondral bone was found at 24 months (patient C in
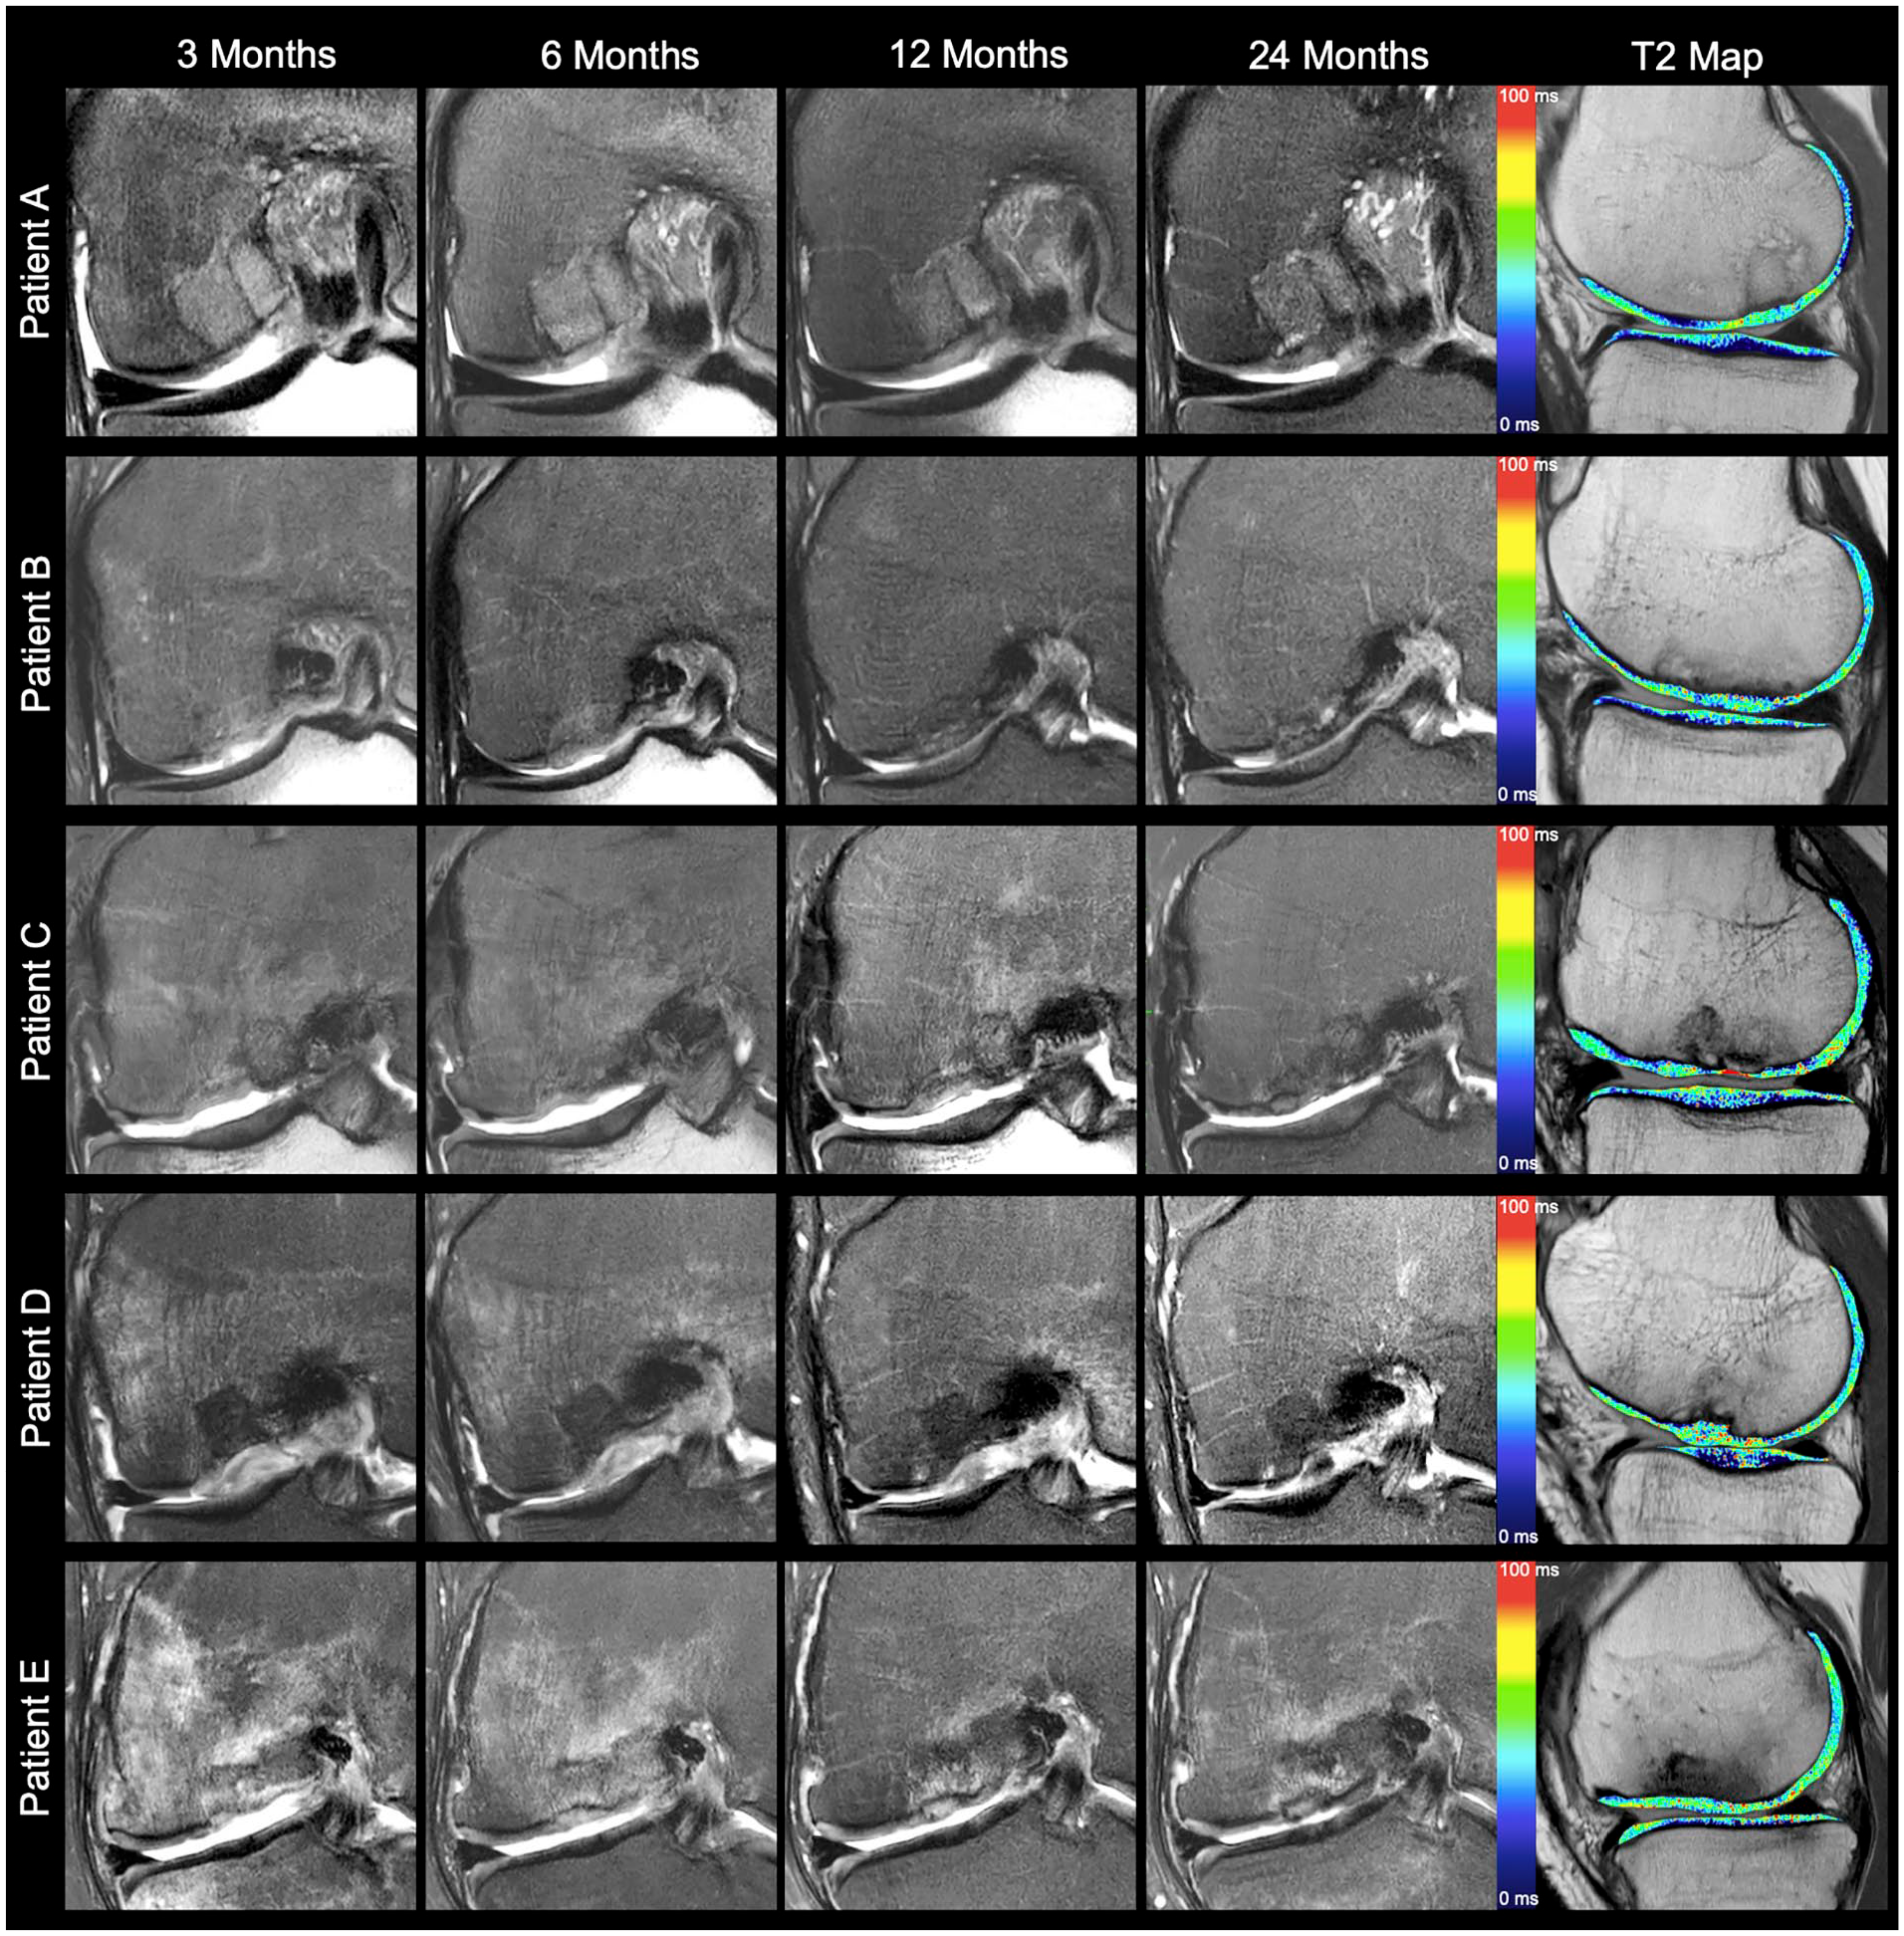
Coronal intermediate-weighted images with fat saturation over time and sagittal T2 relaxation time maps at 24 months after matrix-associated chondrocyte implantation and autologous bone grafting (patients A and B, Lysholm Sore ≥ 95). Morphological images demonstrate optimal restoration of the subchondral bone without a bone marrow edema-like lesion (MOCART 2.0 score, ≥95). T2 values of the cartilage repair tissue are normalized at 24 months (patient C, Lysholm Score = 90). Morphological images depict a bony defect at 3 and 6 months follow-up. Only in this patient, a normalized subchondral bone was found at 24 months (MOCART 2.0 score, 95) after the presence of an early postoperative bony defect. T2 values remain prolonged (patients D and E, Lysholm score ≤ 90). Early postoperative bony defects persist at all follow-up time points (MOCART 2.0 score, 70). Large BMEL declines over time in patient D but persists at all follow-up time points in patient E. T2 values of the cartilage repair area remain prolonged in patient D. MOCART = magnetic resonance observation of cartilage repair tissue; BMEL = bone marrow edema-like lesion.
After 24 months, MOCART 2.0 scores were significantly lower (worse) in patients with bony defects than in patients without bony defects at 3 months follow-up (77.5 ± 11.3 vs. 90.8 ± 8.6, respectively; mean difference ± SEM = 13.3 ± 5.8; 95% CI = 0.4-26.3; P = 0.044) and at 6 months follow-up (74.2 ± 7.4 vs. 92.2 ± 7.5, respectively; mean difference ± SEM = 18.1 ± 3.9; 95% CI = 9.5-26.6; P < 0.001). Furthermore, Lysholm scores after 24 months were significantly lower (worse) in patients with bony defects than in patients without bony defects at 3 months follow-up (92.2 ± 4.4 vs. 98.0 ± 2.3, respectively; mean difference ± SEM = 5.8 ± 2.0; 95% CI = 1.3-10.4; P = 0.017), and there was a statistical trend toward a lower Lysholm score at 24 months in the presence of bony defect at 6 months follow-up (92.2 ± 4.4 vs. 96.8 ± 3.8, respectively; mean difference ± SEM = 4.6 ± 2.1; 95% CI = 0.01-9.21; P = 0.05). The difference in the total MOCART 2.0 score between patients with an excellent Lysholm score (>90 points) and patients with a Lysholm score ≤ 90 points at 24 months was statistically significant at 12 months (89.0 ± 10.5 vs. 75.8 ± 11.6, respectively; mean difference ± SEM = 13.2 ± 5.6; 95% CI = 1.1-25.3; P = 0.035) and at 24 months follow-up (90.0 ± 8.2 vs. 78.3 ± 13.3, respectively; mean difference ± SEM = 11.7 ± 5.3; 95% CI = 0.3-23.1; P = 0.046) (
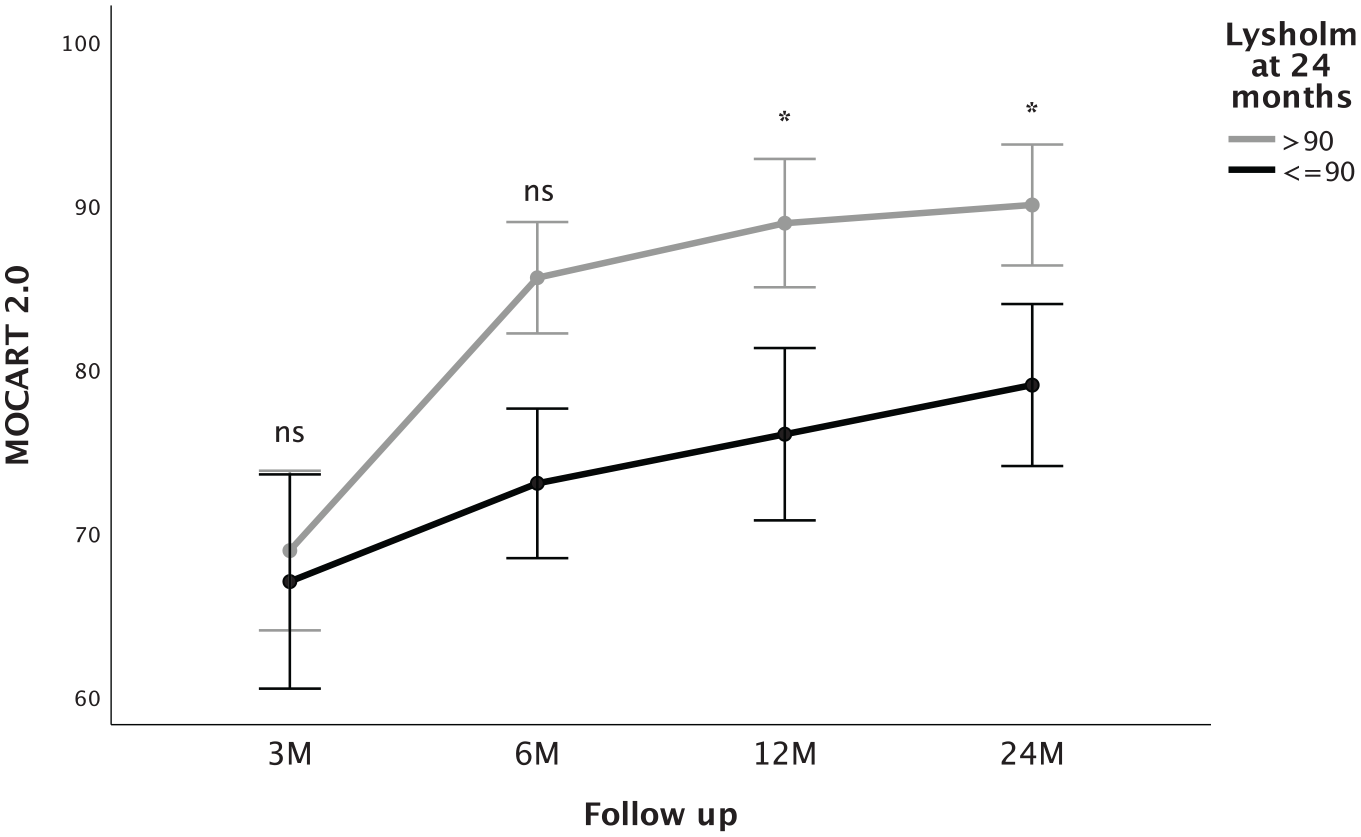
MOCART 2.0 scores (mean ± SE) at different follow-up time points in patients with Lysholm scores >90 points and ≤90 at 24 months, respectively. Patients with excellent Lysholm scores after 24 months show higher MOCART 2.0 from 6 months on. MOCART = magnetic resonance observation of cartilage repair tissue; ns = not significant; M = months. Asterisks indicate statistically significant differences.
T2 Cartilage
CRT2 values were significantly higher in the cartilage repair area than were the reference values at all follow-up time points (all Ps < .005; Table 2 ). The mean relative CRT2 value at 3 months was 1.55 ± 0.27. A slight increase of relative CRT2 at 6 months was not statistically significant (1.62 ± 0.25, P = 0.13). Relative CRT2 decreased significantly between 6 and 12 months (1.39 ± 0.20, P = 0.008). Moreover, a further decrease was found in relative CRT2 24 months after MACI with ABG (1.23 ± 0.27, P = 0.021). After 24 months, relative CRT2 was significantly higher in patients with bony defects than in patients without bony defects at 6 months follow-up (1.43 ± 0.29 vs. 1.13 ± 0.18, respectively; mean difference ± SEM = 0.30 ± 0.12; 95% CI = 0.04-0.56; P = 0.029), but not at 3 months follow-up (P = 0.092). There was a statistically significant difference of relative CRT2 between patients with total MOCART 2.0 scores ≥90 points (1.11 ± 0.18) and patients with total MOCART 2.0 scores <90 points (1.39 ± 0.29; mean difference ± SEM = −0.27 ± 0.12; 95% CI = −0.53 to 0.02, P = 0.038) at 24 months. CRT2 values did not show a statistically significant correlation with Lysholm scores after 24 months (P > 0.05).
CRT2 Values (Milliseconds) of the Cartilage Repair Area and the Reference Area at Different Postoperative Follow-Up Time Points.
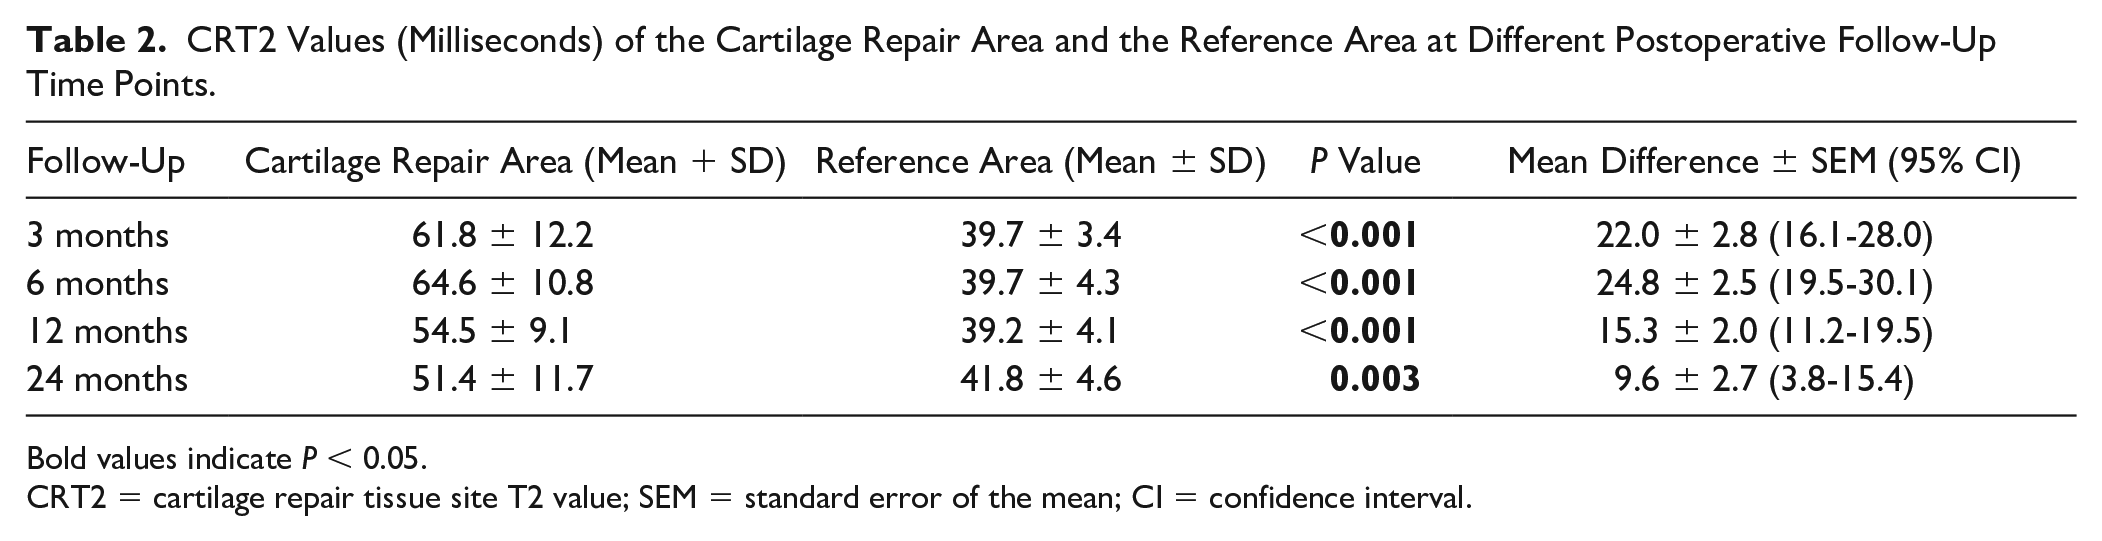
Bold values indicate P < 0.05.
CRT2 = cartilage repair tissue site T2 value; SEM = standard error of the mean; CI = confidence interval.
Longitudinal Assessment of BMELs
Correlations between BMEL volumes and clinical scores, and quantitative and qualitative MRI outcome parameters, are shown in
The Association Between BMELs Volume at Different Time Points and Clinical/Radiological Outcome Parameters at 24 Months.
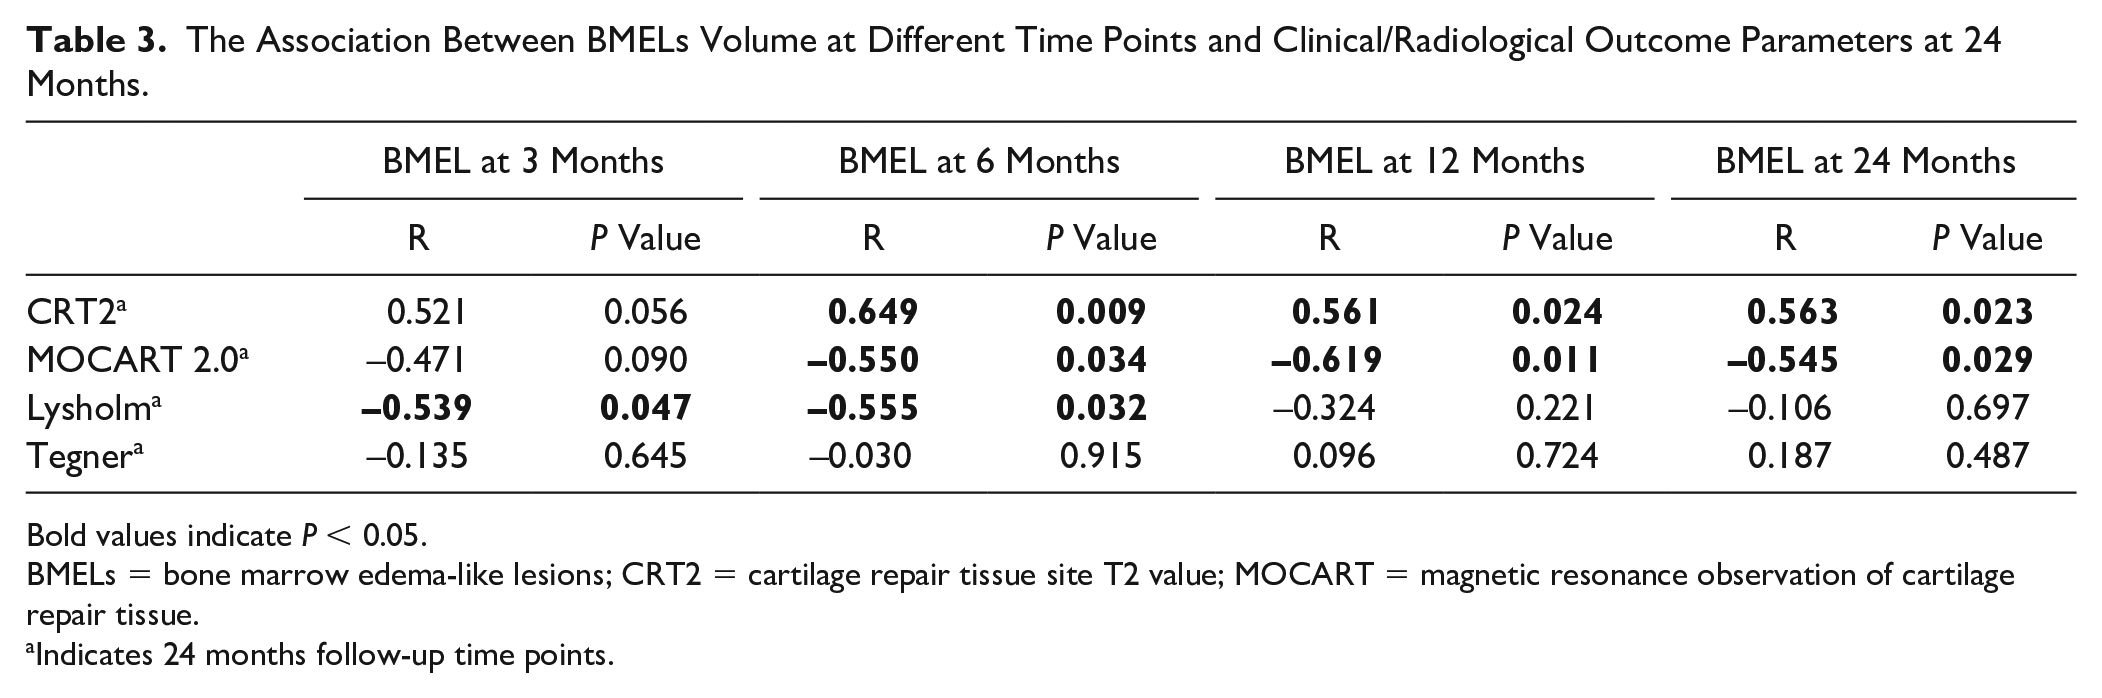
Bold values indicate P < 0.05.
BMELs = bone marrow edema-like lesions; CRT2 = cartilage repair tissue site T2 value; MOCART = magnetic resonance observation of cartilage repair tissue.
Indicates 24 months follow-up time points.
However, BMEL volume decreased significantly between 3 and 12 months (Z = −2.1, P = 0.04), and between 3 and 24 months (Z = −2.1, P = 0.04) after MACI with ABG. Higher quantitative CRT2 values 24 months after MACI with ABG were significantly correlated with higher BMEL volumes at 6 months (R = 0.649, P = 0.009), at 12 months (R = 0.561, P = 0.024), and at 24 months (R = 0.563, P = 0.023). Furthermore, there was a statistical significance for the correlation of lower (worse) MOCART 2.0 scores at 24 months with higher BMEL volumes at 6 months (R = −0.550, P = 0.034), at 12 months (R = −0.619, P = 0.011), and at 24 months (R = −0.545, P = 0.029). Patients with persisting bony defects 24 months after surgery had significantly higher BMEL volumes at 3 months follow-up than patients without a bony defect (median = 8.6 cm3 vs. 1.8 cm3, Z = −2.2, P = 0.029). Regarding clinical correlations, lower (worse) Lysholm scores at 24 months were significantly correlated with higher BMEL volumes at 3 months (R = −0.539, P = 0.047) and at 6 months (R = −0.555, P = 0.032), but not at 12 or 24 months (P > 0.05). Furthermore, those patients with excellent Lysholm scores (>90 points) 24 months after surgery showed significantly lower BMEL volumes at 3 months follow-up (Z = −2.5, P = 0.012) and at 6 months follow-up (Z = −2.4, P = 0.018) (
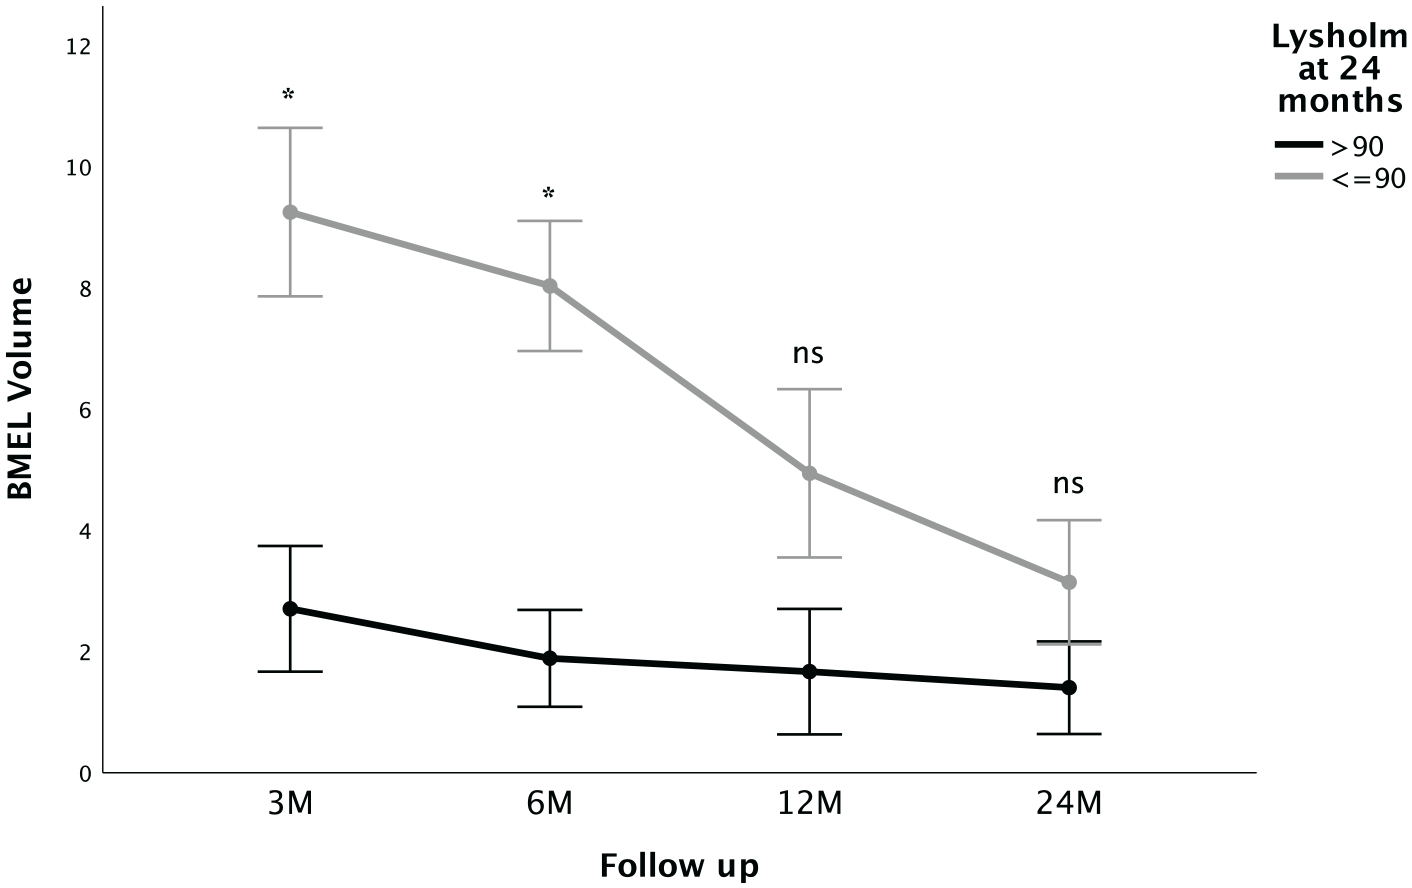
BMEL volumes (mean ± SE) at different follow-up time points in patients with Lysholm scores >90 points and ≤90 at 24 months, respectively. Patients with excellent Lysholm scores after 24 months show significantly higher BMEL volume early postoperative at 3 and 6 months. BMEL = bone marrow edema-like lesion; ns = not significant; M = months. Asterisks indicate statistically significant differences.
The accuracy in predicting an excellent Lysholm score (>90) after 24 months was excellent for BMEL volume at 3 months (AUC = 0.91, P = 0.014, 95% CI = 0.75-1.0) and good for BMEL volume at 6 months (AUC = 0.87, P = 0.018, 95% CI = 0.67-1.0). Considering sensitivity and specificity as equally important, optimal cutoff values for the prediction of an excellent Lysholm score at 24 months follow-up were found for a BMEL volume of ≤7.1 cm3 at 3 months with a sensitivity of 89% and a specificity of 80%, and for a BMEL volume of ≤7.0 cm3 at 6 months with a sensitivity of 100% and a specificity of 67%. When implementing BMEL volume and the presence of a bony defect at 6 months follow-up in a multivariate linear regression model with the outcome parameter Lysholm score at 24 months, BMEL volume at 6 months was found to be an independent statistically significant predictor for clinical outcome (B = −0.62, P = 0.035) but not the presence of a bony defect (B = −1.46, P = 0.166). No significant associations were found between BMEL volumes and the Tegner activity scores (P > 0.05).
MRS of the Subchondral Bone
MRS of the subchondral bone was available in a subset of 9/18 patients at 12 and 24 months follow-up. There was a statistically significant decrease found in MRS T2 from 12 to 24 months after MACI with ABG (20.7 ± 5.9 ms vs. 16.8 ± 5.6 ms, respectively; mean difference ± SEM = 3.9 ± 1.5 ms; 95% CI = 0.2-7.6 ms; P = 0.040;
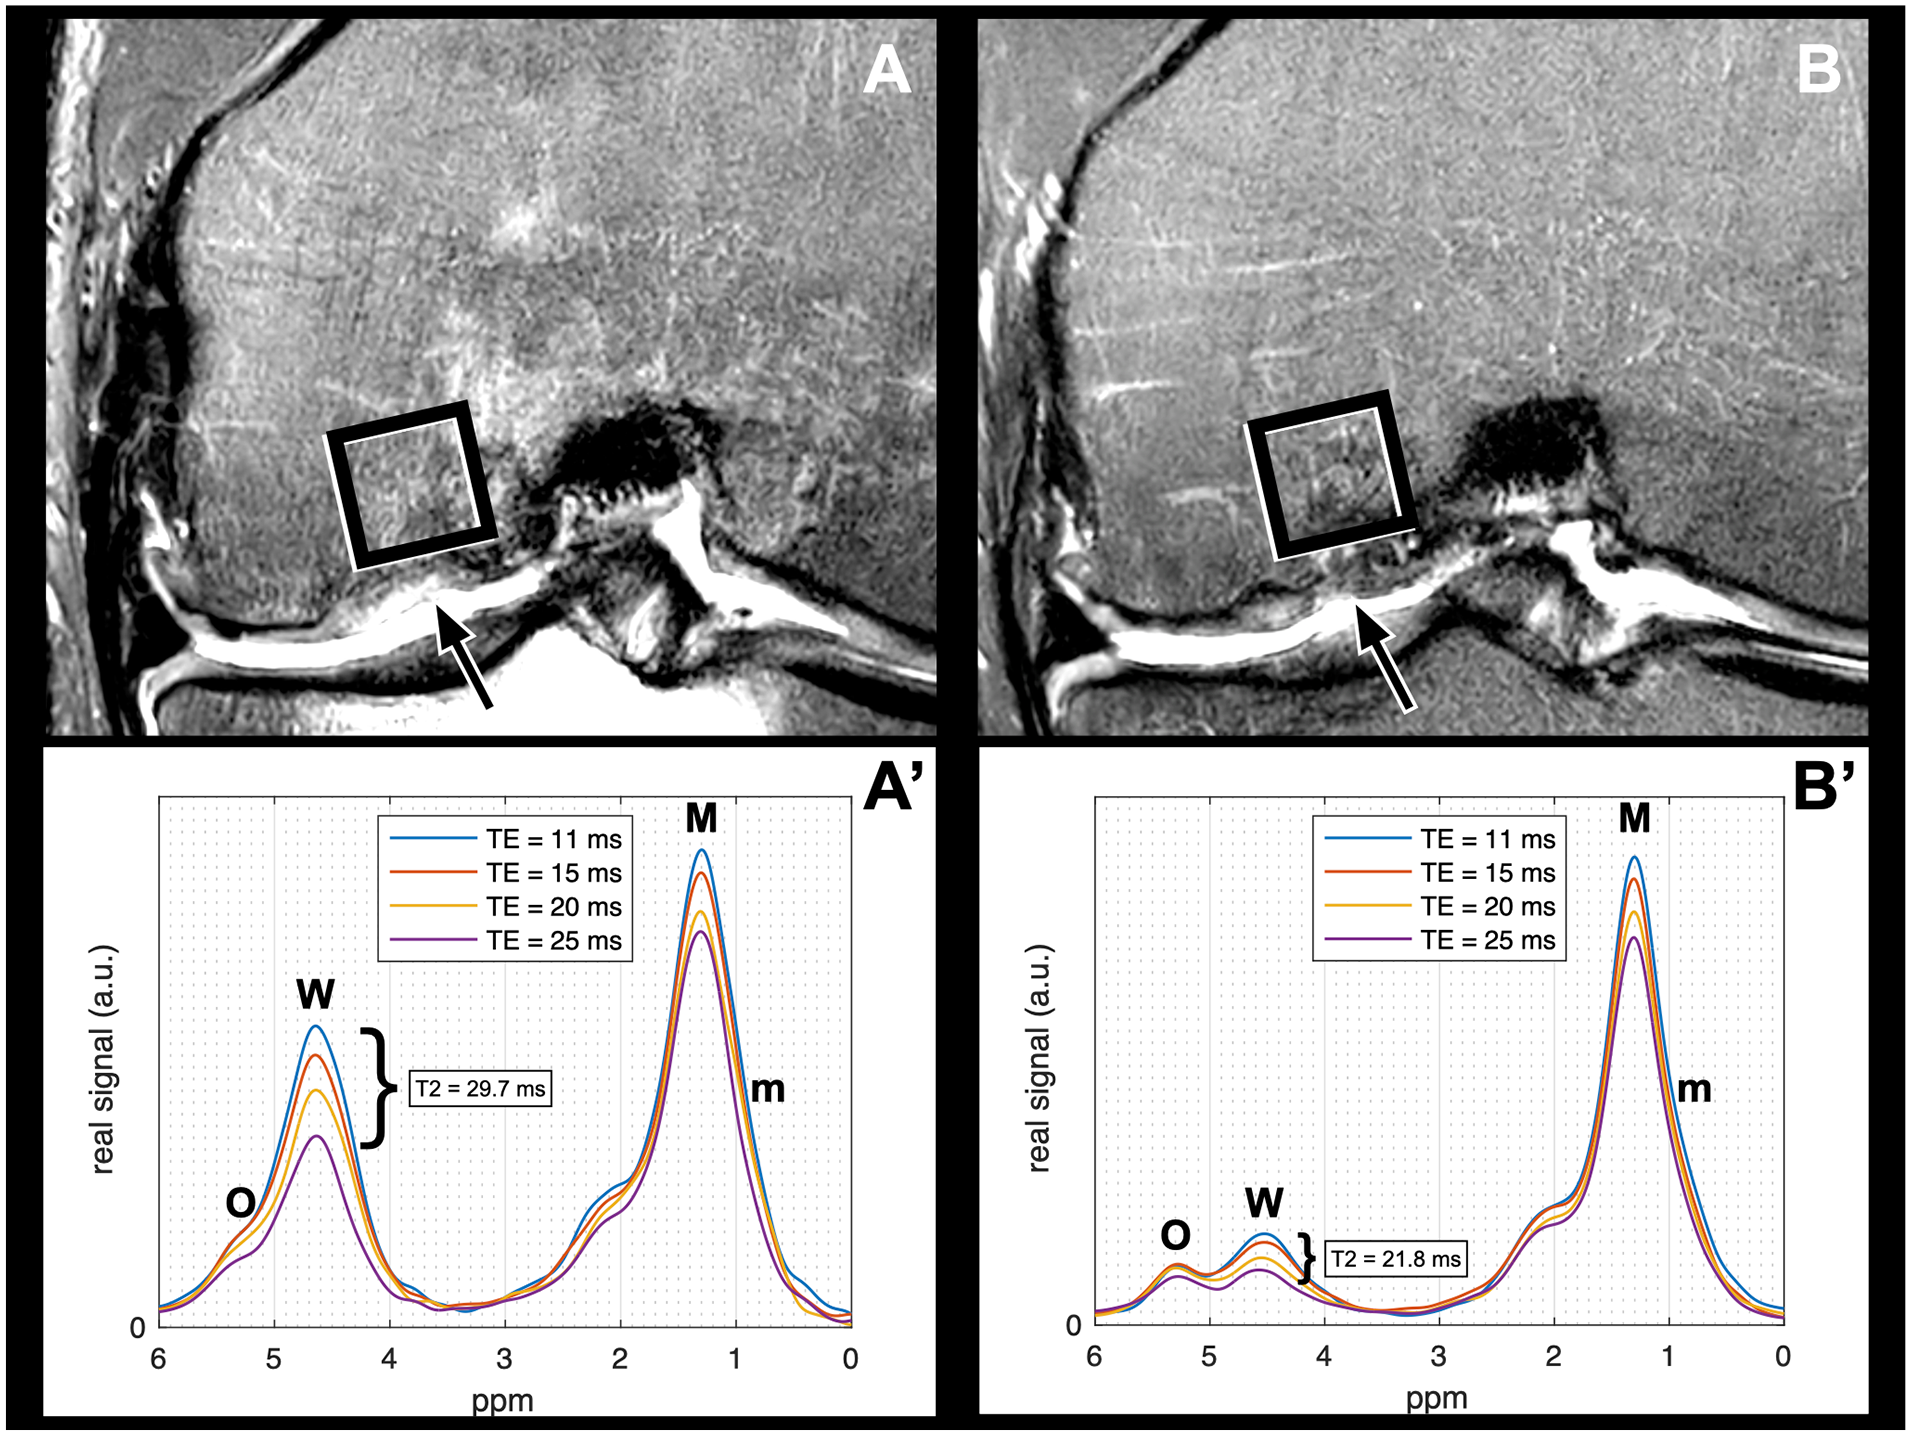
Visualization of the decrease of MRS T2 from 12 months (
Discussion
In this study, advanced quantitative MRI techniques were applied 3, 6, 12, and 24 months postoperatively in a series of patients after MACI with ABG of the knee. MRI analyses focused on single-voxel MRS and BMEL volume measurements of the subchondral BM, morphologic MRI findings, and CRT2 measurements of the cartilage repair tissue. Higher early postoperative BMEL volumes at 3 and/or 6 months were associated with different imaging and clinical outcome parameters at 24 months: higher CRT2 values, lower BMunsat, and worse MR morphological (MOCART 2.0) and worse clinical (Lysholm) outcomes. The presence of early postoperative bony defects was significantly, or by trend, associated with the following parameters at 24 months: higher relative CRT2 values, lower BMunsat, worse MR morphological, and worse clinical outcomes. These early postoperative bony defects showed a limited potential for full restoration of the subchondral bone integrity over time. Therefore, this study indicates that early postoperative qualitative and quantitative MRI parameters including bony defects and BMEL volume measurements are associated with cartilage repair tissue quality, radiological, and clinical outcome 24 months after MACI with ABG.
T2 relaxometry mapping is a quantitative MRI technique that provides biochemical information about water and collagen content of hyaline cartilage. Previous studies have shown correlations of T2 relaxation time measurements with cartilage matrix degeneration, cartilage loss, and OA.19,29 Recently, quantitative MRI techniques have been increasingly used for noninvasive biochemical assessment of cartilage repair tissue, but their validity in the evaluation of the fibrous and hyaline-like cartilage containing repair tissue remains unclear.1,8,30-32 Studies have demonstrated that early postoperative after MACI, CRT2 values are initially higher than T2 values of native hyaline cartilage and subsequently decrease during follow-up.33,34 In line, relative CRT2 values stepwise decreased over 24 months in our cohort, indicating cartilage repair tissue maturation. In our previous study, we reported no significant association between the MOCART score and CRT2 values at 2-year follow-up. 5 However, in the present study, the updated version of the MOCART score was used for MR morphological assessment of the cartilage repair area. In contrast to the original version, integrity of the subchondral bone is weighted more heavily in the updated 100-point scoring system.17,35 In the present study, higher CRT2 values were associated with worse MOCART 2.0 scores, suggesting that the updated MOCART 2.0 score better reflects cartilage repair tissue quality, possibly due to the emphasis on the subchondral bone and its role in cartilage repair tissue nutrition and maturation.
In a previous cross-sectional study, we showed that bony defects were associated with higher T2 relaxation times of the cartilage repair tissue at 2.5 years after surgery. 6 Interestingly, in this longitudinal study, already the presence of postoperative bony defects early after MACI with ABG (3 and/or 6 months) predicted higher 24 months CRT2 values and worse 24 months clinical and MR morphological outcomes. In addition, these early postoperative subchondral bony defects persisted in 5/6 cases throughout the 2-year follow-up. These results indicate that early postoperative subchondral bony defects (1) may have a limited self-restoration potential after osteochondral surgery, (2) may lead to insufficient nutrition and maturation of the cartilage repair tissue, and (3) may be associated with worse MR morphological and clinical outcome. In contrast to cartilage repair tissue underfilling that (in our cohort) showed the potential to improve predominantly throughout the first postoperative year due to cartilage repair tissue growth, no postoperative growth/filling of the subchondral bone seems to occur. This indicates that full restoration of the subchondral bony defect should be addressed intraoperatively to achieve optimal postoperative proliferation and maturation of the overlaying cartilage repair tissue matrix. Yet, overall clinical and MR morphological outcome was good to excellent at the 2-year follow-up, and in line with previous studies, there was a significant improvement of clinical and radiologic scores over time.36,37
However, a high overall prevalence of subchondral BMEL was found during follow-up and persisting BMEL was present in 56.3% of our cohort 24 months after surgery. Several studies have described large numbers of patients with BMEL after cartilage repair surgery, with a prevalence of up to 47% at 12 months follow-up, and 61.5% and 73.1% at mid-term (22-36 months) and long-term (96-194) months’ follow-up, respectively.38-43 While previous studies reported associations of BMEL with knee pain,5,6,44,45 some postoperative follow-up studies after cartilage repair surgery found no correlation of BMEL with poor clinical outcomes.40,41,46,47 In this prospective study, larger early postoperative BMEL was associated with worse clinical outcome after 24 months, and BMEL volume measurements showed good to excellent accuracy in predicting the clinical outcome at 2-year follow-up after MACI with ABG (optimal cutoff at 6 months: ≤7.0 cm3). These different observations may partly be explained by the additional osseous transplantation in our cohort. For instance, Niemeyer et al. 40 specifically excluded patients with deep preoperative subchondral bony defects. It is speculated that an insufficient protection of the subchondral bone from mechanical loads may lead to the presence of BMEL after cartilage repair surgery.46,48 In our cohort, patients with persisting bony defects showed larger BMEL volumes early postoperatively and worse cartilage repair tissue quality after 24 months. However, it still remains uncertain, whether changes of the subchondral bone lead to insufficient cartilage repair tissue proliferation, or whether BMEL is the result of biomechanical stress caused by insufficient cartilage repair tissue and subchondral bone quality.
Despite signal alterations of subchondral BMEL on morphologic MRI indicate edema, histologic studies have found little true edema but non-characteristic abnormalities, including BM fibrosis, BM necrosis, and trabecular abnormalities.49,50 MRS is a noninvasive method to quantitatively assess the biochemical water-fat composition of BM in vivo. 16 In particular, MRS allows the quantification of unsaturation levels among triglycerides. So far, only a few studies have used MRS for quantitative analyses of the BM at the knee joint.6,11-13,51 In a previous study, we reported that MRS may be used as a sensitive method to detect edema or water in BMEL. 6 In line with these findings, we here report a significant decrease in MRS-based T2 relaxation times of water from 12 to 24 months in subset of 9/18 after MACI with ABG, consistent with the decrease of BMEL volume over time. Furthermore, those patients with larger early postoperative BMEL showed lower BMunsat at 2-year follow-up. Similar biochemical changes of the fat component of the subchondral bone have previously been described in patients with OA of the knee.6,11,51 In addition, those patients with worse Lysholm scores had lower BMunsat. Kim et al. 52 showed that even after cartilage repair, the risk for a progression of radiographic OA increases from 5 years after surgery on. Thus, MRS detecting low BMunsat may be an additional biomarker for degenerative changes of the subchondral bone at an early time point. However, larger long-term longitudinal cohort studies are needed to support this hypothesis.
In our previous study, we showed a correlation of early postoperative subchondral trabecular bone parameters with T2 relaxation times of the cartilage repair tissue. 5 In the present study, we specifically focused on the evaluation of quantitative subchondral BMEL volume and MRS assessment of the subchondral BM over time. This study is a secondary analysis of our prospective cohort. 5 Thus, statistical power calculations do not apply for the current analysis because they were based on the original study design. In part, absent significant findings may therefore be explained due to the relatively small number of patients (n = 18). However, it must be noted that MACI with ABG was only introduced during recent years, and the sample size is similar to that in previously conducted studies.2,3 Still, further prospective studies with larger cohorts are needed to evaluate the exact role of subchondral bone parameters longitudinally. Another limitation of this study is that advanced MRI was only performed postoperatively, and preoperative MRI scans were evaluated only morphologically. Yet, in line with a previous study, postoperative outcomes were not correlated with preoperative semi-quantitative AMADEUS (sub-)scores. 6 These results further support the hypothesis that very good postoperative results may be achieved regardless of the preoperative defect size. A further limitation of the study is that quantitative MRS was only available in a subset of our cohort, which consecutively limits statistical power. However, it must be emphasized that even in this small sample size, significant biochemical changes of the fat component that have previously been described in patients with OA were found in patients with larger early postoperative BMEL. MRS parameters may therefore provide additional information regarding early degenerative changes that may become apparent at a later time point on morphological MRIs. Further prospective studies are needed to evaluate the exact value of MRS in predicting OA.
In summary, T2 relaxation time, BMEL volume, and single-voxel MRS of the BM provided quantitative measurements of cartilage repair tissue and adjacent subchondral bone after MACI with ABG. This study found 2 main MRI findings that may be assessed at 6 months after surgery and that are predictive for worse 2-year clinical and MRI outcome after osteochondral repair: (1) early postoperative bony defects that show a limited self-restoration potential and (2) large early postoperative BMEL volumes (cutoff at 6 months: ≤7.0 cm3). In this context, quantitative MRS including MRS T2 and BMunsat may serve as a noninvasive method to detect early degenerative BM changes after MACI with ABG. In conclusion, the complete intraoperative restoration and the early postoperative integrity of the subchondral bone (no bony defect, small BMEL volume) may be essential for the proper nutrition and maturation of the overlying cartilage repair tissue, resulting in optimal cartilage repair tissue quality and clinical outcome 24 months after osteochondral repair.
Footnotes
Authors’ Note
The study was performed at the Department of Diagnostic and Interventional Radiology, School of Medicine, Technical University of Munich, Germany.
Acknowledgments and Funding
The author(s) disclosed receipt of the following financial support for the research, authorship, and/or publication of this article: M.J. was funded by the Berta-Ottenstein-Programme for Clinician Scientists, Faculty of Medicine, University of Freiburg. P.M.J. was funded by the Berta-Ottenstein-Programme for Advanced Clinician Scientists, Faculty of Medicine, University of Freiburg.
Declaration of Conflicting Interests
The author(s) declared no potential conflicts of interest with respect to the research, authorship, and/or publication of this article.
Ethical Approval
The ethical approval was obtained from the Ethics Commission of the Faculty of Medicine, Technical University of Munich, Germany.