
Abstract
Objective
In order to appreciate the roles articular cartilage of sesamoid bones and sesamoid fibrocartilage play in anatomy and pathology, the articular cartilage of the patella (n = 4) and suprapatella (n = 4) (a sesamoid fibrocartilage) of 12 to 14 weeks old New Zealand rabbits were studied qualitatively and quantitatively.
Design/Method
The intact knee joints and block specimens from the joints were imaged using microscopic magnetic resonance imaging (µMRI) at a 97.6-µm pixel resolution for the former and 19.5-µm resolution for the latter. Histological sections were made out of the µMRI-imaged specimens, which were imaged using polarized light microscopy (PLM) at 0.25-, 1-, and 4-µm pixel resolutions.
Results
The patella cartilage varied in thickness across the medial to lateral ends of the sesamoid bone with the central medial aspect slightly thicker than the lateral aspect. The suprapatella fibrocartilage decreased proximally away from the knee joint. Quantitative results of patellar cartilage showed strong dependence of fiber orientation with the tissue depth. Three histological zones can be clearly observed, which are similar to articular cartilage from other large animals. The sesamoid fibrocartilage has one thin surface layer (10 µm thick) of parallel-arranged structured fibers followed immediately by the majority of random fibers in bulk tissue. T2 relaxation time anisotropy was observed in the patellar cartilage but not in the bulk fibrocartilage.
Conclusion
Given the different functions of these 2 different types of cartilages in joint motion, these quantitative results will be beneficial to future studies of joint diseases using rabbits as the animal model.
Keywords
Introduction
The knee is a complex joint that consists of tibiofemoral and patellofemoral regions. Both can be affected in arthritis. 1 The patella is an inverted triangular-shaped bone that reduces friction between the condyles of the femur and the quadriceps tendon and acts as a mechanical lever arm to improve extension capability of the quadriceps muscle through increment of the moment arm of the patellar tendon 2 while shielding the tibiofemoral joint.2,3 It is the largest sesamoid bone in mammals and forms part of the complex knee joint, specifically, the patellofemoral joint. The patella has anterior and posterior surfaces bordered laterally and medially. The posterior aspect of the patella is the site for growth 4 with the surface lined with cartilage. The cartilaginous surface can broadly be divided into 2 regions (medial and lateral) by a raised vertical midline ridge. 5
In studies of arthritis using rabbits,6,7 its suprapatella structure in the knee was often overlooked despite its prominence and contribution. 8 The suprapatella in rabbits is a sesamoid fibrocartilage found in the deep surface of the quadriceps tendon 9 and proximal to the patella. It forms as an essential part of the knee joint as it articulates with the femur. Similar to articular cartilage, the suprapatella is known to contain aggrecan, type II collagen, and glycosaminoglycan. 8 As a fibrocartilage, the suprapatella is also affected in degenerative joint disease. 10 For an extremely flexed knee, the suprapatella is a weightbearing structure in the knee joint. 8
To appreciate the roles articular cartilage of sesamoid bones and sesamoid fibrocartilage play in pathology and biomechanics, it is important to understand the molecular and fibril structures of the patellar cartilage and suprapatella—the former is extensively used as a model for cartilage repair and the latter is subject to degenerative change in osteoarthritis. 8 Patellar cartilage of rabbits is known to behave differently from other species due to the difference in response to damage and healing.11-14 So far, there is also lack of sensitive markers in detecting critical changes when assessing the structural and biochemical properties of patella cartilage and suprapatellar tissues. 12
This study aimed to provide both quantitative and qualitative structural and morphological characterization for rabbit patella cartilage and suprapatella at high resolutions using microscopic magnetic resonance imaging (µMRI) and polarized light microscopy (PLM). Whole-body MRI is valuable in the clinics for detecting degradative variations in the molecular environment of biological tissue and organ noninvasively. Available at a transverse resolution down to about 10 µm, µMRI is extremely useful in the quantitative examination of connective tissues such as articular cartilage at high resolution. 15 The µMRI technique can assess the depth-dependent anisotropic morphology in articular cartilage. 12 In particular, the T2 relaxation time, which can be quantified in both clinical MRI and µMRI, is sensitive to the orientation of collagen fibrils and the proteoglycan-water interactions depth-dependently in cartilage from large mammals.12,15 The T2 anisotropy protocol was used in this study for the first time to study the suprapatellar of the rabbit. The noninvasive characterization of these tissues by µMRI is correlated in this study with the quantifiable information by PLM on the angle (representing the pixel-averaged orientation of collagen fibers) and retardation (representing the pixel-averaged organization of collagen fibers) in cartilage. 13
Methods
Sample Preparation for Patella and Suprapatella
The patella and suprapatella were obtained from the left hind limbs of five 12 to 15 weeks old male New Zealand white rabbits. The rabbits were healthy and sacrificed for an unrelated experimental study (which was approved by the relevant Institutional Review Committee); the intact bodies were frozen at −80°C and later thawed at 4°C before harvesting. Four intact knee joints were placed individually in a glass tube for the low-resolution MRI axially centered at the patellofemoral region.
Four patellar cartilage blocks, one from each rabbit, were cut from the central and medial parts of the tissue, which had a size of 4 × 3 × 2 mm and included the full depth of tissue and underlying bone. A medial section was taken because in deep flexion the patella tilts medially, that is, more surface contact with the medial condyle. 16 Each block was sealed in a 5-mm glass tube containing protease inhibitor saline. In addition, 4 randomly selected suprapatella from the five rabbits with the full thickness of tissue still attached to a part of underlying quadriceps tendon were excised. Each sample was placed in a 5-mm glass tube without saline. Both patella and suprapatella were imaged in the sagittal view in µMRI and later prepared for histology.14,17
Microscopic MRI Protocol
A Bruker Avance IIIHD 300 NMR spectrometer was used to image all specimens, which has a 7-Tesla 89-mm-bore-diameter superconducting magnet. A quantitative T2 magnetization-prepared imaging sequence 18 was used. The sequence has a leading segment for relaxation weighting by a spin echo and a subsequent MSME (multislice multiecho) imaging segment where all timings were kept constant.14,17 The intact joint imaging used a FOV (field of view) of 25 × 25 mm, a slice thickness of 0.8 mm, and a matrix size of 256 × 256 in 5 echo times (8, 16, 24, 32, 40 ms). The cartilage blocks were imaged with a FOV of 5 × 5 mm and a matrix size of 256 × 128, which was later reconstructed into the size of 256 × 256 in ImageJ 19 (v1.52a). These imaging parameters resulted in a pixel resolution of 97.6 µm per pixel for the intact joint and a higher resolution of 19.5 µm for the cartilage blocks. A TR (repetition time) of 2 seconds was used in both imaging experiments. For the patella cartilage blocks, the TE (echo time) in the contrast segment for the T2 weighting was 2, 4, 8, 16, and 38 ms. In the T2 imaging experiment, the normal axis to the cartilage surface in the bone blocks were placed at 0° and 55° angular orientations with respect to the external magnetic field B0, which manipulated the geometrical factor (3cos 2 θ − 1) that dominates the nonzero dipolar Hamiltonian. 15 The suprapatella was imaged with similar parameters without the use of saline (otherwise it would be difficult to separate the saline with the tissue in quantitative calculation). For suprapatella, the echo times used in the T2 weighting were 2, 4, 8, 10, and 12 ms. (We optimized each set of echo times in quantitative imaging for each type of tissue.)
PLM Protocol
The suprapatellar tissue and the patellar cartilage blocks used in the MRI studies were fixed in 10% neutral buffered formalin at 4°C. These specimens were sent to Yale Pathology Tissue Services (New Haven, CT) for histological processes. Sections from the MRI-imaged specimen were made such as to coincide with the slice-selected region of the specimen during the MRI scan. Additional whole lengthwise and widthwise sections from the cartilage bone plugs and length-wise section from suprapatellar tissue were prepared.
The PLM system used in the study is a digital CCD camera that is mounted on a polarized light microscope (Leica, Germany). The output of the CCD camera generates 2 quantitative images, the optical retardation and the angular orientation. 20 The tissue sections were imaged at 3 optical resolutions: under an objective of 2.5× resulting in a 4.0-µm pixel size for the whole specimen, under an objective of 10× resulting in a 1.0-µm pixel size for the small specimens, and under an objective of 40× resulting in a 0.25-µm pixel size for detailed examination of cellular features. In total about 15 patellar cartilage sections (3 from each sample), 3 whole length and width (each patella sections), 12 widthwise and 3 lengthwise suprapatellar sections were imaged with PLM.
Data Analysis
Two-dimensional (2D) images from the patellar cartilage blocks and the suprapatellar fibrocartilage tissues were used to examine the results from both MRI and PLM. From each 2D image, a rectangular region of interest (ROI) was selected in the tissue to extract 1D depth-dependent cross-sectional profiles. The ROI was taken at approximately the same location in both PLM and MRI images. The width of the ROI for the intact joint was chosen such that the tissue thickness matched that of the cartilage blocks. Public-domain software ImageJ (v1.25a) and commercial software KaleidaGraph (v4.5.4) were used in the analysis with no manual scaling and adjustment during the averaging of the data.
Results
Physical Observation
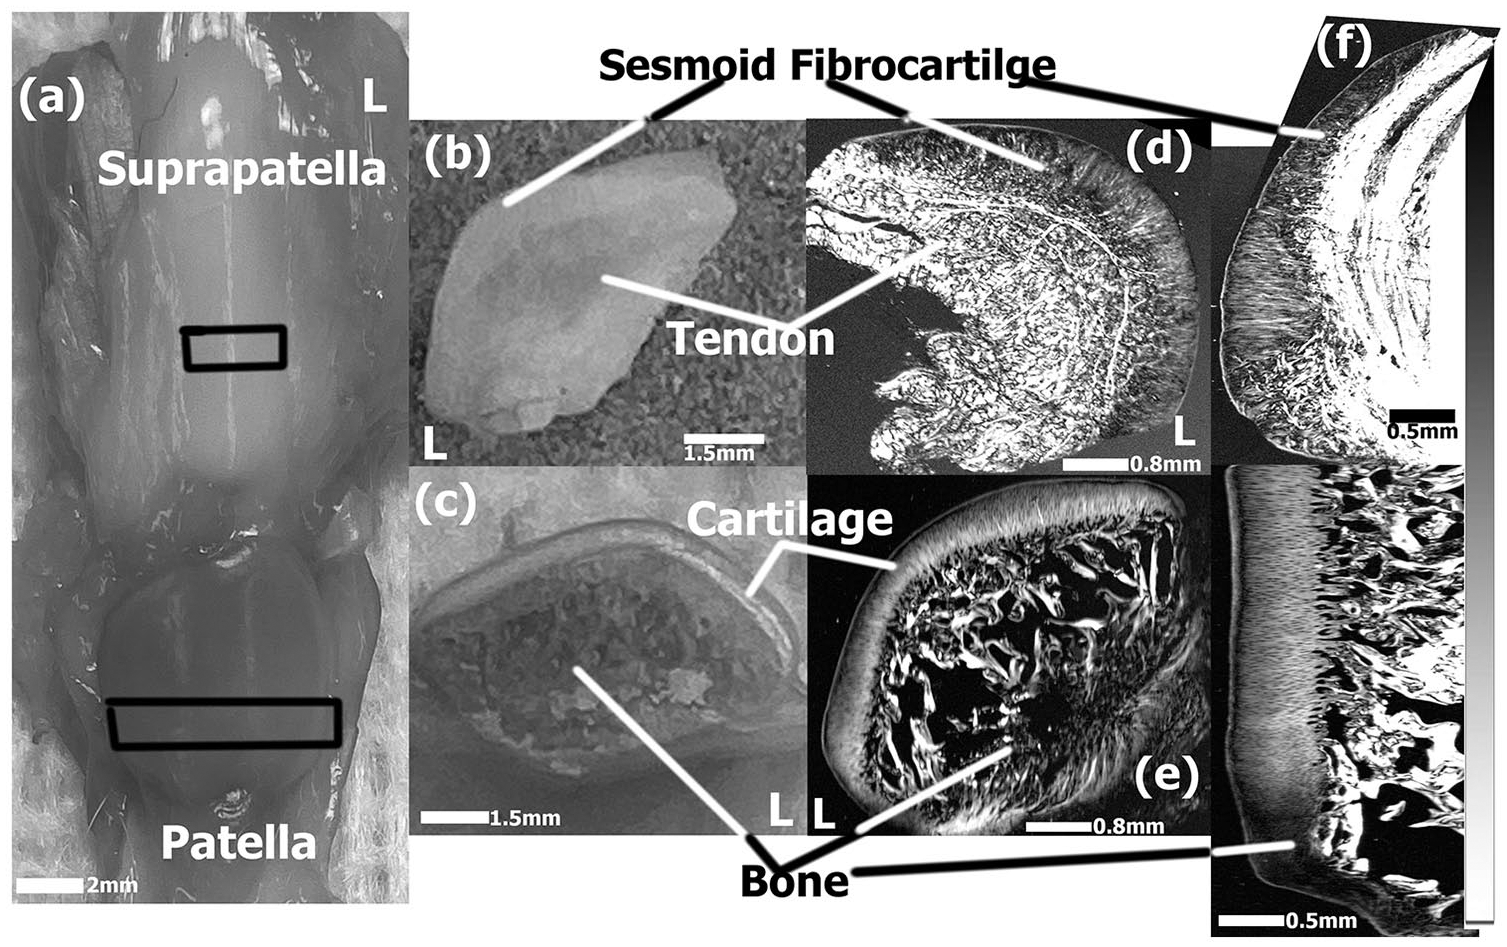
Fig. 1a shows a photo of the intact posterior aspect patella and suprapatella that articulate with the anterior aspect of the femur, where the suprapatella (appeared white to pinkish colored) is positioned above the base of the patella. The lateral aspect of the patella is slightly raised as compared to the medial and was consistent in all rabbits. The approximate measurement for the flipped triangular shaped patella was 10 × 8 × 4 mm (length × width × thickness) taken at the widest points ( Fig. 1c ). Similarly the suprapatella consistently appeared to have an elongated-oval bulging shape with approximate dimensions of 9 × 6 mm (major × minor axis) ( Fig. 1b ). The suprapatellar was observed to have a tougher cartilage.
(
The whole suprapatellar fibrocartilage and patellar cartilage cut centrally widthwise are shown in Fig. 1d and e as viewed by an optical microscope, while a medial cut lengthwise for the cartilage are shown as PLM images in Fig. 1f and g . The patellar cartilage has a slight thickness variation along the width, with a thicker tissue in the medial aspect as compared to the lateral side. Lengthwise, the patellar cartilage had insignificant variation of thickness with the exception of the apical region with highly packed chondrocytes. The thickness of the suprapatellar fibrocartilage decreases proximally away from the patella.
MR Images at 97.6-µm and 19.5-µm Resolutions
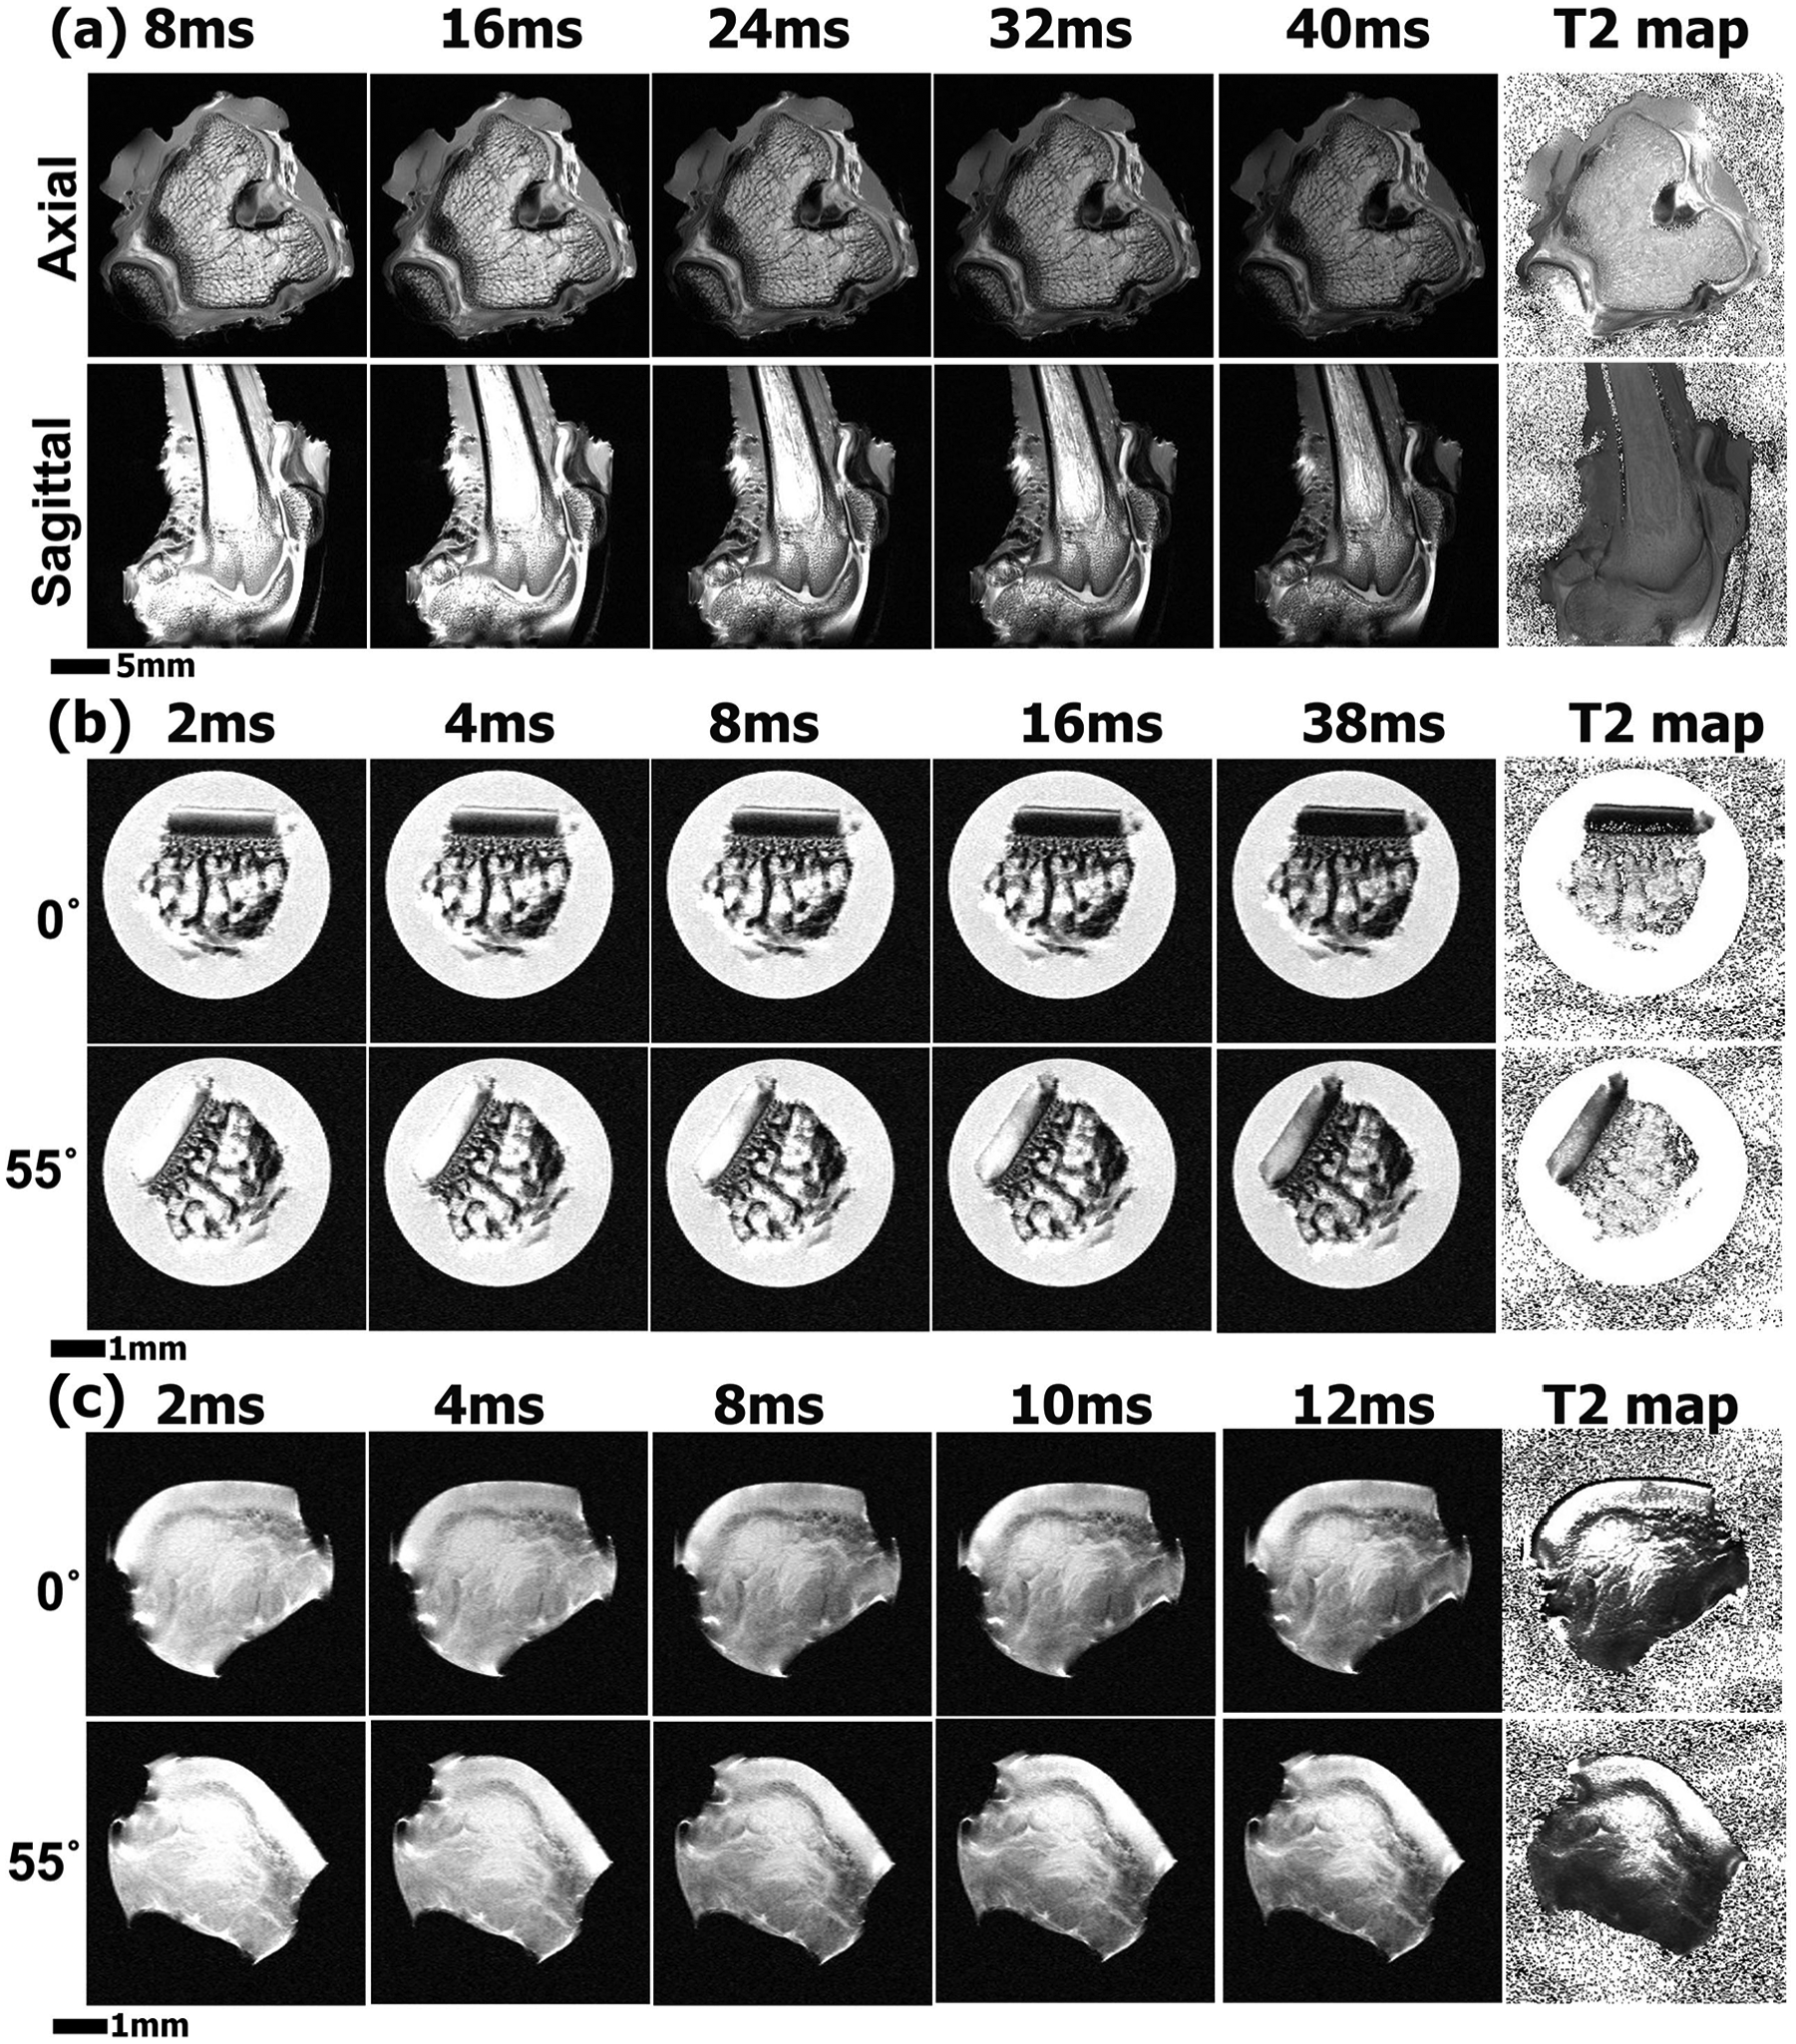
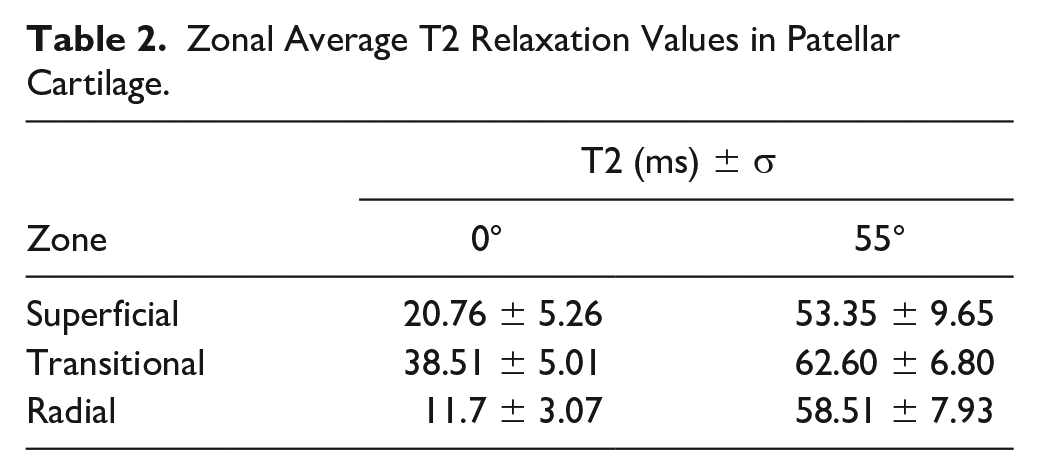
Fig. 2a shows 5 MRI T2-weighted intensity images of the axial and sagittal view of the intact knee joint at 97.6-µm resolution. The axial view in Fig. 2a shows with both medial and lateral aspect of the cartilage and its attachment to the sesamoid bone. Both the medial and lateral posterior aspects were seen to be slightly convex to almost flat, which were consistent in all rabbits. The medial side was just slightly longer than the lateral side with homogenous cartilage signal intensity. The suprapatella with its attached tendon was visualized on the sagittal view in Fig. 2a as a thin white streak bounded posteriorly by the tendon and a fat pad anteriorly. Fig. 2b shows a patellar cartilage block at the higher resolution at different echo times. In all four patellar blocks, a trilaminar appearance of the articular cartilage 13 was observed at an orientation 0° to the magnetic field B0 (which is vertically up), which disappeared at the magic angle (55° to B0). 21 The fibrocartilage in Fig. 2c demonstrated a more homogeneous and higher intensity compared with its underlying tendon. Quantitative T2 maps were calculated for both types of cartilages (the furthest right image on each row). The T2 image of the fibrocartilage ( Fig. 2c ) had a dark thin line on the surface.
(
Depth-Dependent T2 Profiles of Suprapatella and Patellar Cartilage in MRI
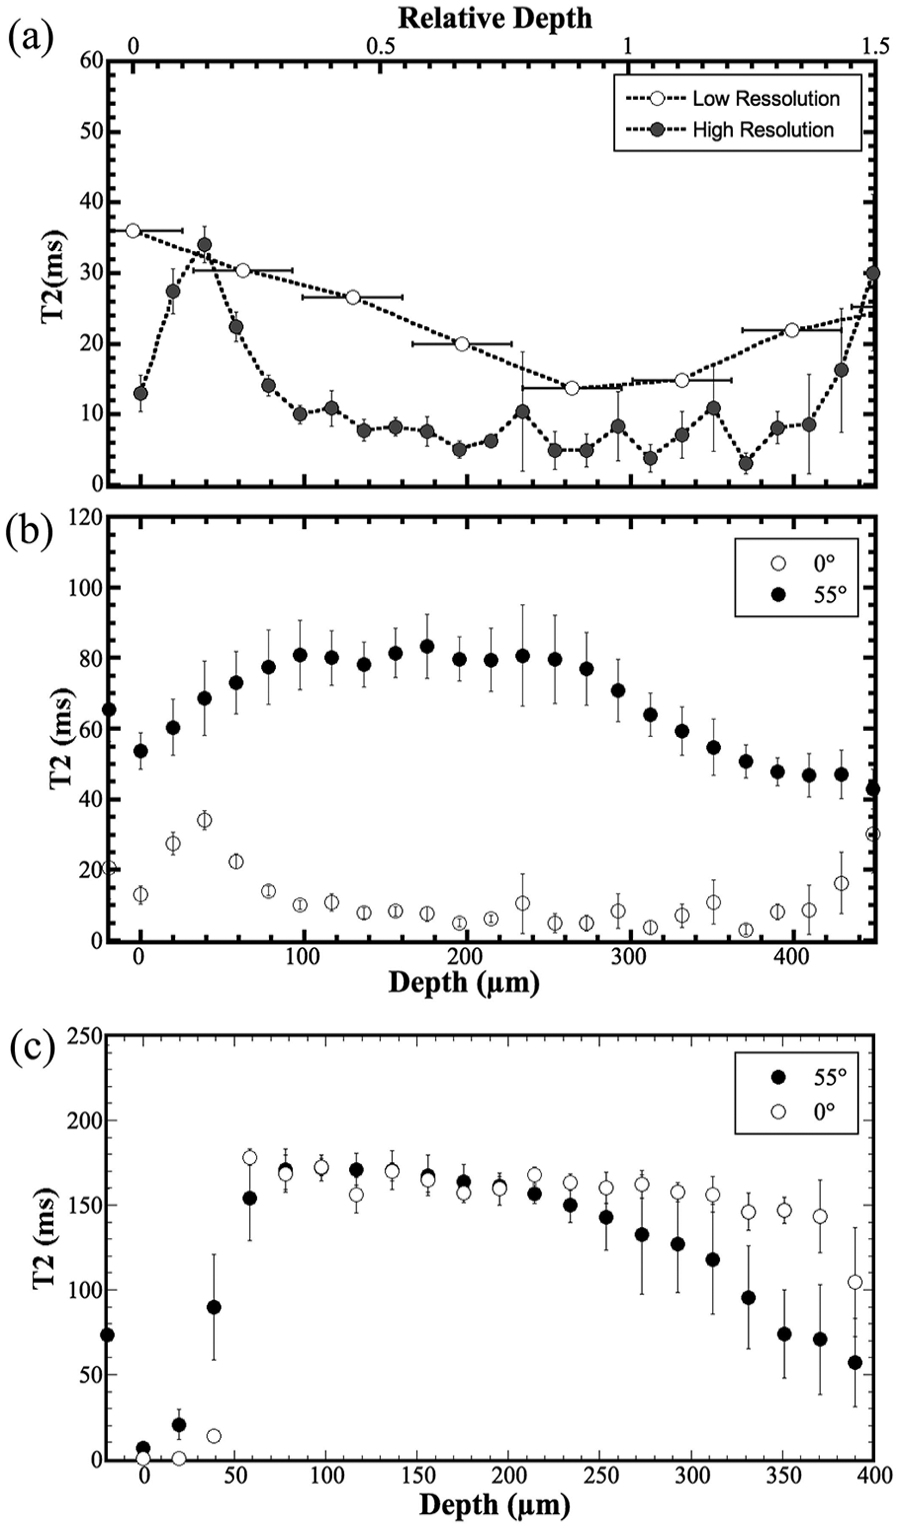
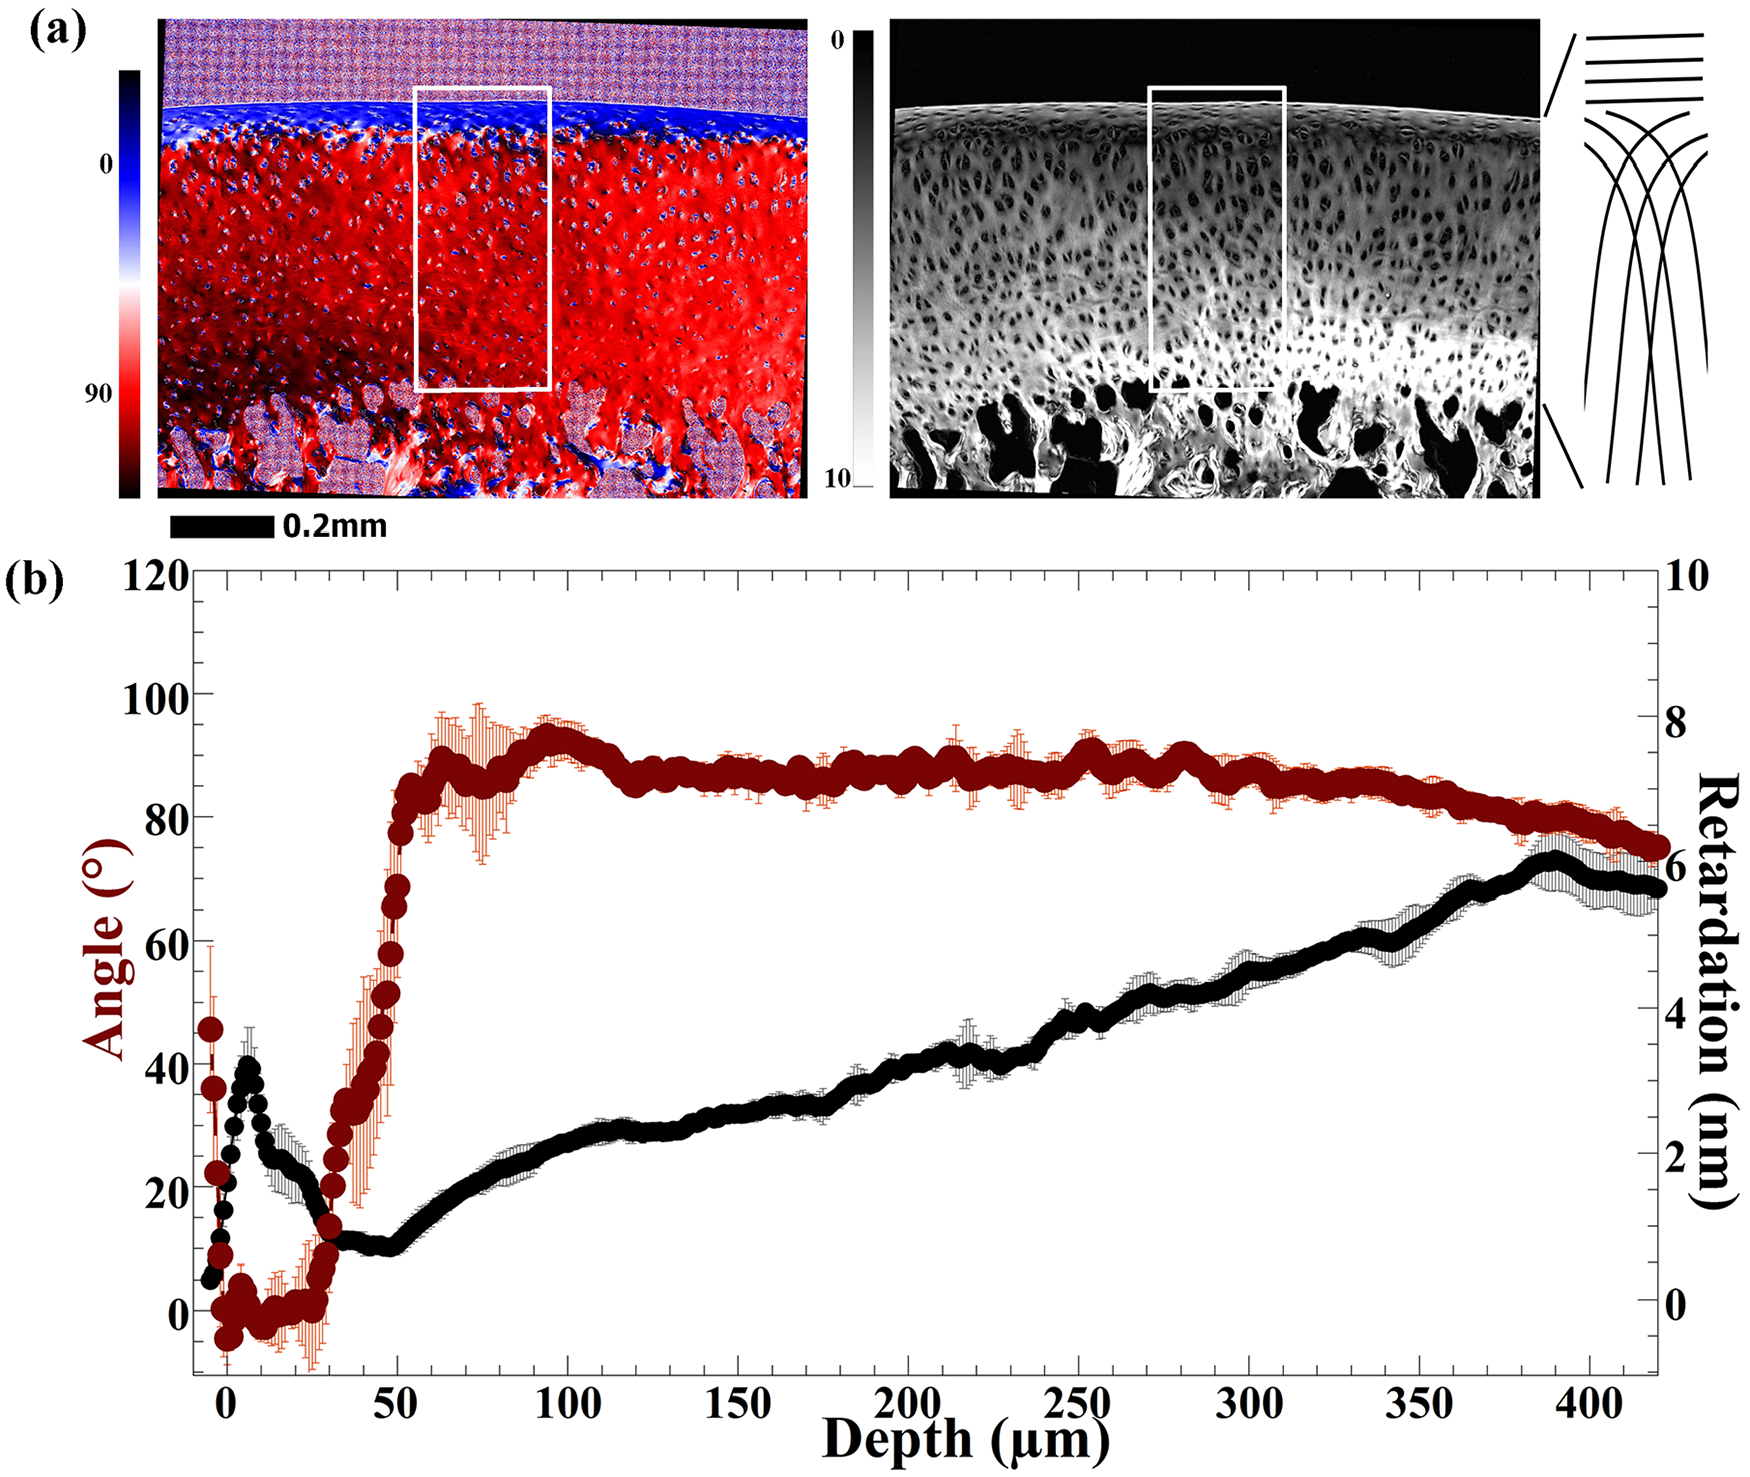
Quantitative 1D T2 profiles were calculated from the 2D images and shown as a function of tissue depth in Fig. 3 . In patellar cartilage ( Fig. 3a and b ), the asymmetrical bell-shaped curve of articular cartilage was visible only at the high resolution when the tissue was oriented at 0° to the magnetic field, confirming the characteristics from previous studies.13,15 The comparison between the low- and high-resolution profiles in patellar cartilage ( Fig. 3a ) shows the lack of tissue features in the low-resolution imaging. Based on the high-resolution profiles and the established divisional criteria, 13 we determined the thicknesses of the 3 structure zones in patellar cartilage as, the superficial zone from 0 to 20 µm, the transitional zone from 20 to 60 µm, and the radial zone from 60 to 440 µm. Tables 1 and 2 summarize the average zonal thicknesses of patellar cartilage and the zonal averaged T2 relaxation times. In contrast, the T2 profiles of the suprapatella cartilage at high resolution ( Fig. 3c ) show a lack of the magic angle effect for the upper half of the tissue (i.e., the 0° and 55° profiles were similar), and some weak T2 anisotropy for the lower half of the tissue (i.e., the 0° and 55° profiles were different). Based on the T2 characteristics, the suprapatella cartilage seems to have a thin surface layer that covers the much thicker main tissue of about 390 µm in thickness.
(
Zonal Thicknesses of Patellar Cartilage (n = 4 Specimens), Where the Division Was Based on the T2-0° Profiles of Patellar Cartilage. a
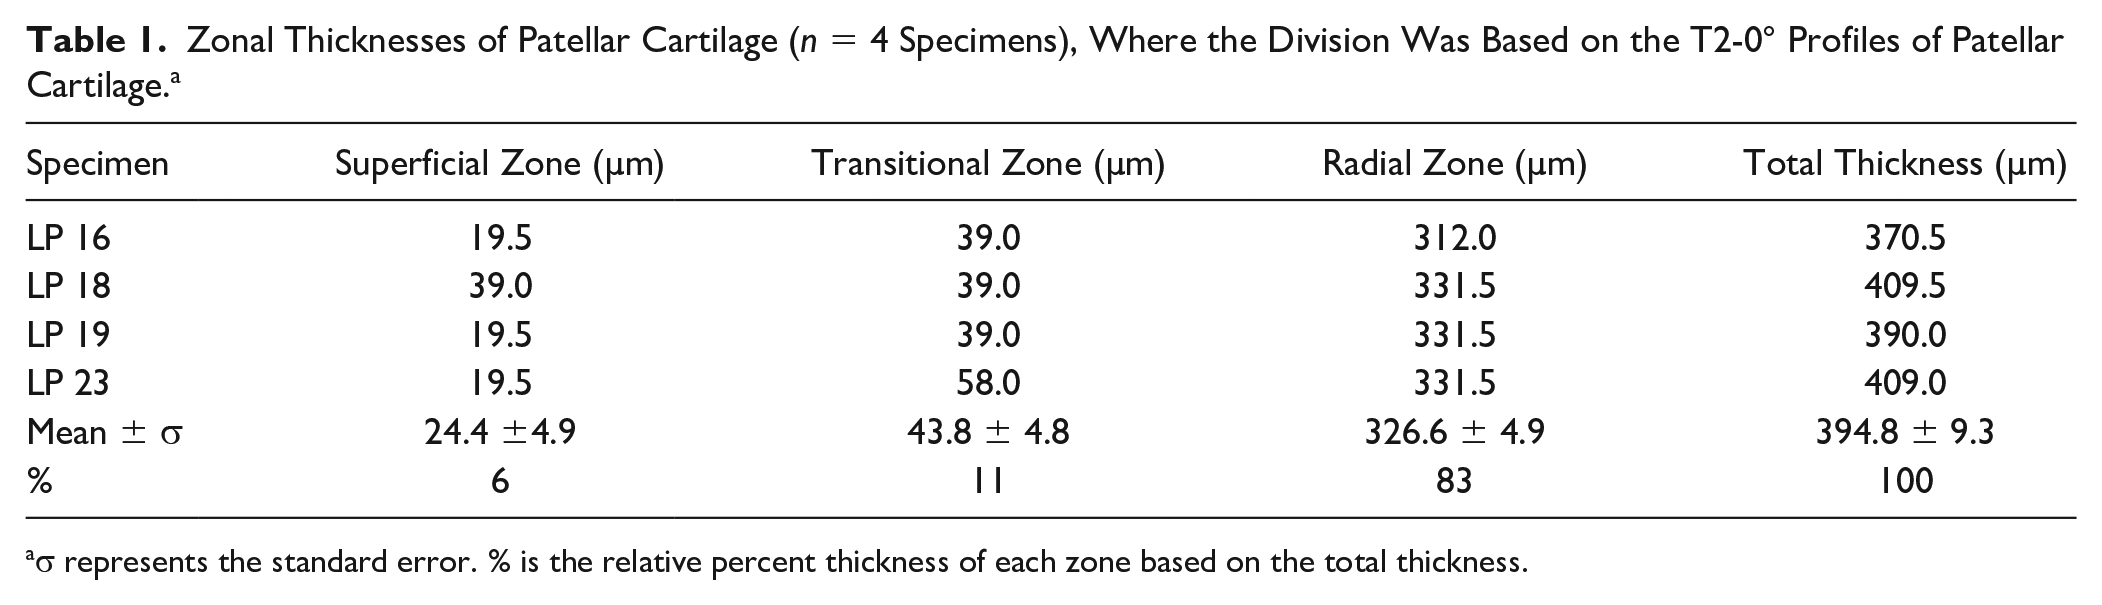
σ represents the standard error. % is the relative percent thickness of each zone based on the total thickness.
Zonal Average T2 Relaxation Values in Patellar Cartilage.
Quantitative Morphology by PLM
Two-dimensional quantitative maps of angle and retardation in the patellar cartilage and sesamoid fibrocartilage were obtained and analyzed for all histological sections. Fig. 4a shows one set of quantitative images for a patellar specimen at 1.0-µm pixel resolution. Several features can be identified. For example, the commonly known 90° difference between the surface cartilage and the deep tissue was observed in the angle map of patella cartilage. The 0° angle (blue color) in the superficial zone corresponds to the parallel orientation of the surface collagen with the articular surface. The collagen fibers change their orientation in the transitional zone and reach the 90° values of angles (red color) in the radial zone, suggesting the perpendicular orientation of the fibers in the radial zone. The retardation image from the patellar cartilage in Fig. 3a shows the prominence of chondrocytes in the tissue, with their orientations clearly changed from being parallel to the articular surface in the surface tissue to more random and in clusters in most of the deep tissue. 13 The location of the minimum values of the retardation indicates the center of the transitional zone where the fibers are mostly random between 2 peripheral zones that have a nominal 90° orientation difference. The minimum retardation in the patella cartilage was 2.2 ± 1.2 nm. Finally, the retardation and angle images in some other animal models (such as canine) contain a recognizable feature which has been attributed to the tide mark (the mineral front). 13 In the rabbit patellar cartilage, the quantitative images did not contain such a feature, which may indicate insufficient infusion of minerals in these 12- to 15-week-old rabbits.
Quantitative polarized light microscopy (PLM) of patellar cartilage (
Fig. 5a shows a set of quantitative images for one sesamoid fibrocartilage specimen at 1.0-µm pixel resolution. Several observations can be made from these quantitative PLM images. First, the top 10 µm of the sesamoid fibrocartilage can be viewed as the surface layer (or skin) of the fibrocartilage, which has some considerable portion of the collagen fibers being oriented in parallel with the surface of sesamoid fibrocartilage (as in the line drawings on the furthest right of Fig. 5a ). Below this organized layer, the quantitative values in most of the fibrocartilage have large variations, in contrast to the consistent zonal values in the PLM images for patellar cartilage. The retardation values for most of the nonsurface fibrocartilage varied around 1 nm, indicating the lack of a coherent fibril organizational structure.
Quantitative polarized light microscopy (PLM) of suprapatellar fibrocartilage (a) 2-dimensional angle and retardation images at 1-µm pixel resolution, with its associated depth-dependent profile results in (
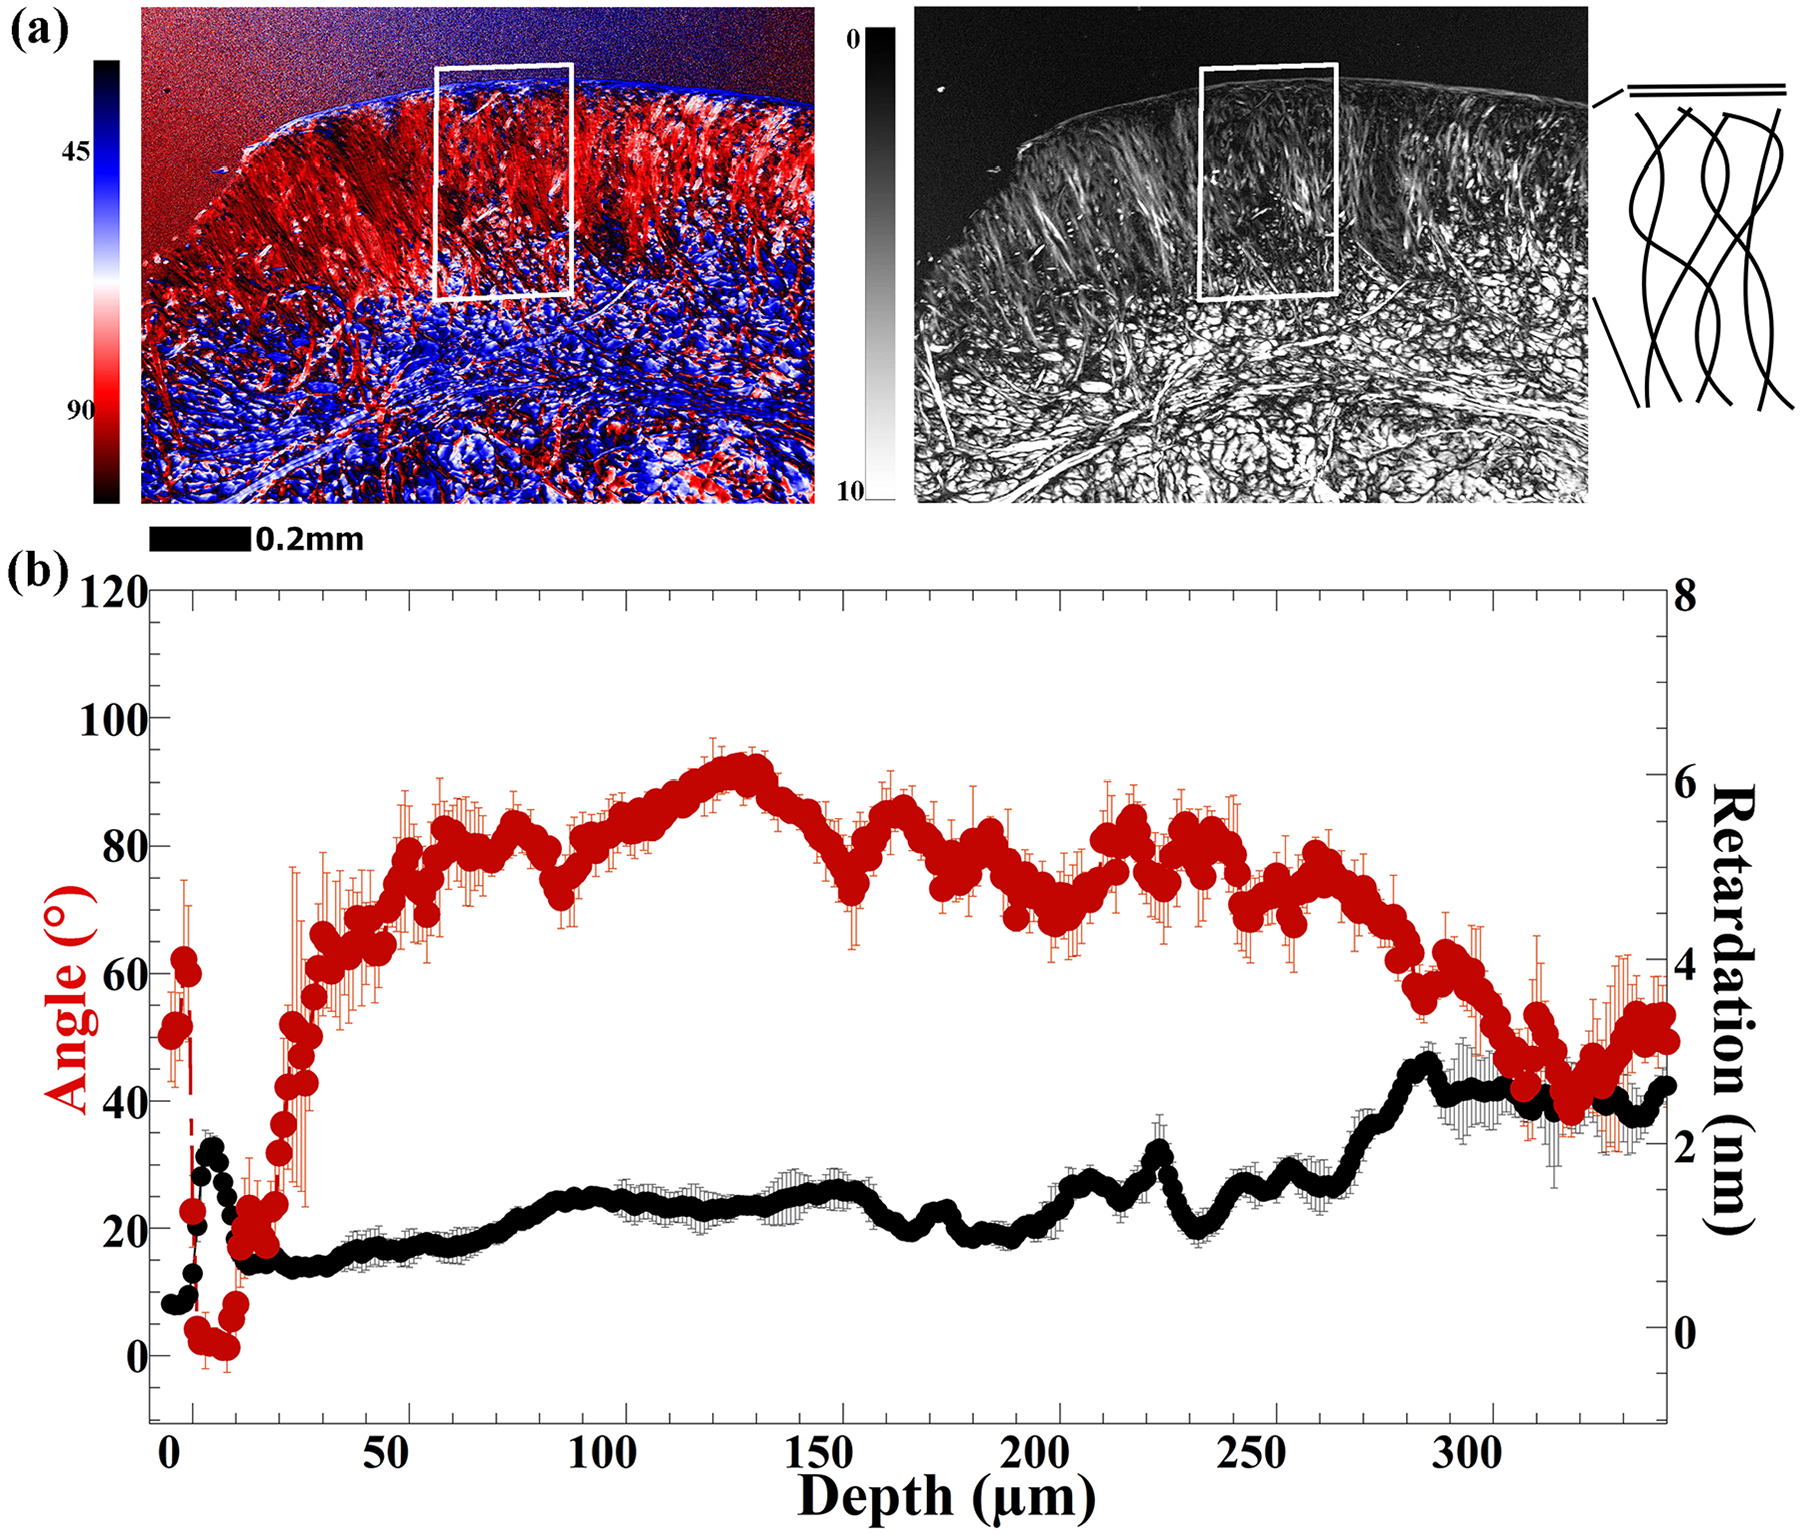
Fig. 6 shows PLM images of the same tissue regions at 0.25-µm pixel resolution, where each image was pieced together by several high-resolution images due to the smaller field of view. At this resolution, the cellular orientations in both tissues can be examined. Two major structural difference between these 2 types of cartilage tissue can be noted. First, patella has a well-defined 3-zone structure while suprapatella has an ill-defined interface between its surface layer and the main tissue. Second, patellar cartilage has rather uniform fibril density, while the heterogeneity in the fibril density in suprapatellar cartilage is clearly recognizable, likely indicating the loose packing/formation of individual collagen bundles.
Quantitative polarized light microscopy (PLM) images of patella (
The average thicknesses for both tissues from all histological sections were measured and are shown in Table 3 . For the patellar cartilage, the zonal division was carried out based on the criteria defined by a previous study. 13 For the suprapatellar fibrocartilage, only the total tissue thickness was measured from 2D images in both PLM and µMRI images. Note that the statistical comparisons between the 2 imaging techniques are influenced by the imaging resolutions.
Correlations of (a) the Averaged Zonal Thicknesses of Patellar Cartilage between µMRI (n = 3 specimens) and PLM (n = 9 Histological Sections from 3 µMRI Specimens at 3 Sections per Specimen) and (b) the Averaged Total Thickness of Suprapatellar Fibrocartilage Based on Direct Approximated Measurements from 2D Images of µMRI (n = 3 Cartilage Specimens) and PLM (n = 9 Histological Sections from 3 µMRI Specimens at 3 Sections per Specimen).a,b.
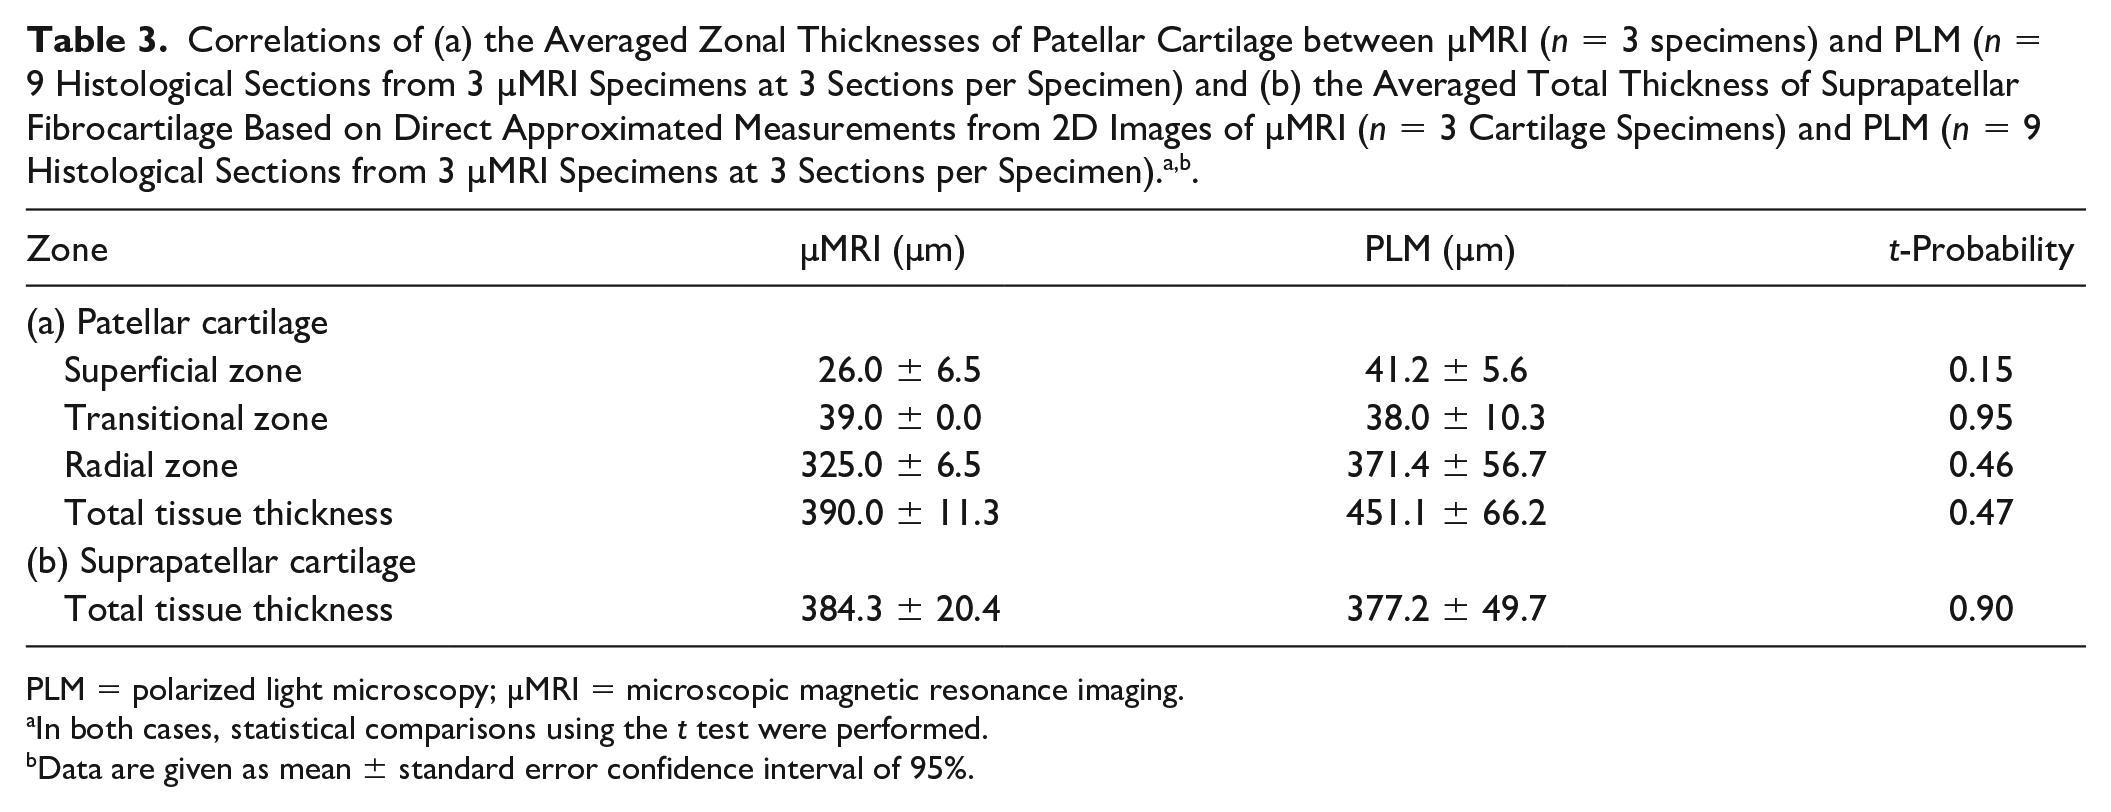
PLM = polarized light microscopy; µMRI = microscopic magnetic resonance imaging.
In both cases, statistical comparisons using the t test were performed.
Data are given as mean ± standard error confidence interval of 95%.
Discussion
The patellar cartilage is one of the most common tissues for osteoarthritic deterioration in knees.1,22 The extracellular matrix in patella composes mostly of 2 macromolecules (glycosaminoglycan, collagen), together with water. 23 The fibrillar collagen in the patellar cartilage in rabbits are of types I, II, III, and V, with distributions that vary with age. 4 In contrast to the presence of patellar cartilage in knee joints of both animals and human, the sesamoid fibrocartilage is not present in human knees but in some other joints of human such as the ankles (in Achilles tendon alongside the calcaneus). Histochemistry have shown that both types of cartilage have similar chemical properties. 8 The decrease in thickness of the suprapatella proximally results from reduced compression toward the ends of the vastus intermedius and rectus femoris muscle and away from the knee joint. This imaging study focused on patellar cartilage and suprapatellar cartilage in young rabbits, in order to understand the wide range of disorders associated with the patellofemoral regions associated with arthritis. Two different imaging techniques were used, MRI and PLM, which measure different aspects of the same tissue.13,15 MRI T2 anisotropy is sensitive to the mobility of water molecules in tissue, which is modulated by the interactions between water and macromolecules via the dipole interaction and chemical exchange. In contrast, quantitative PLM is based on optical birefringence, which in cartilage measures the fibril orientation (angle) and fibril organization (retardation). MRI T2 anisotropy and PLM parameters offer complementary information to the micro-structures of cartilage and other connective tissues.
Patella
The results of µMRI and PLM show that the patellar cartilage in rabbit has a morphological structure similar to articular cartilage in some other animals such as canine, 12 which can be divided along its thickness into three distinctly different histological zones. The superficial zone has its collagen fibers in parallel with the articular surface; its strong T2 anisotropy ( Fig. 3b ) and the high values in the PLM retardation ( Fig. 4b ) suggests that the superficial zone fibers are densely packed. This parallel arrangement of the surface fibers helps in easy sliding between itself and the opposing surfaces of the femur cartilage. In the transitional zone, the randomness of the collagen fibers results in its higher T2 values and lower T2 anisotropy, which yields the T2 peak at the 0° orientation ( Fig. 3b ). This randomness gives the minimum retardation for the tissue, centered around 50 µm below the articular surface in rabbit tissue. In the radial zone of the patellar cartilage, the collagen fibers are arranged in perpendicular to the articular surface; its strong T2 anisotropy and low T2 values for most of the radial zone again suggest a densely and well-arranged fibril organization. However, its retardation increases nearly linearly from the min value in the middle of the transitional zone to a max value near the cartilage-bone interface ( Fig. 4b ). This linear increment in the retardation suggests that although the overall organization of the collagen fibers in the radial zone stays consistently perpendicular to the articular surface throughout the entire radial zone ( Fig. 4b ), the coherence of this perpendicular fibril organization increases gradually over the thickness of the radial zone, from the most random organization in the transitional zone to the most coherent organization near the cartilage-bone interface. This 3-zone arrangement of the fibers in the noncalcified cartilage helps the tissue to withstand the load pressure from the femur and the sesamoid bone.
Suprapatella
In contrast to the triple structural zones in the patellar cartilage, the suprapatella only has 2 layers of tissue; a thin surface layer (~ 10 µm thick) and a much thicker main tissue. For the superficial layer of suprapatella, although MRI results showed a lack of articular cartilage–like anisotropy ( Fig. 3c ), it is likely caused by its thinness (~10 µm), which is difficult to measure even with our µMRI resolution (19.5 µm). The quantitative PLM profiles of the surface layer (0-10 µm in Fig. 5b ) are similar to these of the patellar cartilage, with a retardation peak around 5µm below the suprapatellar surface. Therefore, together with the short T2 values in the surface layer ( Fig. 3c ), we can conclude that the collagen fibers in the surface layer of suprapatella are well organized, dense, and in parallel with the surface. This structured surface layer of suprapatella likely aids to the reduction of friction when the surface slides with the femur cartilage. Our observation from the suprapatella results was in agreement with the qualitative study by Tischer et al., 8 who observed that the suprapatella has a thin layer of tissue with cells organized parallel to the articular surface basket and weave-like collagen fibers.
The majority of the suprapatella is its main tissue body, where the T2 values in µMRI are consistently high and have no orientational dependence in the magnetic field for the top half of the tissue ( Fig. 3c ). This lack of strong T2 anisotropy suggests that the majority of the suprapatella fibers must have a close-to-random and loose-packed pattern, similar to the transitional zone of the patella. Its much higher T2 values in most of the suprapatella tissue imply little dipolar interaction and abundant water molecules. However, based on the localized pixel averaging over the tissue depth, the collagen fibers in the majority of the suprapatella cartilage maintains an overall orientation that is perpendicular to the suprapatella surface ( Fig. 5b ). In the lower part of the suprapatella (c.f., over 300 µm in Fig. 5b ) when the fibers get imbedded into the quadriceps tendon, the collagen fibers of the suprapatella have an increased retardation (i.e., better organized) and a reduction of the orientation (i.e., change of the orientation). The random arrangement offers flexibility to the suprapatella cartilage and allows it to withstand stress from the quadriceps tendon during flexion, while at the same time to reduce pressure load from the femur.
Note that since fibrocartilage in saline produced insufficient MRI contrast, the fibrocartilage was imaged in air. Given the fact that the fibrocartilage is tough and the tissue blocks were large and intact (not pieces), our specimens did not dry out at the end of imaging experiments. However, imaging the fibrocartilage in air did have some consequences. The beneficial consequences were the ability to locate the surface accurately and a reduced partial volume effect (among tissue and saline) in quantitative calculation. The adverse consequence could come from the magnetic susceptibility difference between air and liquids, which could affect the accuracy of T2 for the surface pixel. Our choice in imaging protocols were supported by the agreement between our µMRI and PLM results for the surface part of fibrocartilage.
Limitations in µMRI Resolution
As the morphological structure becomes smaller, it becomes challenging to measure it accurately even with the fine resolution in µMRI. Using articular cartilage from canines, which was about twice as thick as cartilage in rabbits, we showed in several publications that the zonal thicknesses by µMRI are statistically significantly correlated with the zones by PLM.13,24 Using articular cartilage from rabbits, we noted recently 25 that the thickness measurements of the thin zones (superficial and transitional zones) can be different between µMRI and PLM; we concluded that this difference “is likely caused by the difference in the imaging resolution (9.75 µm in µMRI, 1.0 µm in PLM). . . . However, the correlations in the total tissue thickness and the thick radial zone are excellent (i.e., no statistical difference between µMRI and PLM zones were found).” In this study, we also observed thickness differences measured by µMRI and PLM ( Table 3 ). Due to a finer resolution and a thin slice, the superficial zone and transitional zone measurements by PLM are considered to be accurate.
Conclusion
To the best of our knowledge, this was the first quantitative imaging study that characterized the morphological structures of articular cartilage in the patella and sesamoid fibrocartilage in the suprapatella of the rabbit quantitatively and at high in-plane resolutions. Certainly, these 2 different types of cartilage play different roles in the joint motion biomechanically. Despite the thinness of these rabbit tissues, the high spatial resolutions in our µMRI and PLM are sufficient to resolve the depth (i.e., thickness) dependent tissue properties. 25 The quantitative nature of the results was used to explain the morphological structures of the tissues. The articular cartilage behaved similar to other hyaline cartilages, with 3 clearly distinguishable structural zones. The fibrocartilage had a thin surface layer that covers the rest of the tissue body, which has mostly random organization of collagen fibers hence no relaxation anisotropy in µMRI. The quantitative nature of our µMRI and PLM imaging provides an important set of baseline characteristics to future studies of arthritis research using the animal models.
Footnotes
Acknowledgments and Funding
Yang Xia is grateful to the National Institutes of Health (NIH) for a R01 grant (AR 069047). The authors are in debt to Mr. Farid Badar for the technical help in imaging, to Dr. Adam Lauver and Ms. Barbara Christian (Department of Pharmacology & Toxicology, Michigan State University, East Lansing, Michigan) for providing the rabbit samples, and Ms. Carol Searight (Oakland University) for linguistic editing.
Declaration of Conflicting Interests
The author(s) declared no potential conflicts of interest with respect to the research, authorship, and/or publication of this article.
Ethical Approval
Ethical approval for the tissue study was waived by the Institutional Animal Care and Use Committee (IACUC) at Oakland University, because the specimens were the discarded tissue for an unrelated and approved experimental study.
Animal Welfare
The present study followed international, national, and/or institutional guidelines for humane animal treatment and complied with relevant legislation.