
Abstract
Objective
Microscopic magnetic resonance imaging (µMRI) and polarized light microscopy (PLM) are used to characterize the structural variations at different anatomical locations of femoral cartilage in young rabbits (12-14 weeks old).
Design
Four intact knees were imaged by µMRI at 86 µm resolution. Three small cartilage-bone specimens were harvested from each of 2 femoral medial condyles and imaged by quantitative µMRI (T2 anisotropy) at 9.75 µm resolution (N = 6). These specimens, as well as the other 2 intact femoral condyles, were used for histology and imaged by quantitative PLM (retardation and angle) at 0.25 µm to 4 µm resolutions.
Results
Quantitative MRI relaxation data and PLM fibril data revealed collaboratively distinct topographical variations in both cartilage thickness and its collagen organization in the juvenile joint. Cartilage characteristics from the central location have a 3-zone arcade-like fibril structure and a distinct magic angle effect, commonly seen in mature articular cartilage, while cartilage at the anterior location lacks these characteristics. Overall, the lowest retardation values and isotropic T2 values have been found in the distal femur (trochlear ridge), with predominant parallel fibers with respect to the articular surface. Central cartilage is the thickest (~550 µm), approximately twice as thick as the anterior and posterior locations.
Conclusion
Distinctly different characteristics of tissue properties were found in cartilage at different topographical locations on femoral condyle in rabbits. Knowledge of location-specific structural differences in the collagen network over the joint surface can improve the understanding of local mechanobiology and provide insights to tissue engineering and degradation repairs.
Keywords
Introduction
Articular cartilage (AC) is a thin layer of protective and shock-absorbing tissue that distributes loads effectively over a joint surface. AC has very limited healing potential and can develop degenerative changes due to aging, excessive usage, and trauma, which all eventually clinically lead to osteoarthritis and other joint diseases.1,2 Aging has been considered a primary risk factor of osteoarthritis, which may start with biologically and mechanically compromised AC, and subsequently results in tissue loss and bone deformation. As any joint has specific 3-dimensional (3D) shapes or contours and a unique set of biomechanical environments, any joint degradation at its early stages must have complex variations over joint surfaces, dependent upon the location of the initiation event.3,4 A recent study 5 has reported age-related topographical variations in terms of cartilage thickness, biomechanical response, and subchondral bone measurements in rat knees after surgical destabilization of the medial meniscus. As bone and cartilage are interdependent structural components in any joint, the loading conditions during the aging process are speculated to modulate the structural and physiological responses of bone, as well as AC, which can be highly localized. 6
AC contains living cells (chondrocytes) embedded in an extracellular matrix (ECM). ECM consists mainly of proteoglycans (PG), type II collagen fibrils, and water (65%-80%). The architecture of ECM in adult AC is dominated by its collagen network, which possesses a 3-zone arcade-like fibril structure. 7 Starting from the top articular surface, mature AC can be subdivided into 3 zones based on this arcade-like structure, beginning with the superficial zone (SZ) where fibers run in parallel with the surface, continuing to the transitional zone (TZ) where fibers run randomly without a predominant orientation, and ending with the radial zone (RZ) where fibers are oriented mainly perpendicular to the surface. In comparison, neonatal cartilage is known to lack this arcade-like zonal structure and appears more homogeneous and isotropic with a higher matrix to cell ratio. Although the mechanisms involving the remodeling of mostly isotropic neonatal cartilage into the arcade-like structure in mature cartilage is still not clear, there is strong evidence of significant structural adaptations with age and exercise.8-10 Better understanding of the age-related changes in cartilage morphology should provide new insights toward the progression of disease in patients at different age groups and the design of more effective ways to repair degradative tissue.
In this study, we use quantitative protocols in microscopic magnetic resonance imaging (µMRI) and polarized light microscopy (PLM) to assess the structural variations in young (skeletally immature) cartilage at different locations of femoral condyle in rabbits. In µMRI studies of cartilage, T2 anisotropy is known to be sensitive to the organizational architecture of the collagen fibrils in AC, which gives rise to the well-known laminar appearance in T2-weighted MRI images.11,12 In PLM, the birefringence properties of ECM in cartilage can be quantitatively examined by the retardation and angle measurements, which correspond to fibril organization and fibril orientation respectively.13-15 There exists a number of well-established in situ correlations between T2 anisotropic properties and the birefringence properties in cartilage and other connective tissues. 13 This study aims to better understand the structural specifics in skeletally immature tissue in the rabbit model, related to its potential in the use of osteoarthritis studies, and the remodeling of the collagen fibril network during growth and maturation at different anatomical locations over the same joint surface.
Material and Methods
MRI of Intact Joint
Four knee joints from 12- to 14-week-old healthy rabbits (White New Zealand, male) were obtained from a nearby higher education institution. The animals were sacrificed for an unrelated biomedical study, which was approved by the relevant institutional review committees (PROTO202000161). The animals were frozen immediately at −80 °C after necropsy and thawed at 4 °C before specimen harvesting. Each intact joint was placed in a glass tube with a cotton swab soaked with physiological saline to avoid dehydration and imaged at room temperature using a Bruker AVANCE IIIHD NMR spectrometer equipped with a 7 Tesla/89 mm magnet and 25 mm rf resonator (Bruker, Ettlingen, Germany).
All 4 intact knees were imaged in sagittal and coronal views using the standard multi-slice multi-echo sequence, where each imaging experiment had 8-10 slices and each slice had 6-8 intensity images. Each slice had a thickness of 0.8 mm with a gap of 1 mm between any two neighboring slices. The imaging TE was 8.23 ms, and the TR was 3 s. The field of view (FOV) was 22 × 22 mm2 and the 2-dimensional (2D) acquisition matrix was 256 × 128, which was later reconstructed to 256 × 256, resulting in a pixel size of 86 µm.
µMRI of Cartilage-Bone Specimens
After imaging the intact joints, 2 knees were opened (
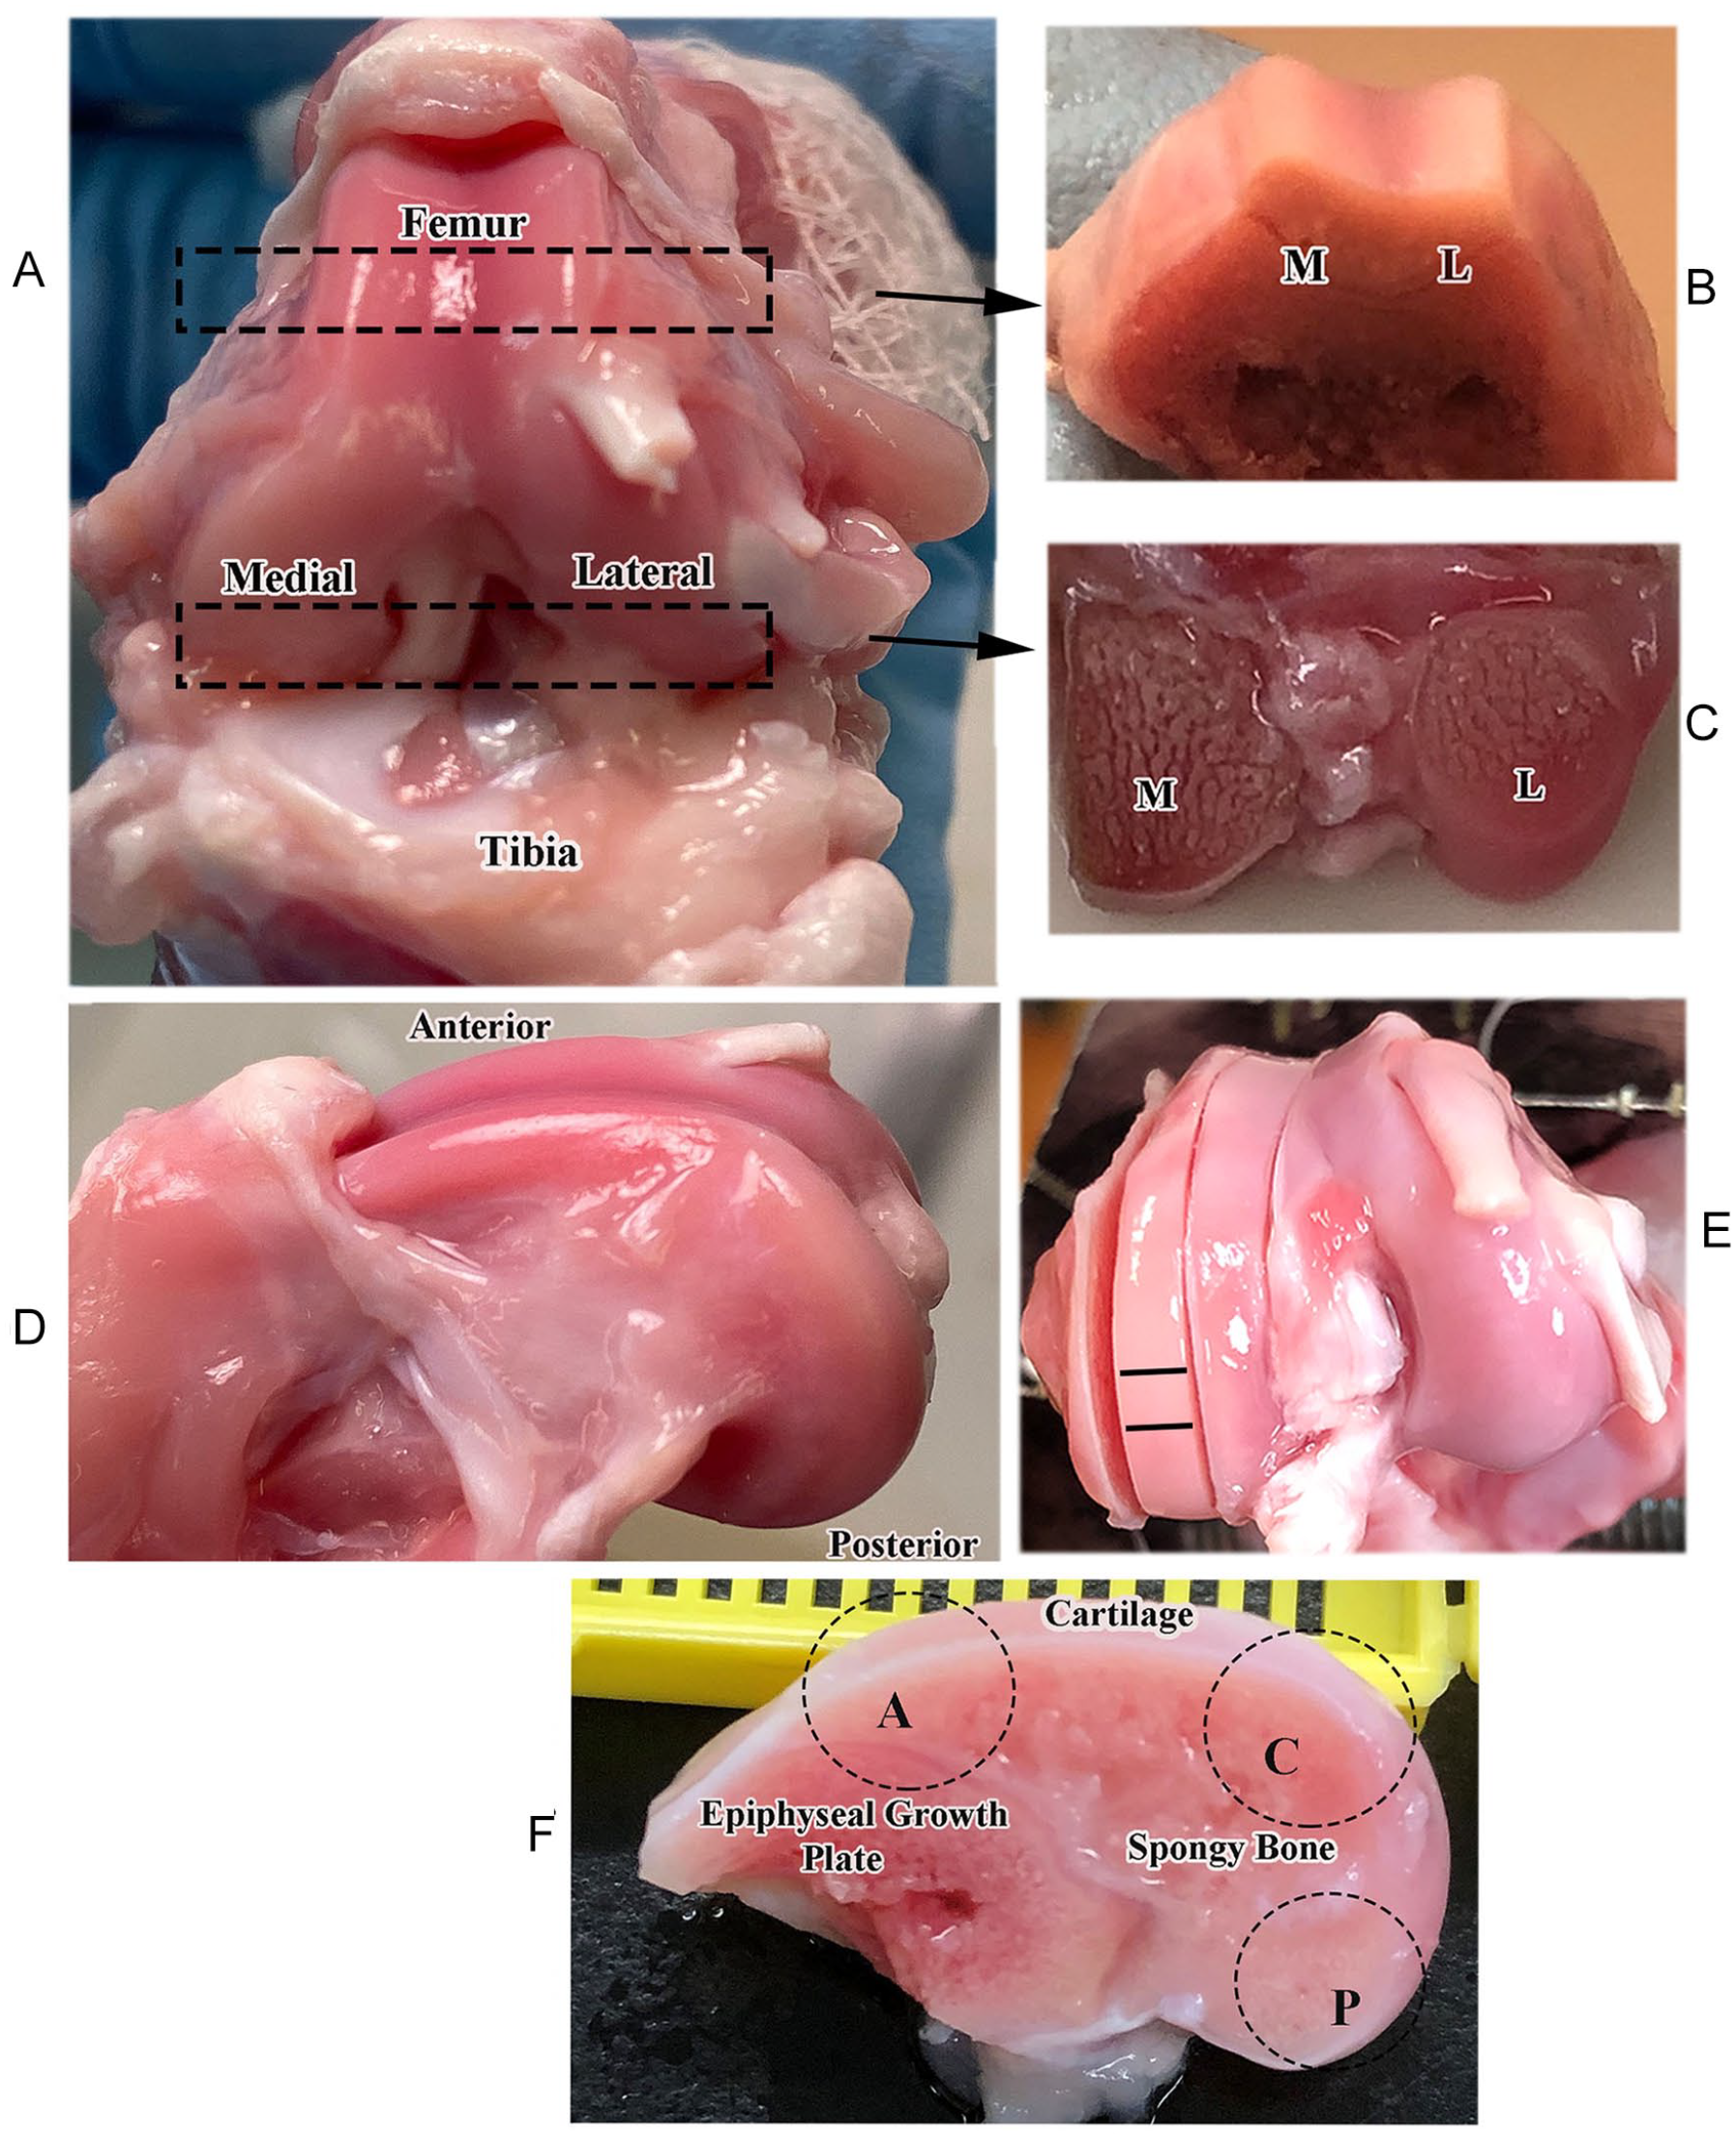
(
Each of the cartilage-bone specimens was imaged independently 5 times using the identical imaging parameters, with the exception of the physical orientations of the specimen with respect to the external magnetic field B0, ranging from 0° to 125° (where 0° is defined as the normal axis of cartilage surface being in parallel with B0), with the use of a homebuilt rotating device. 16 A magnetization-prepared 2D spin-echo sequence was used for the quantitative T2 imaging of all cartilage-bone specimens, with TR of 2 s, TE of 6.47 ms, and the slice thickness of 0.8 mm. The location of the slices throughout each series of imaging experiments was identified to be the same during the project. The 2D matrix was 256 × 128, which was reconstructed into 256 × 256; the FOV was 2.5 × 2.5 mm2, resulting in a pixel size of 9.75 μm for all cartilage specimens.12,17 The TEs of the leading contrast segment (TEc) had 4 increments: 2, 16, 22, and 46 ms for the central (C) and posterior (P) specimens and 2, 16, 46, and 60 ms for the anterior (A) specimens.
PLM Specimens and Protocol
All 6 cartilage-bone specimens after the noninvasive µMRI were processed for histology. In addition, 2 remaining intact joints were processed for whole-joint histology, where the full-length and width slabs (4-5 mm thick) were cut in transverse planes (across tibiofemoral and patellofemoral regions, as in
Each cartilage-bone specimen (A, C, and P) had at least 3 full-thickness histological sections, which were imaged individually at the identical orientation under 10x and 40x objectives. This yielded a pixel size of 1 µm and 0.25 µm, respectively. The 10x images were used for quantitative retardation and azimuthal profiles, and the 40x images were used to observe the territorial matrix surrounding the individual chondrocytes at different depths. Histological sections of the intact femoral condyles were imaged under 2.5x and 5x objectives, which yielded pixel sizes of 4 µm and 2 µm, respectively. These low-resolution optical images were used to study the heterogeneity of collagen fibril organization across the intact femoral condyles in orthogonal directions.
Image and Data Analysis
Quantitative maps of T2 relaxation were calculated by a single exponential fitting of the data on a pixel-by-pixel basis for all specimens. Each cartilage-bone specimen was imaged in µMRI 5 times at 5 different orientations, with respect to B0, which resulted in 20 independent proton images and 5 calculated T2 maps for each specimen. On each quantitative 2D T2 image, 1 rectangular region of interest (ROI), with 15 parallel neighboring columns, was selected manually and averaged into one 1-dimensional (1D) depth-dependent T2 profile, which enabled the observation of the depth-dependent T2 anisotropy in the tissue and the comparison among profiles from different imaging experiments. As the column-averaging occurred perpendicular to the tissue depth, the pixel resolution in the T2 profiles was still 9.75 μm along the tissue depth. The width and location of ROI were the same for all independent imaging experiments of each sample, with the use of the image analysis software ImageJ. All 2D images and 1D profiles, where each came from 1 independent imaging experiment, used the identical scaling and settings without any additional adjustment.
On each quantitative PLM image of cartilage specimens obtained at 10x objective, 146 parallel neighboring columns, which would have approximately the same width as the ROI thickness in µMRI, were averaged to produce 1 pair of 1D quantitative retardation and angle profiles across all tissue zones. The 40x images enabled the visualization of the shape and orientations of chondrocytes, with respect to the surrounding territorial and interterritorial matrix at different depths (histological zones) among all histological sections from 3 locations. The post-acquisition analysis used a public domain software ImageJ (NIH) and a commercial software KaleidaGraph (v4, Synergy Software, Reading, PA).
Results
MRI of the Intact Knee Joint
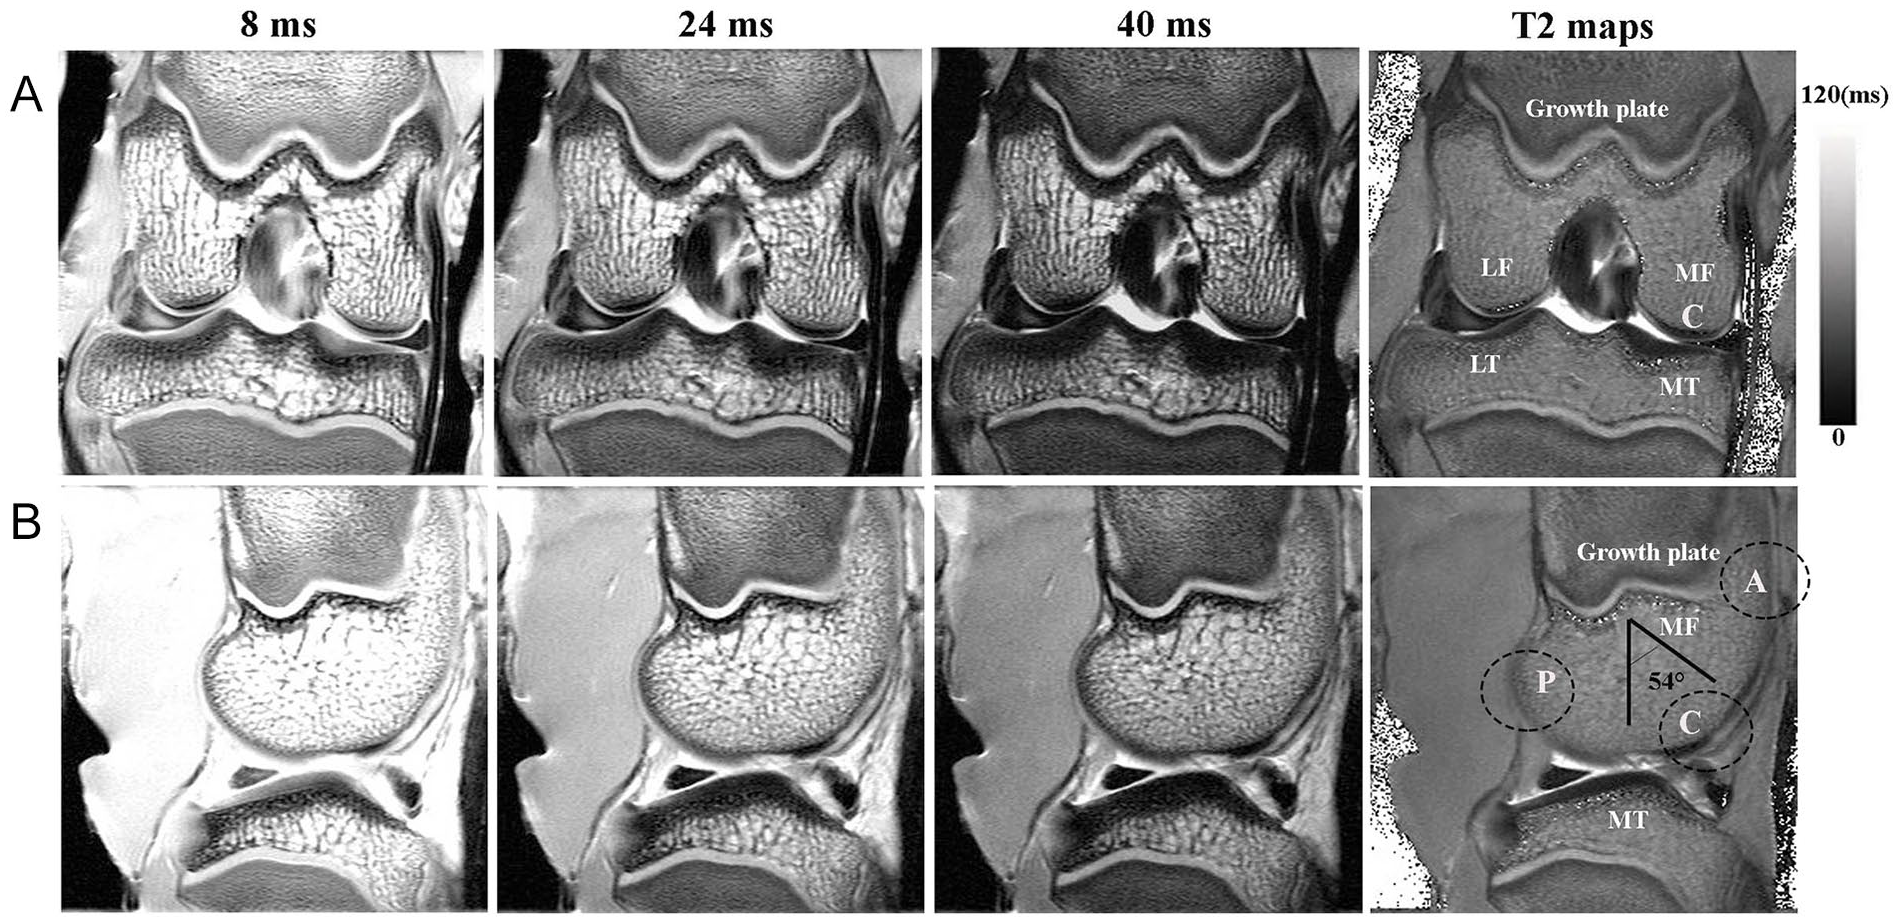
Before opening the knee joints, the intact knees were imaged by µMRI at the pixel resolution of 86 µm. Figure 2 shows the sagittal and coronal views of T2-weighted intensity images, respectively, together with their respective quantitative T2 images. The epiphyseal cartilage (growth plate) appears brighter and homogeneous in intensity; in contrast, signal variations can be seen over the thickness of AC, especially in femur, even at the low 86-µm resolution. The appearance of AC in T2-weighted MRI images was highly sensitive to its orientation with respect to the external magnetic field B0 (vertically up). Because of its curved articular surface, the femoral condyle provides a convenient model to study the orientation effect of cartilage T2 relaxation with respect to B0 (i.e., the magic angle effect), as long as the quality of cartilage is the same at every location. If T2-sensitive structural variations exist as expected in juvenile joint during development, the interpretation of imaging results needs additional considerations. In our imaging results, among the 3 topographical locations on the central medial femur, the central location (C) was at about the magic angle (~54.74°) to B0 (sagittal view), where the influence of the dipolar interaction to the spin-spin relaxation was minimized; consequently, the cartilage in the central region appeared thicker than at the 2 other locations, anterior (A) and posterior (P). Away from the magic angle location, the femoral cartilage appeared bilaminar, with a high intensity surface layer and a low-intensity deep layer. Due to the pixel size, signal variations for thinner regions (A and P) can be influenced by the volume averaging effect in imaging.
(
PLM Images of the Intact Femur Joint at 4 µm Resolution
Figure 3
displays the quantitative retardation images of the whole joint by PLM, at the 3 cross-sectional surfaces shown previously in
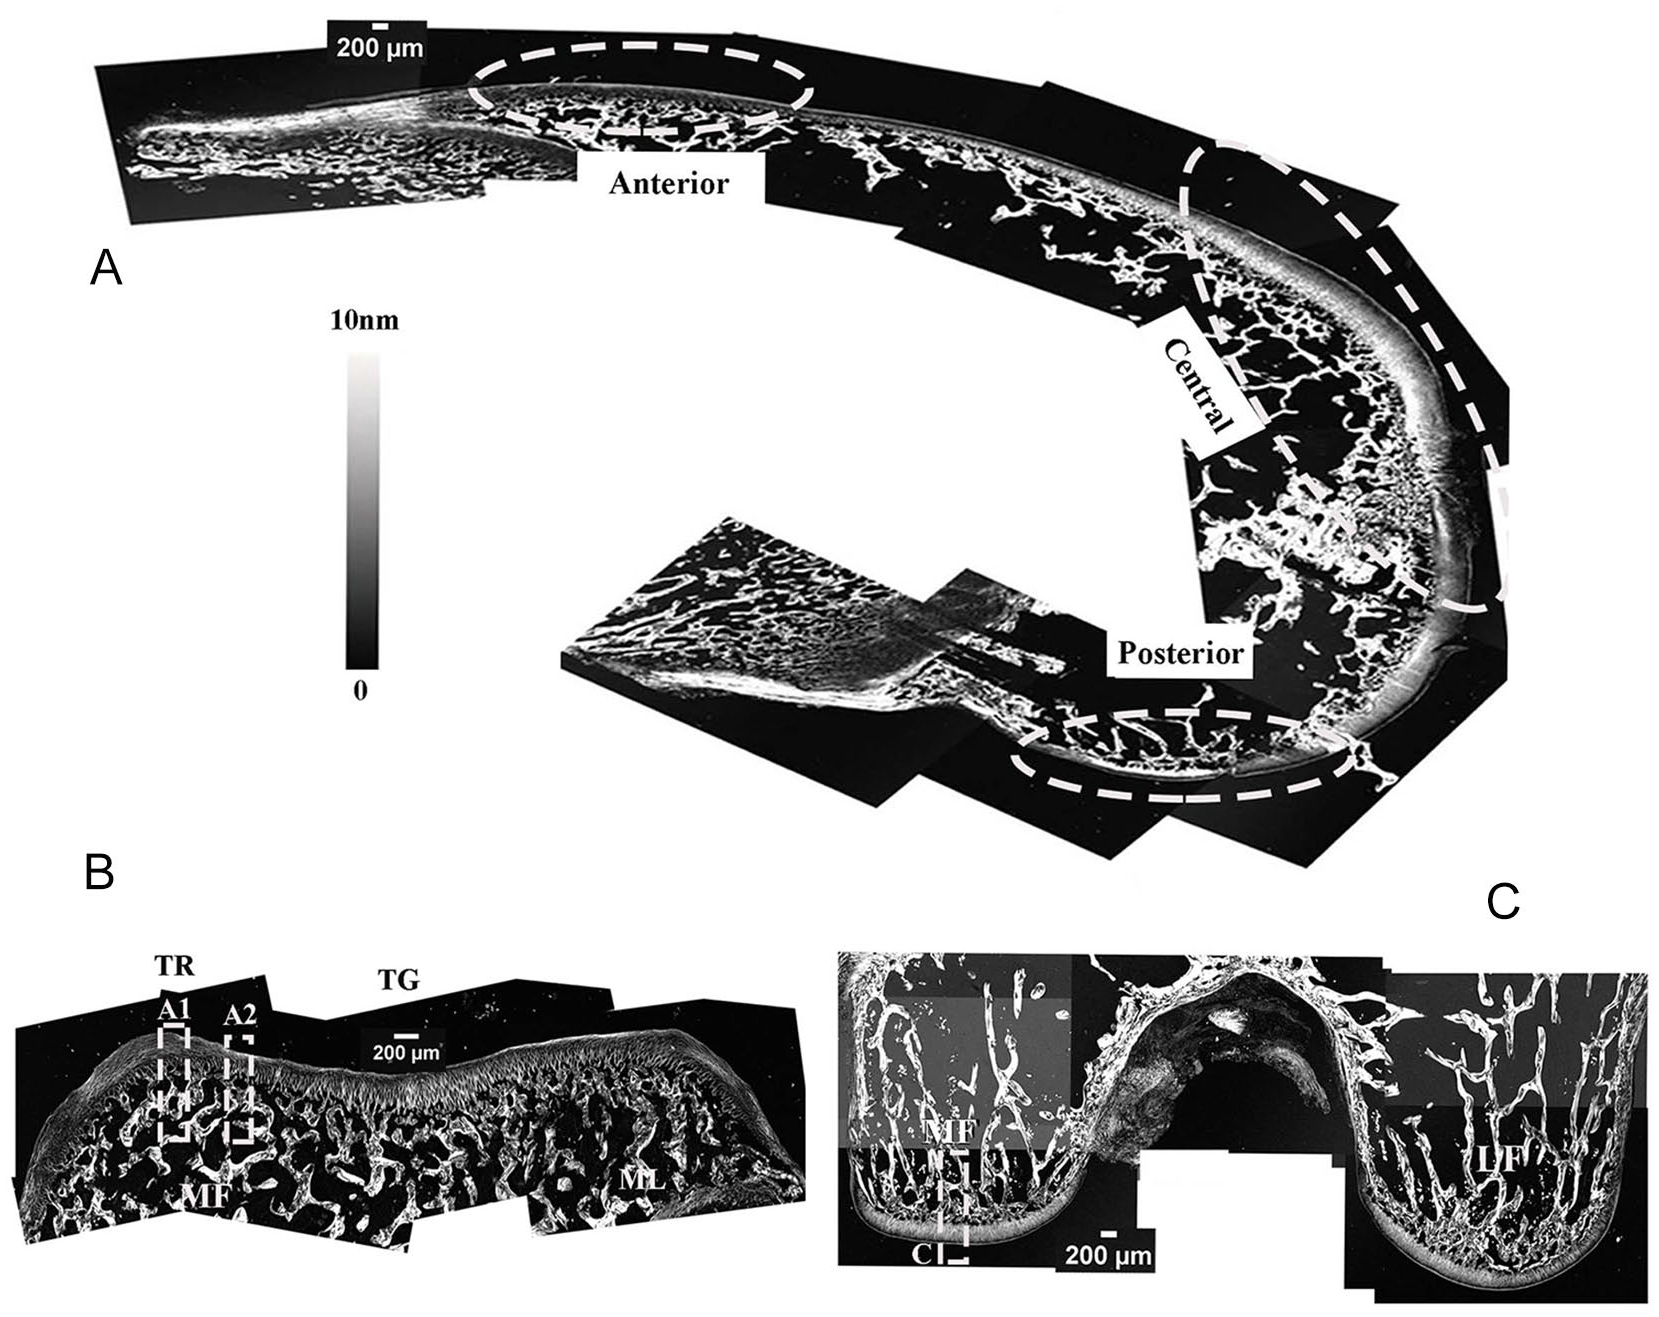
(
Figure 3B
and
MRI of Site-Specific T2 Anisotropy Results
Figure 4
shows the T2 anisotropy results at the higher spatial resolution of 9.75 µm in µMRI from 3 specimens acquired from the anterior, central, and posterior regions of femoral medial condyle, shown previously in
Figures 1F
and
3A
. (Note that each specimen was imaged 5 times between the orientations of 0° and 120°. As these images appeared similar visually, only 2 images for each location were shown in the figure. The most insightful information of T2 anisotropy among each set of 5 images can be obtained from the depth-dependent profiles in
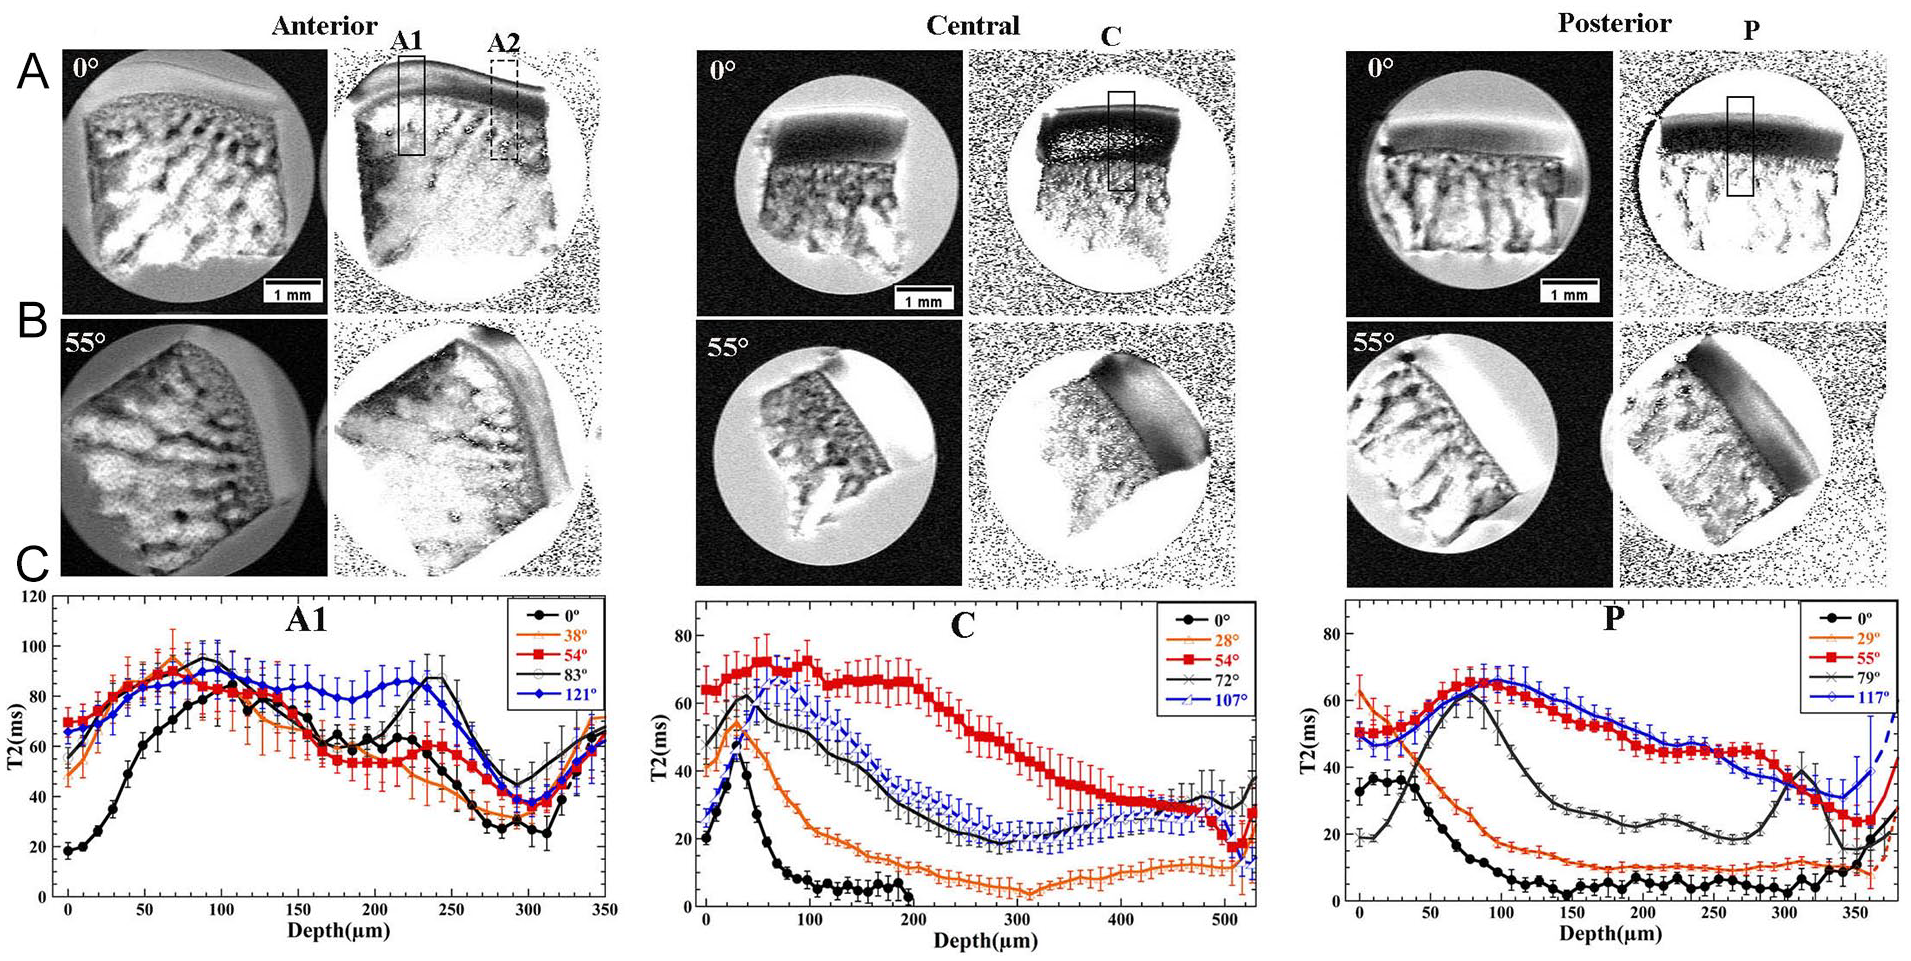
Two-dimensional µMRI intensity images (left) and corresponding T2 images (right) of 3 small cartilage-bone specimens harvested from 3 designated locations on the slice of femoral medial condyle, imaged at 9.75 µm/pixel at (
Quantitative PLM Images of Cartilage-Bone Specimens (10x Imaging)
Figure 5 shows the quantitative PLM results at 1 µm pixel resolution from the cartilage specimens at 3 topographical locations on the medial femur, whose µMRI data were presented in Figure 4 . In the quantitative retardation images, the small black “holes” inside the AC are the locations where the cells and cell clusters used to reside (the particular histology procedure did not preserve the cellular details). In these angle images, blue and red indicated a 90° difference between the fibril orientations; the same 90° difference also existed between black and white, which had a 45° shift in the orientation to the blue and red combination.
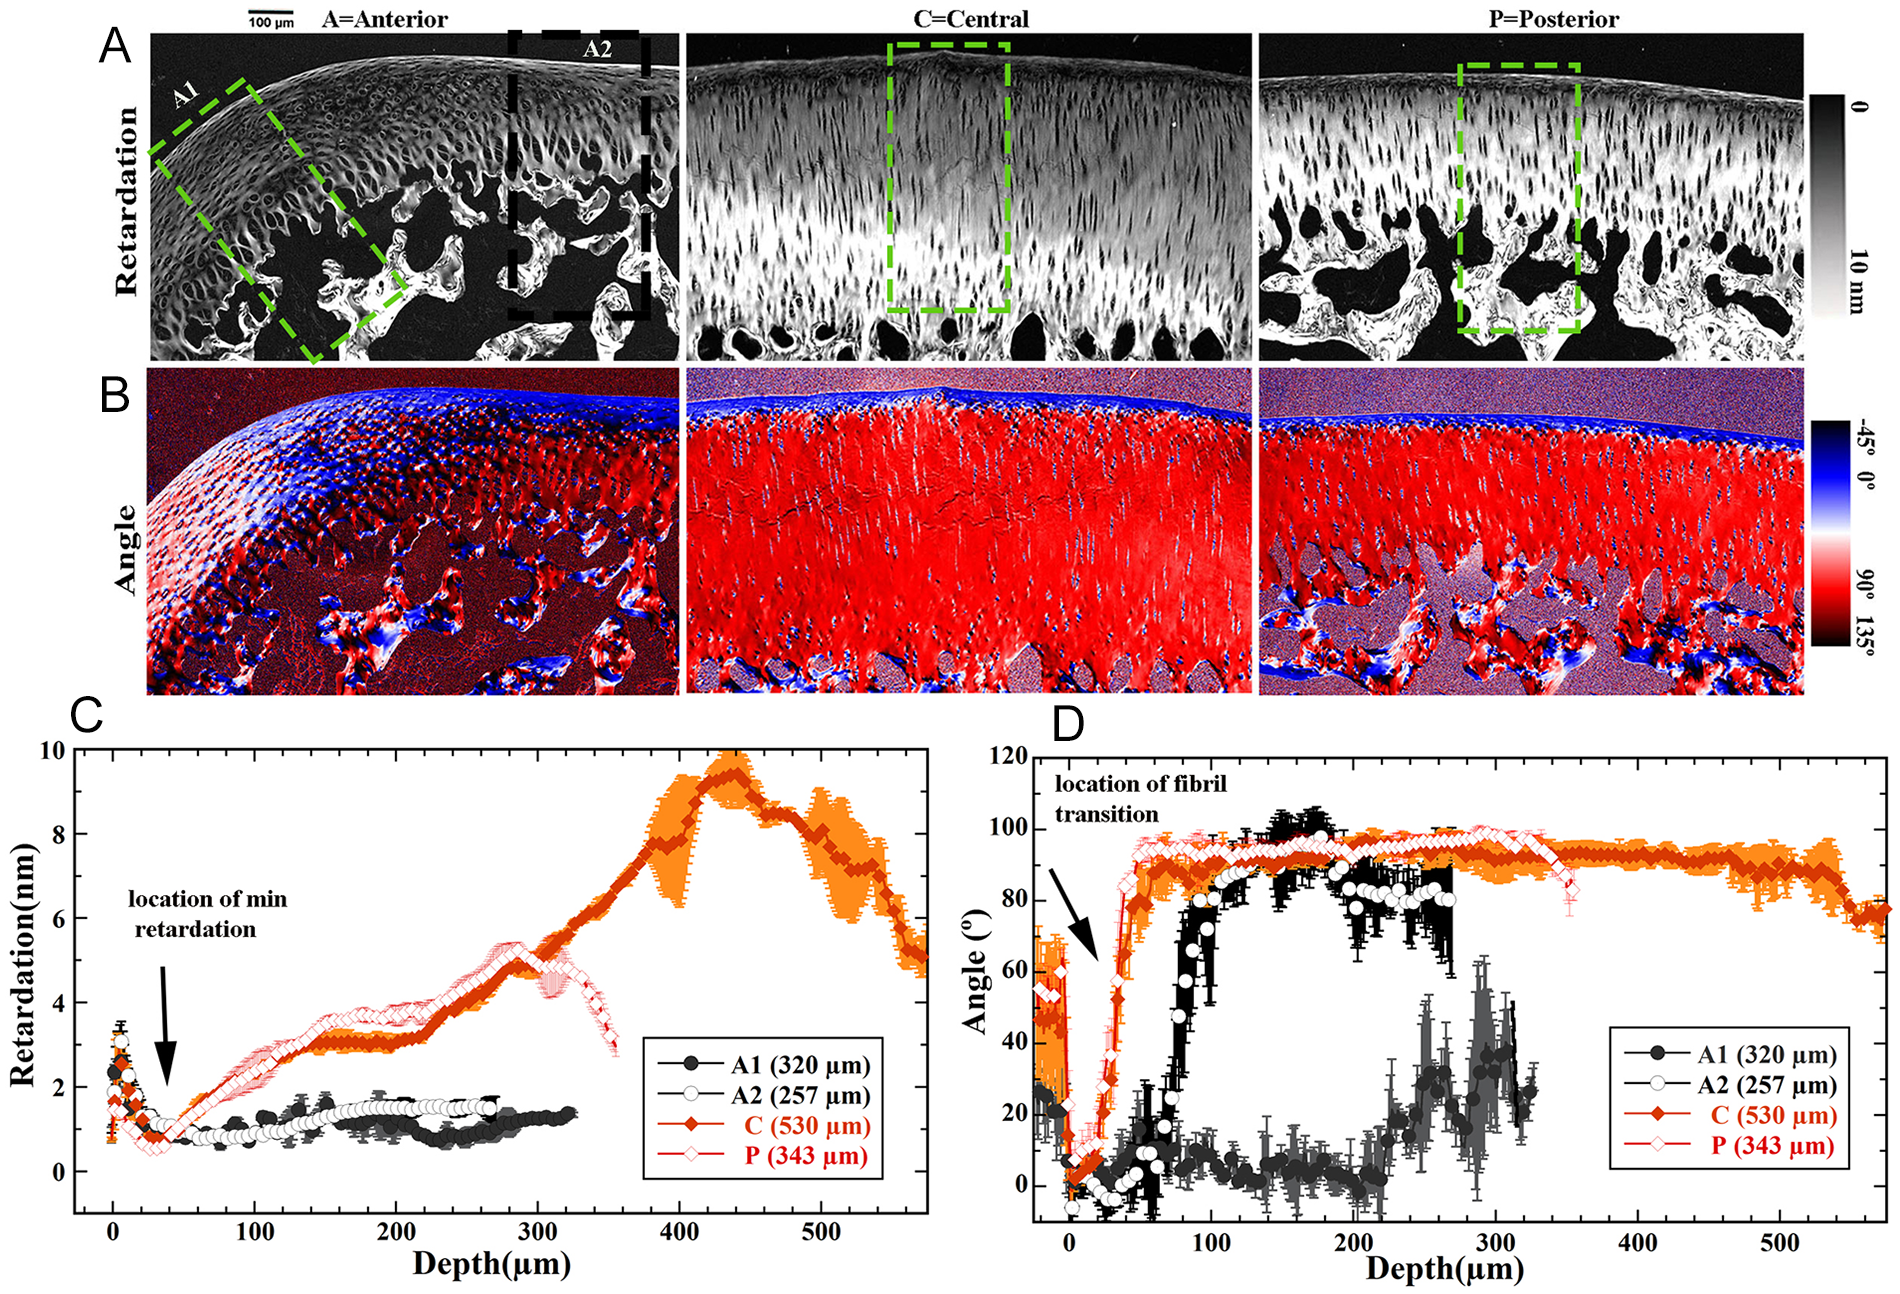
Three-dimensional quantitative PLM images of retardation (
Several features can be identified among the specimens obtained from 3 different anatomical locations of the joint. First, the PLM images and profiles for cartilage from the central location showed that the tissue had the arched 3-zone fibril architecture, where the surface fibers and the radial fibers had a 90° difference in their angular orientations (represented by blue and red, respectively, in the image). This observation agrees with the quantitative µMRI data discussed previously in Figure 4 , and this agreement between the µMRI and PLM data is also consistent with the observations from many mature cartilage tissues from larger animals such as canines. 13 With this understanding, one can easily see that the collagen fibers in the posterior cartilage also have the arched 3-zone architecture, except that the tissue is thinner.
Second, as we have observed in the µMRI T2 anisotropy data (
Third, among the 3 locations, the central cartilage was the thickest (550 µm), that is, about 50% thicker than the cartilage at both the anterior and posterior locations (250-300 µm). Although different in their total thickness, both central and posterior cartilage had approximately the same thickness in their SZs (10-15 µm) and an identical tissue retardance minimum (~30-35 μm below the articular surface, marked by the arrow in
Comparison Between µMRI and PLM
Figure 6
compares the T2 (0°) profiles from µMRI and the retardation profiles from PLM for the 4 topographical locations on the femoral condyle. In these quantitative profiles, the location of the minimum retardation indicates the location of the least ordered collagen fibrils in the tissue. By comparison, the location of the maximum T2 relaxation at 0° indicates the location of the least ordered water molecules in the tissue. Among the 4 locations, only the central cartilage (
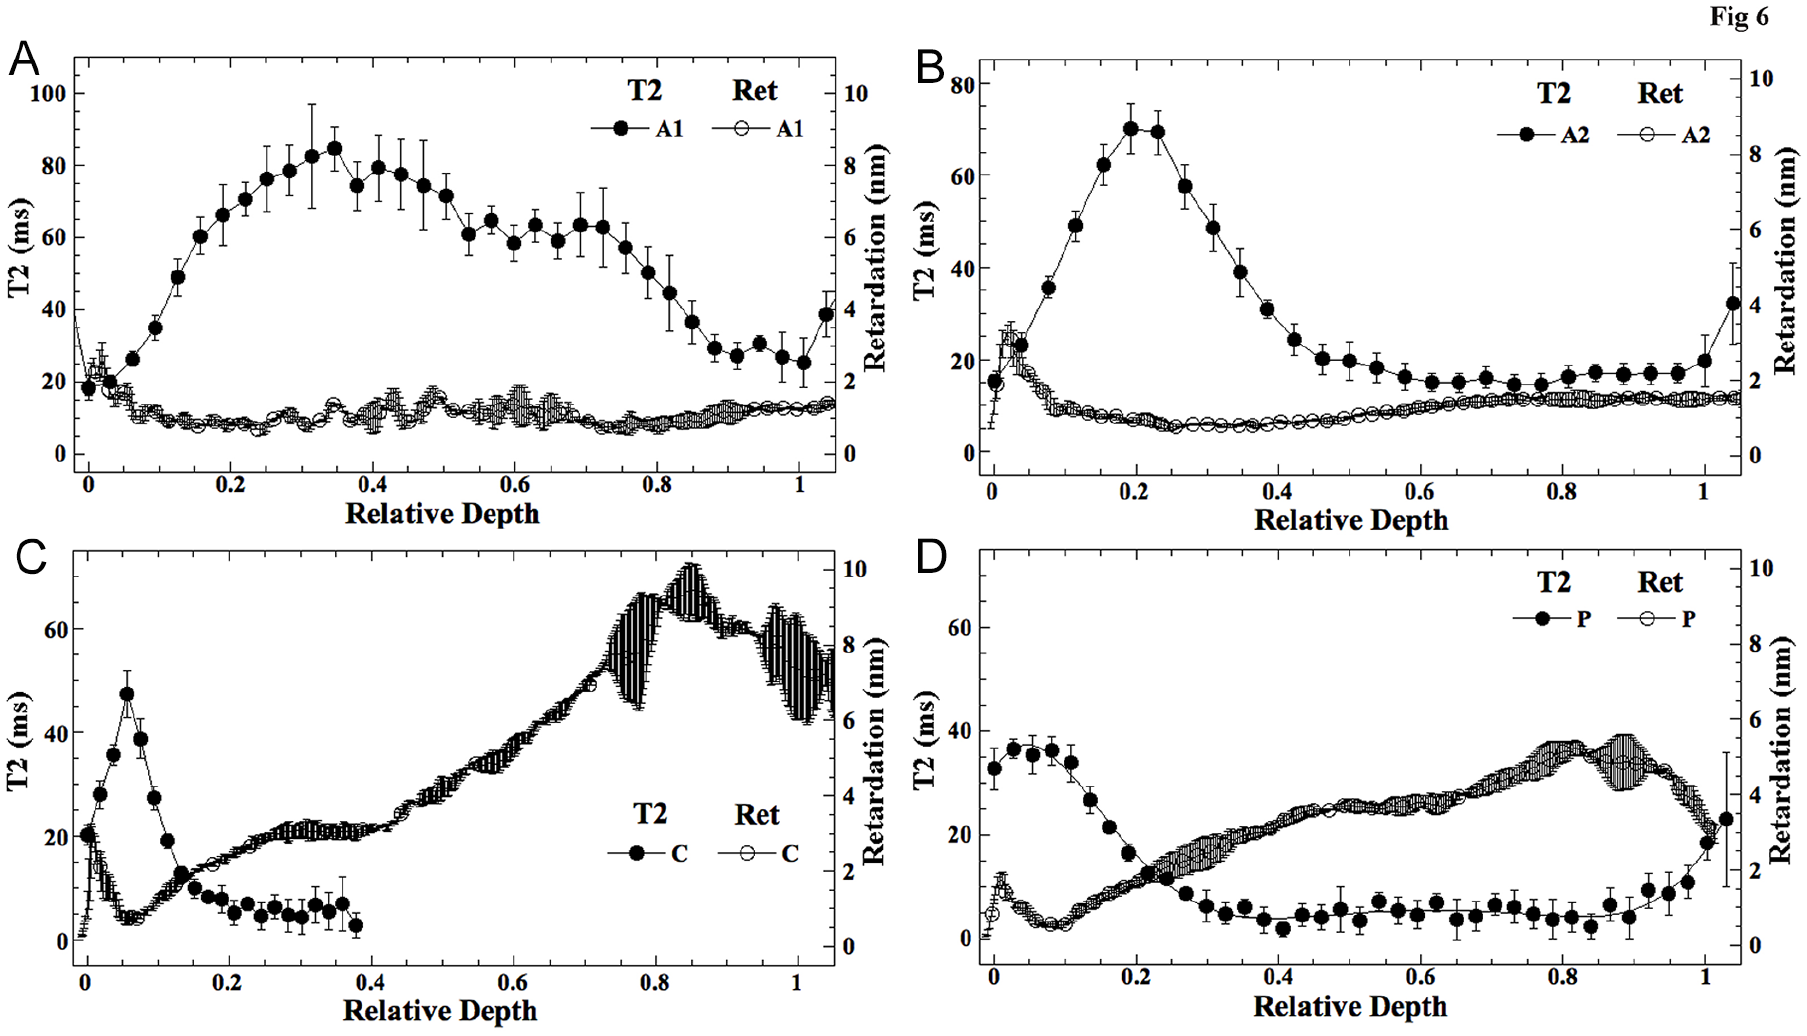
Comparison between the quantitative T2 profiles at 0° and the quantitative retardation profiles, at 4 different locations in femoral cartilage. 0 in the relative depth marks the articular surface, and 1 in the relative depth marks the cartilage–bone interface.
Territorial Matrix (40x Imaging)
Figure 7
shows the high-resolution quantitative angle and retardation images (40x objective, 0.25 µm/pixel) of the cellular clusters at different depths from the same specimens used before in the 10x imaging (
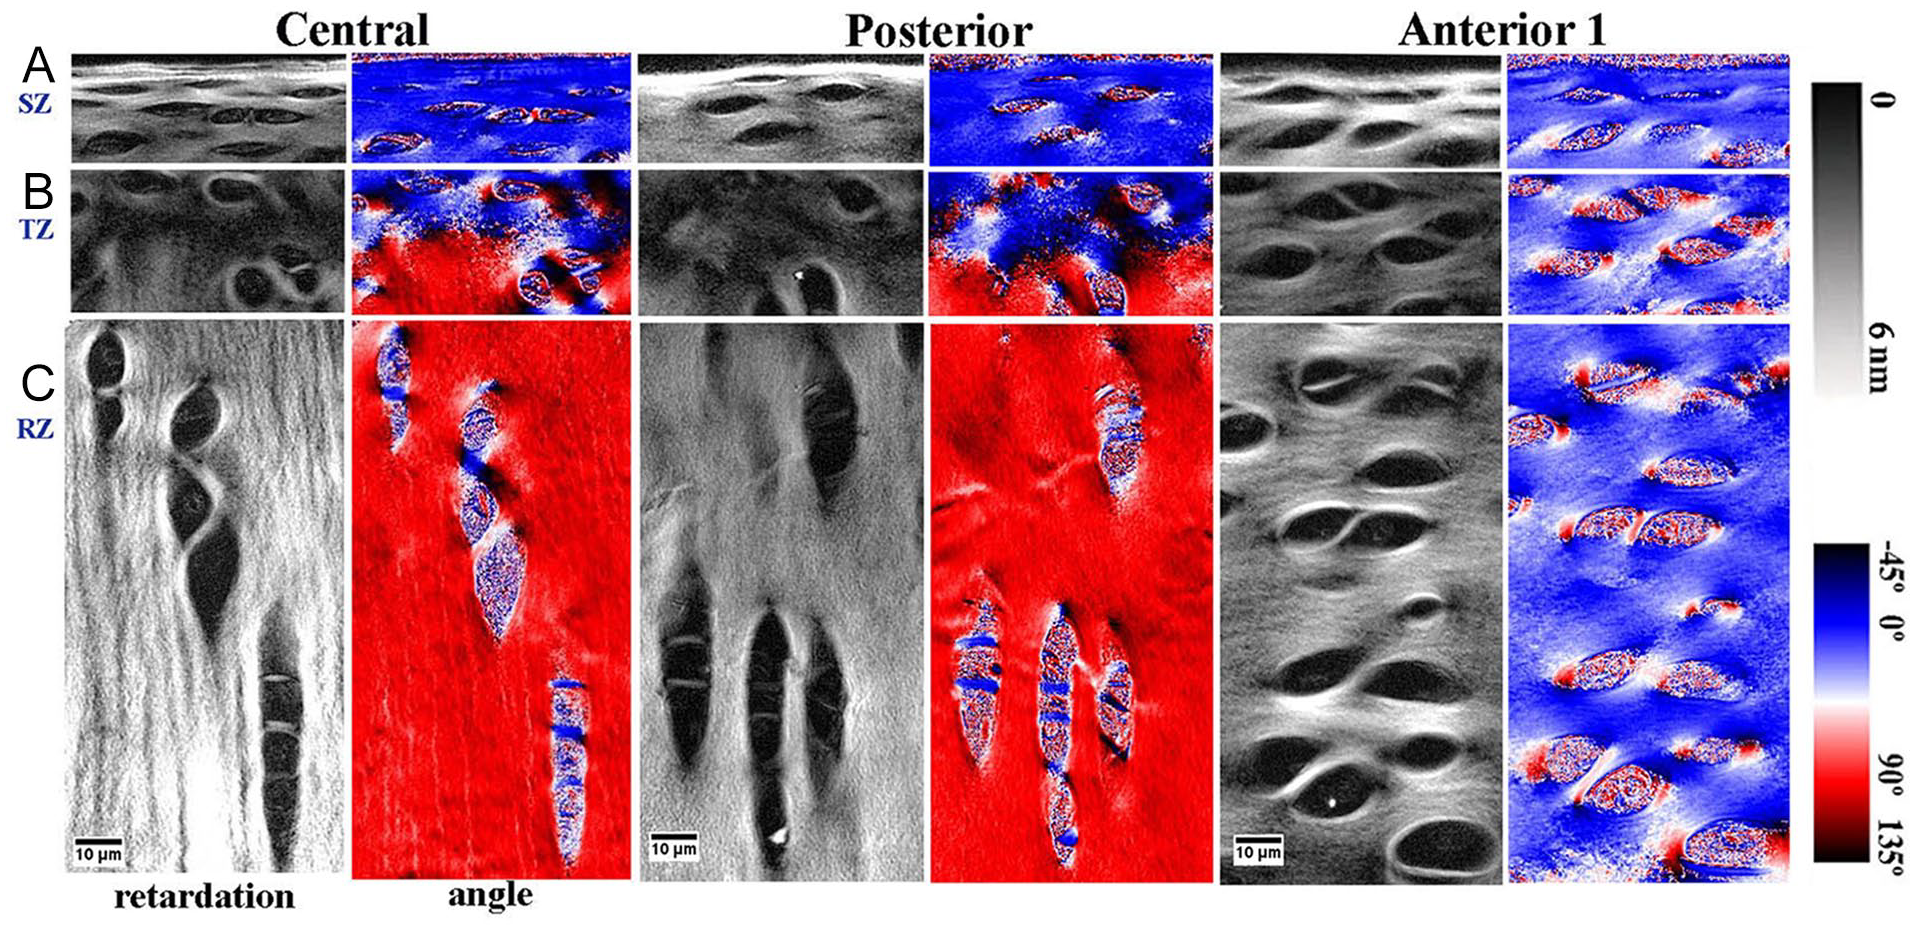
Quantitative PLM images of the 3 locations of tissue at 0.25 µm pixel resolution at different histological zones. (
Quantitatively, higher retardation values can be found in the proximity of cells and cellular clusters, which indicates the presence of a cocoon-shaped fibril structure surrounding each cell or each group of cells. The same cocoon-shaped fibril structure was also seen from the quantitative angle images when they were enlarged further, in which the angle values change in a cyclic manner, that is, the same color appears on the opposite side of the same cell or cellular cluster. As a collagen fiber has neither head nor tail, the same angle value appears on the opposite of any circular shape, which should have two 90° orientational differences, between blue and red, and between white and black. For the central and posterior cartilage, the background colors in the angle images, that is, the orientations of the territorial matrix in the tissue, had the expected 90° transition between the surface and deep cartilage, indicating an arched 3-zone structure. In contrast, the anterior cartilage (A1) had the same bluish color for all regions of the tissue, indicating an absence of a 3-zone structure.
Discussion
To the best of our knowledge, this is the first quantitative study of the topographical features of the femoral cartilage in a rabbit model by µMRI and PLM at microscopic resolutions. Compared with the use of larger animals, rabbits are small, inexpensive, and have more societal acceptance. As rabbit cartilage is thin, any depth-dependent examination requires high resolution in imaging. In recent years, the use of rabbit models in biomedical research has been gradually increasing.9,17,20-23 Still, many features of the rabbit tissues, even in healthy control animals, have not been well characterized, which complicates the understanding of degenerative characteristics in tissue.
Topographical Structural Variations in Juvenile Joints
A better understanding of the developmental changes from juvenile tissue to mature tissue is critically important as younger populations can develop osteoarthritis several years after traumatic injuries. Studies of the juvenile canine humeral head and ovine distal metacarpus24,25 have revealed a number of site-specific collagen structures, ranging from the arched 3-zone structure to complex multi-zone architecture, which can be seen on the same joint surface. Such site-specific collagen structures have also been found to be absent in mature canines. 19 These experimental observations support the notions that there are specific imaging features that are unique in juvenile joints, and that not all locations on the same juvenile joint develop into the 3-zone structure simultaneously. Probable explanation for these developmental differences at different locations on the same joint surface could be either variable growth rates, a pattern of the bone epiphysis, or exposure to different mechanical loading conditions at different anatomical sites of the same joint.8,25-31
This study showed that, for 3-month-old juvenile rabbits, the cartilage at the central and posterior locations along the femoral medial condyles had already developed into the classic 3-zone architecture, which is commonly seen in mature joints. In contrast, the cartilage at the anterior location, the TR of the patellofemoral region of the same joint, had no zonal architecture. This topographical difference could have 2 causes, namely, developmental and mechanical. The developmental cause is associated with the maturity of the cartilage, where distinct differences between the juvenile and mature cartilage in large animals have been noticed.19,24 The mechanical cause is associated with the differences in the force patterns between the anterior location and the central and posterior locations. While the central and posterior cartilages are subject to large compressive loading, the anterior cartilage is subject to constant tangential motion with the patellar cartilage. Hence, the collagen fibers may adapt to the local mechanical environment.
As MRI T2 anisotropy is extremely sensitive to the dynamic environment of water molecules in biological tissue, it is expected that the fibril architecture and structural variations of the collagen network can be detected noninvasively and nondestructively by MRI if sufficient resolution can be achieved (as in µMRI). At the same time, this study also employed quantitative PLM protocols at higher optical resolution, which are uniquely sensitive to the mutual organization and overall orientation of the collagen matrix based on different physical principles. It has been shown previously that the retardance minimum below the articular surface is closely associated with the geometric center of the TZ, which is represented by a maximum in quantitative T2 anisotropy of adult animals. The correlation between the 2 quantitative protocols can define the zonal architectures of the collagen network, from the classic 3-zone architecture to more complicated variations in juvenile tissues.
Intervention at an Early Stage
Understanding the differences between the juvenile and mature cartilage associated with the developmental stages and mechanical environments in individual animals (and humans) can contribute to better intervention of the cartilage degradation process at an early stage. The collagen network in cartilage is responsible for the structural stability of the tissue, which remodels continuously during growth and adolescence periods. After the skeletal maturation, the cartilage maintains a stable structure for the rest of the life span with only minor adaptations. 27 Studying the site and age-dependent mechanisms in the structural remodeling provides an opportunity to intervene/repair cartilage optimally at different ages when damage and degradation occur, which could prevent or postpone advanced stages of osteoarthritis. For example, sports-related injuries, common in young adults, can develop into osteoarthritis within a short time after the injury. Failure in cartilage repair could happen if the repair tissue does not fit the specific age and topographical dependent features of the damage location.
The development of arcade-like structures with age is an important and interesting phenomenon, the understanding of which would be beneficial to the design of superior materials and procedures as it would be more stable and better able to effectively handle the loading environment. Therapeutic improvements could potentially be implemented by identifying and investigating the localized physiological and mechanical factors involved at different sites on the same joint. For example, osteochondral allograft transplantations have been used to treat focal lesions in young and active patients. Considering the topographical variation in the fibril architecture can be helpful in dealing with site morbidity and also improve integration if the repair grafts can be designed to better match with neighboring/donor cartilage structurally. 32
Experimental Notes
Structural changes in collagen fibril orientation are closely linked to compositional changes (PG and collagen content) in connective tissue. Due to technical limitations, we did not perform any histochemical analysis to determine any compositional difference of cartilage at different sites. In addition, as the development of the collagen network is a gradual process, we recognize the potential needs for more time points (i.e., different aged animals) to fully understand the developmental variations in the tissue architectures. The number of the µMRI sampling locations was 3, which were 4-6 mm apart from each other along the same small joint. It should also be noted that any topographical variations are highly dependent on the plane/location of histological cutting and the type of joint. Finally, any sample with curved surfaces (e.g., the anterior specimen in
Note that, in physics, anisotropy is a descriptive term, which refers to the characteristic of a measurement that exhibits different values when measured along different directions. In MRI, the direction in the sample space is defined by the external magnetic field B0. A number of methods can be used to analyze the characteristic of T2 anisotropy. The first and original method analyzes directly the depth-dependent T2 profiles (as
Conclusion
µMRI and PLM imaging protocols were used to study the topographical variations among different locations on the medial femoral condyle of juvenile rabbits. Distinctly different characteristics of tissue properties were found in AC at different locations on femoral condyle in rabbits, likely related to the structural variations of different matrices in cartilage. As collagen organization plays a significant role in deciding the mechanical properties of tissue, our high-resolution imaging findings in the location-specific differences in knee joint’s collagen organization can help to better understand localized mechanobiology of tissue. We believe our results could stimulate improvements in diverse fields, including developmental biology, tissue engineering, localized tissue degradation, design of more successful repair and replacement strategies, and diagnostic imaging.
Footnotes
Acknowledgments and Funding
Yang Xia is grateful to the National Institutes of Health (NIH) for an R01 grant (AR 69047). The authors thank Dr. Adam Lauver and Ms. Barbara Christian (Department of Pharmacology & Toxicology, Michigan State University) for providing the rabbit samples and Ms. Carol Searight (Department of Physics, Oakland University) for linguistic editing.
Declaration of Conflicting Interests
The author(s) declared no potential conflicts of interest with respect to the research, authorship, and/or publication of this article.
Ethical Approval
Ethical approval for the tissue study was waived by the Institutional Animal Care and Use Committee (IACUC) at Oakland University, because the specimens were the discarded tissue for an unrelated and approved experimental study.