
Abstract
Objective
The aim of this study was to elucidate the efficacy of T2-mapping MRI and correlation with histology for the evaluation of tissue repair quality following the first-in-human implantation of an autologous tissue engineered construct.
Design
We directly compared the results of T2-mapping MRI of cartilage repair tissue with the histology of a biopsy specimen from the corresponding area at 48 weeks postoperatively in 5 patients who underwent the implantation of a scaffold-free tissue-engineered construct generated from autologous synovial mesenchymal stem cells to repair an isolated cartilage lesion. T2 values and histological scores were compared at each of 2 layers of equally divided halves of the repair tissue (upper and lower zones).
Results
Histology showed that the repair tissue in the upper zone was dominated by fibrous tissue and the ratio of hyaline-like matrix increased with the depth of the repair tissue. There were significant differences between upper and lower zones in histological scores. Conversely, there were no detectable statistically significant differences in T2 value detected among zones of the repair tissue, but zonal differences were detected in corresponding healthy cartilage. Accordingly, there were no correlations detected between histological scores and T2 values for each repair cartilage zone.
Conclusion
Discrepancies in the findings between T2 mapping and histology suggest that T2 mapping was limited in ability to detect details in the architecture and composition of the repair cartilage.
Keywords
Introduction
Articular cartilage is a unique structure and multifunctional tissue, bearing compressive loading and shear stress throughout joint movement. The composition and distribution of the cartilage matrix influences tissue biochemical and biomechanical functions. 1 Specifically, type II collagen fibrils are organized into a structural framework that is important for cartilage biomechanics. 2 At the articular surface, collagen fibers are oriented parallel to the surface, thereby assisting in the resistance of shear forces at the surface. By comparison, the deep zone is subjected to a more compressive strain, with the fibers aligned perpendicular to the surface.
Articular cartilage does not usually heal spontaneously.3,4 Recently, tissue engineering approaches have gained increasing attention as having good potential regarding regenerative therapies. Since the first results on autologous chondrocyte implantation (ACI), 5 articular chondrocyte-based therapies have been extensively studied.6-11 Cell sources such as stem cells from various sources have also been utilized as alternative choices for cartilage repair.12-14 With advancements with cell-based technologies, it has become increasingly important to precisely assess the quality of the repair cartilage as one of the major clinical outcomes.
Histological analysis by tissue biopsy has been widely utilized for assessing the quality of the repair cartilage, although it is invasive, but especially in the assessment of newly developed treatments.5,15,16 More recently, magnetic resonance imaging (MRI) has also been advanced as a noninvasive modality to evaluate articular cartilage. 17 With its excellent soft-tissue contrast, this approach could allow for precise morphologic evaluation of articular cartilage, as well as cartilage repair tissue.17,18 Recently, quantitative MRI assessments such as T1rho mapping, T2 mapping, and delayed gadolinium-enhanced MRI of cartilage (dGEMRIC) have been studied to investigate the biochemical composition and structure of articular cartilage.19-21 Several studies have reported the efficacy of this approach to detect early degenerative changes in articular cartilage.20,21 However, there is limited evidence regarding the efficacy of such quantitative MRIs for assessment of cartilage repair tissue after surgical interventions. White et al. 22 reported that T2 mapping helped differentiate hyaline cartilage from reparative fibrocartilage after cartilage repair in an equine study. Welsh et al. 23 compared cartilage T2 values after microfracture and matrix-associated autologous chondrocyte transplantation repair procedures and showed that quantitative T2 mapping appeared to reflect differences in repair tissues formed after the 2 surgical cartilage repair procedures. On the other hand, Salzmann et al. 24 assessed repair tissue as a long-term clinical outcome after ACI, and reported there is only a weak correlation between quantitative imaging data (T2 values) and clinical function, while qualitative imaging data (magnetic resonance observation of cartilage repair tissue (MOCART) score) was much better correlated to functional outcomes. Therefore, the efficacy of quantitative MRIs such as T2 mapping for the quality of repair cartilage tissues remains controversial. In addition, there have been few clinical studies for direct comparisons of repair tissue between a quantitative MRI and histology from the corresponding area, and thus it remains unclear whether the repair tissue assessed by quantitative MRI can precisely detect the composition and structure of repair tissue.
Recently, we have developed a novel scaffold-free 3-dimensional (3D) tissue-engineered construct (TEC) that is composed of mesenchymal stem cells (MSCs) derived from synovium and extracellular matrices (ECMs) synthesized by the cells.25-29 Using such an approach, the results of a first-in-human clinical study testing the safety and efficacy of the TEC in cartilage repair with 5 patients was reported. 30 In this study, we obtained data from T2 mapping and histology of biopsy specimens for all 5 cases. Interestingly, we did not detect strong correlation between the patterns of T2 mapping and histology when the total repair tissue was assessed.
In the present study, we now evaluated the zonal structure (upper and lower halves) of the resultant repair cartilage by T2-mapping MRI and histology of biopsy specimens from the corresponding area in the same cohort as in our recent clinical study. 30 By comparison of T2-mapping and histological data, we aimed to elucidate further details regarding the efficacy and limitations of current T2-mapping techniques to evaluate tissue repair quality following implantation of a TEC.
Methods
Patient Cohort
The patients provided written informed consent to participate in this clinical study, which was approved by the Ministry of Health, Labour and Welfare of Japan (UMIN ID, UMIN000008266; Approval No., HM1201). We enrolled 5 patients aged 20 to 60 years with isolated full-thickness cartilage defects of the knee (<5 cm2, International Cartilage Regeneration & Joint Preservation Society [ICRS] grade III or IV) ( Fig. 1A ), as addressed in our earlier report. 30 All the procedures, including surgical procedures, MRI, and tissue biopsy, were in accordance with the protocol approved by the institutional ethical committee and the institutional review board.
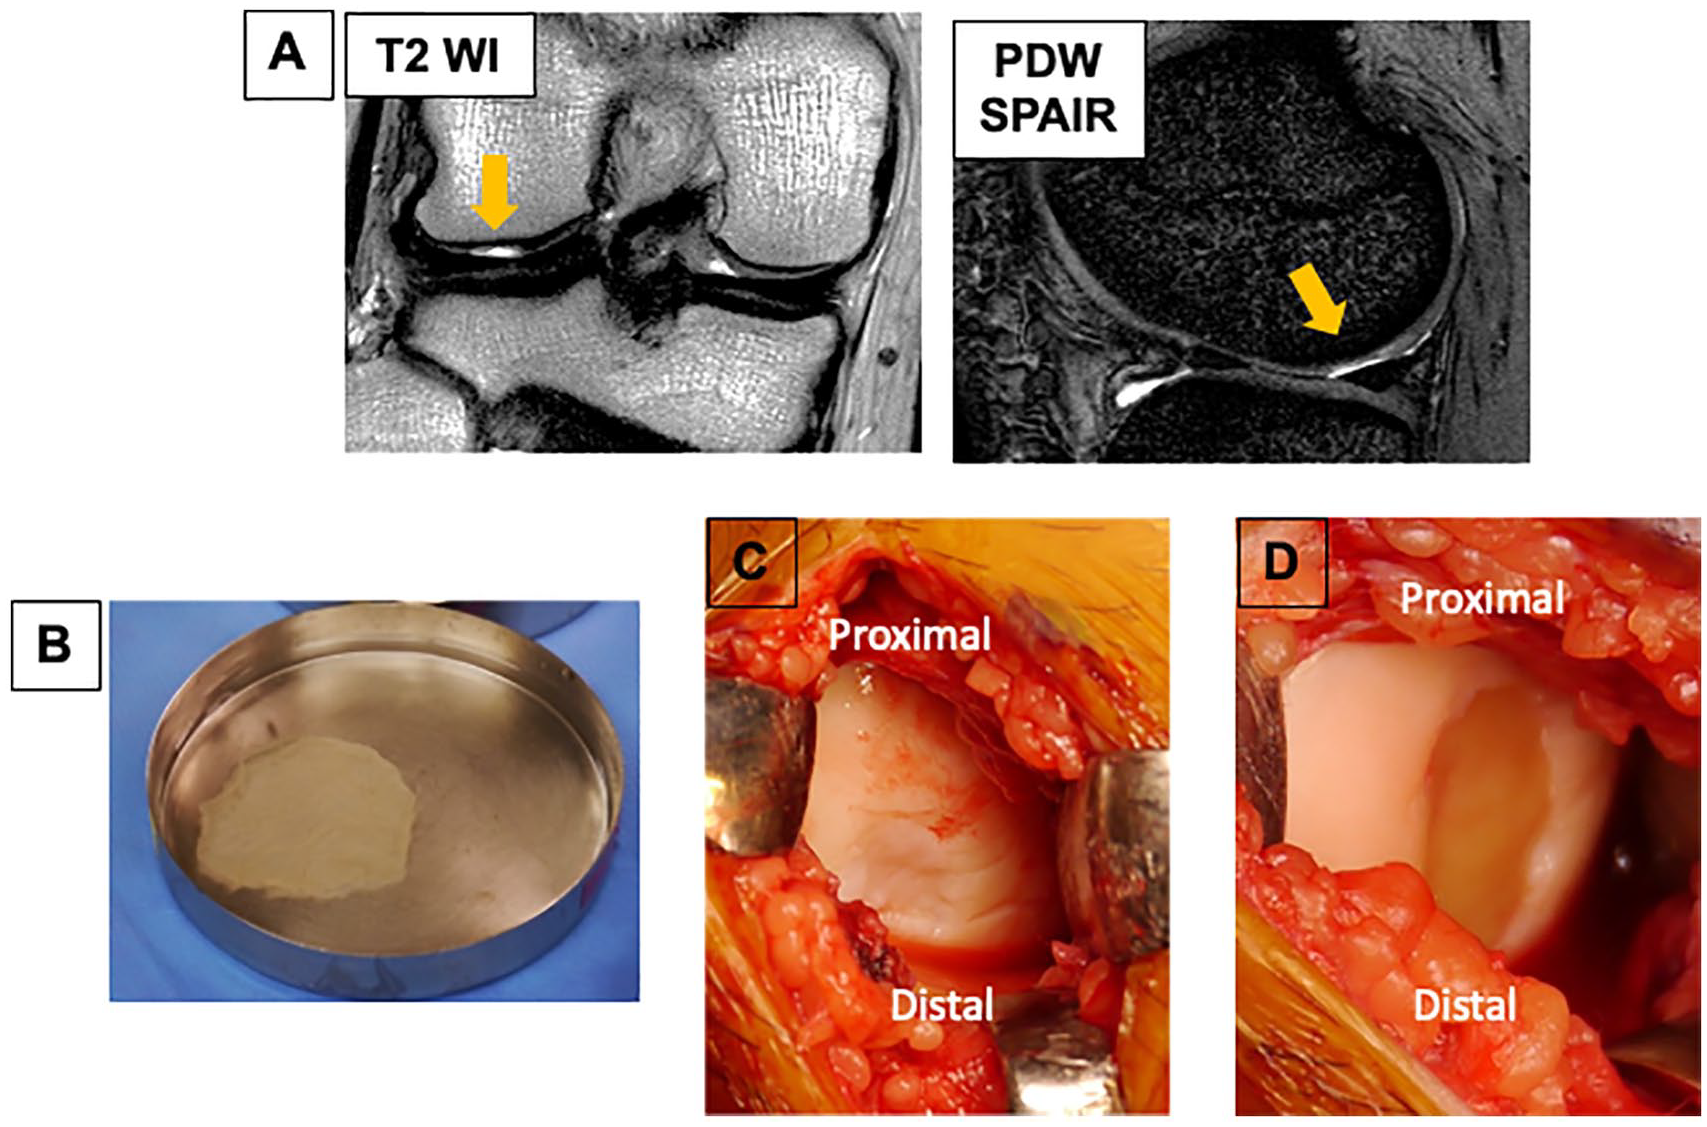
Cartilage defect and implantation of a tissue-engineered construct (TEC) generated from synovial mesenchymal stem cells. (
Cell Isolation and Development of TEC
For isolation of autologous synovial MSCs, synovium (>1 g) was aseptically taken from an anterior part of the knee joint arthroscopically and under general anesthesia. Care was taken to remove only synovium and exclude fat from the samples. All procedures for cell culture were performed at the good manufacturing practice grade-based cell-processing center in the Medical Center for Translational and Clinical Research of Osaka University Hospital. The cell isolation protocol was essentially that used in our previous studies.27,29,30 Briefly, the synovium was minced meticulously and digested enzymatically with animal origin-free collagenase (Worthington), and the isolated cells were cultured until passage 1 or 2 with growth medium containing high-glucose Dulbecco’s modified Eagle’s medium (Gibco BRL) supplemented with 10% fetal bovine serum with virus- and prion-free certification (Moregate Biotech). For characterization of the cultured cells, the surface markers expressed by these cells were assessed by flow cytometry (FACS Calibur; Becton, Dickinson and Company), and the resulting cells met the criteria for MSCs in all cases, as addressed in our earlier report. 30
For preparation of the TECs, synovial MSCs were cultured at a density of 4.0 × 10⁵ cells/cm2 in growth medium containing 0.2 mM ascorbate-2-phosphate.27,29 After 2 to 3 weeks in culture, the complex of cultured cells plus the ECM synthesized by the cells was gently detached from each culture dish to spontaneously form a 3D structure by active tissue contraction ( Fig. 1B ). After detachment, the resultant TECs were immediately transported to the operating room for implantation.
Surgical Procedure
For implantation of TECs, the cartilage defects were exposed by mini-arthrotomy under general anesthesia ( Fig. 1C ). The TEC to be implanted was extensively washed with saline solution to remove any residual culture media, including fetal bovine serum, and then implanted into the defect site without the use of sutures or fixation glue; it immediately adhered to the surface of the cartilage defect ( Fig. 1D ). An air tourniquet was not used during the surgical procedure, to avoid potential complications. All patients were immobilized at 20° of flexion of the knee for 2 weeks with a brace and then started on range of motion exercises. Partial weightbearing was started at 6 weeks and full weightbearing allowed at 8 weeks. Return to sports and/or high-impact activities were allowed after 10 to 12 months.
Clinical Outcomes
To monitor patient satisfaction, we assessed a visual analogue scale, Lysholm, Tegner activity scores, and KOOS (Knee Injury and Osteoarthritis Outcome Score) preoperatively, and at 48 weeks for all patients.
MRI and Image Analysis
The morphologic and compositional characteristics of the repair site for all patients were assessed as follows: MRIs were performed for all patients with a 3.0-T MR scanner (Philips) to investigate conventional images of cartilage lesions preoperatively, and then conventional scans and T2 mapping of repair cartilage at 48 weeks postoperatively. For calculation of T2 maps, we obtained T2-weighted turbo spin-echo images by multi spin-echo sequences (TR, 3000 ms; TE, 8/16/24/32/40/48/56/64/72/80 ms; field of view (FOV), 14 cm; matrix, 320 × 256 interpolated to 512 × 512; slice thickness, 3 mm; bandwidth, 576 kHz; acquisition time, 12 minutes and 54 seconds), according to a previous described method.31,32 Data were analyzed using custom-made software (Baum 2D/3D; Osaka University, Japan). Sagittal images, including the center of repair tissue, were used for the analyses. The region of interest (ROI) was defined manually as the whole repair area of the cartilage lesions, based on the location of the cartilage defect from the preoperative MRI. In addition, the ROI of surrounding healthy cartilage was used as a normal control site, an area in which no cartilage damage was arthroscopically confirmed at the time of TEC implantation surgery (Supplemental Figure 1). The ROI was automatically divided into 2 zones that were designated the upper and lower zones. The mean T2 values were measured for each subdivided ROI ( Fig. 2A ). According to our previous study, the intra- and interobserver reproducibility coefficients for cartilage T2 values ranged from 0.73% to 2.92% and from 0.69% to 7.19%, respectively. 32
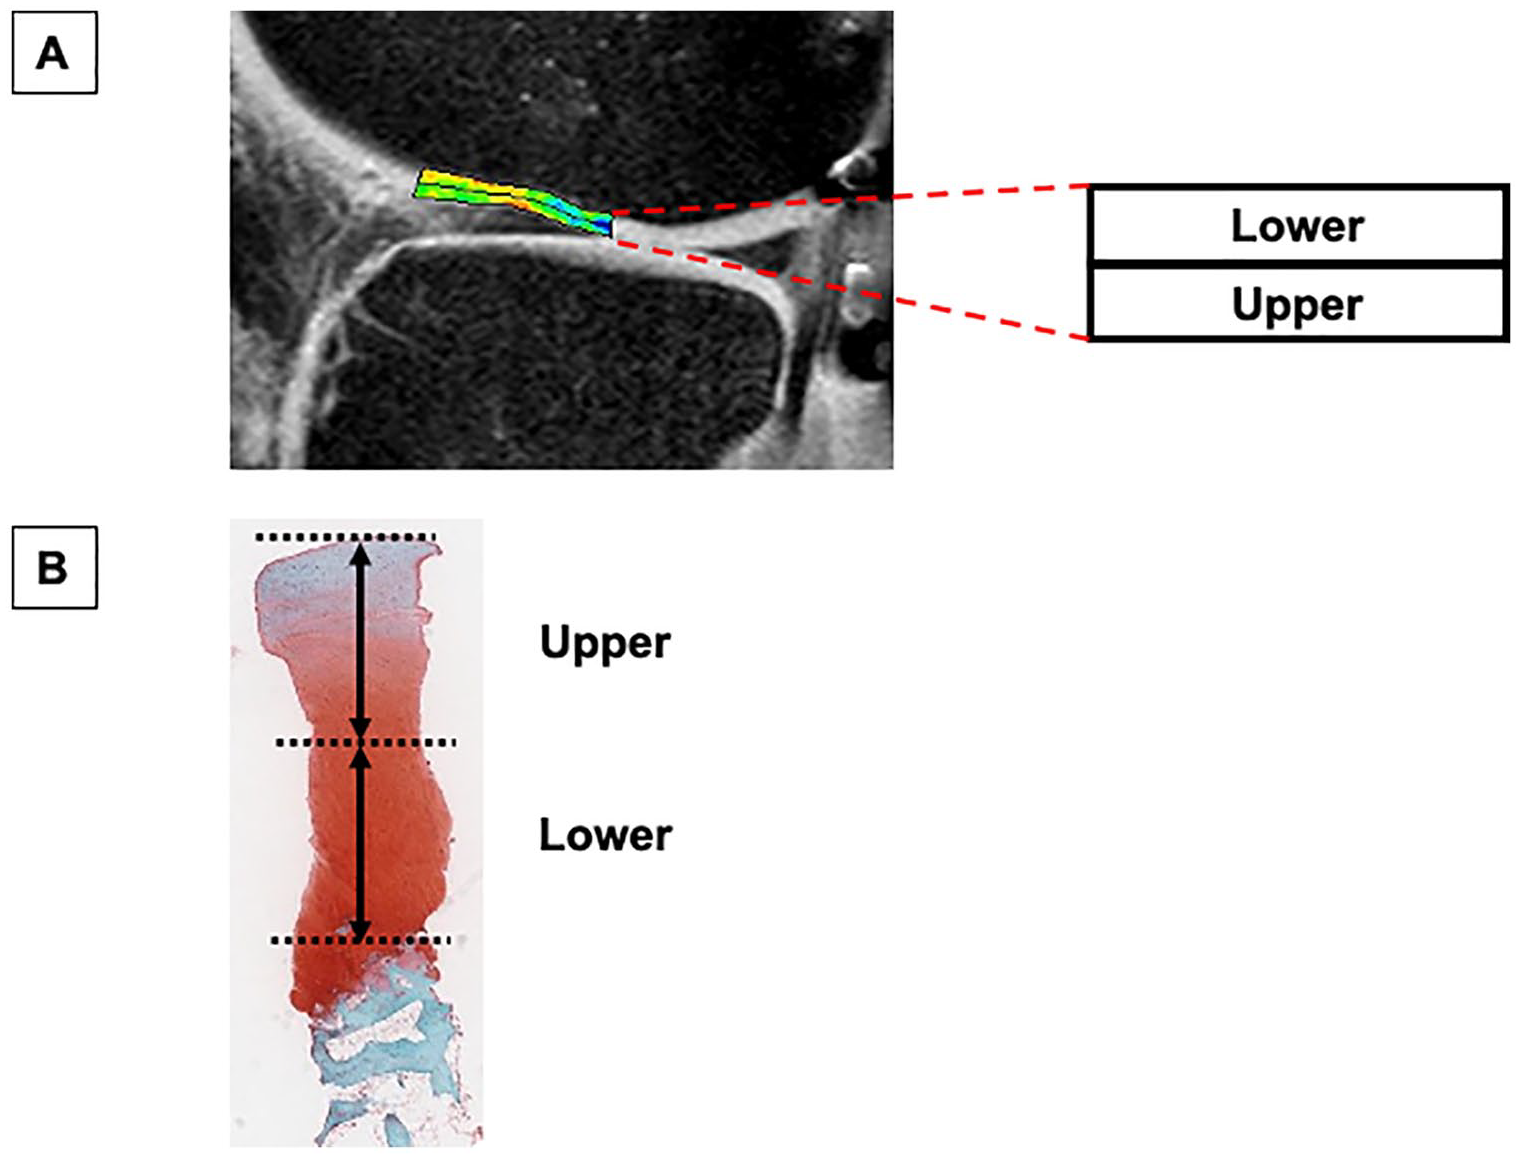
Outline of T2-mapping magnetic resonance imaging (MRI) and histological analysis. (
Histological Assessment
With patient consent, a second-look arthroscopy was performed for all the patients at 48 weeks, and a 2.5-mm-diameter needle biopsy was taken from the center of the repair site. The location of the repair tissue was identified using the findings obtained at the time of TEC implantation surgery as the reference. The border between the repair tissue and host cartilage could be distinguished in some cases, although the integration of such a border was good in all cases. This procedure was performed after the MRI examination at 48 weeks to avoid potential influence on the MRI assessment. Sections of biopsy specimens were stained with safranin O and fast green to assess detailed histologic features according to the ICRS II histologic scoring system. 33 The repair tissue from surface to osteochondral junction were divided equally into 2 zones, and such zones were defined as the upper and lower zone, from the surface ( Fig. 2B ). The categories of “tissue morphology,” “matrix staining,” “cell morphology,” “chondrocyte clustering,” and “overall” (mean score of the former 4 categories), associated with the repair tissue quality, were selected, then the histological scores with these categories for each upper and lower zone were determined. In addition, the histology was assessed by picrosirius red staining (Polysciences, Inc.) and immunohistochemistry for type I collagen (ab6308; Abcam) and type II collagen (F-57; Kyowa Pharma Chemical). Each stained specimen was viewed with Aperio (Leica Biosystems).
Statistical Analysis
We assessed changes in clinical scores between preoperative and 48-week postoperative values, and zonal differences of either T2 values or histological scores in each layer at 48 weeks postoperatively by Wilcoxon signed-rank tests. The correlation between T2 values and histological scores was analyzed by calculating Spearman’s rank correlation coefficient. Data were analyzed with JMP 14 (SAS Institute) with significance set at P < 0.05.
Results
Patient Demographics
Five patients (4 men and 1 woman; age range, 28-46 years) were assessed in this study. Chondral lesions (1.5-3.0 cm2) were found on the medial femoral condyle, lateral femoral condyle, or femoral groove. As assessments of clinical outcome, the mean visual analogue scale score (5.0 ± 3.5 vs. 66.4 ± 12.1), the Lysholm score (96.0 ± 2.2 vs. 51.0 ± 21.1), the Tegner activity score (5.0 ± 1.4 vs. 2.2 ± 1.6), and all subcategories of the KOOS (Symptoms 89.2 ± 12.6 vs. 59.3 ± 19.2; Pain 93.3 ± 7.0 vs. 64.4 ± 24.0; Activities of Daily Living [ADL] 99.7 ± 0.7 vs. 73.2 ± 19.1; Sports/Recreation 88.0 ± 9.1 vs. 37.0 ± 25.1; Quality of Life [QoL] 66.3 ± 26.7 vs. 32.5 ± 24.8) were significantly improved at 48 weeks postoperatively compared with preoperative values. No serious adverse events were observed during the observational period as reported in our earlier study. 30
MRI Findings
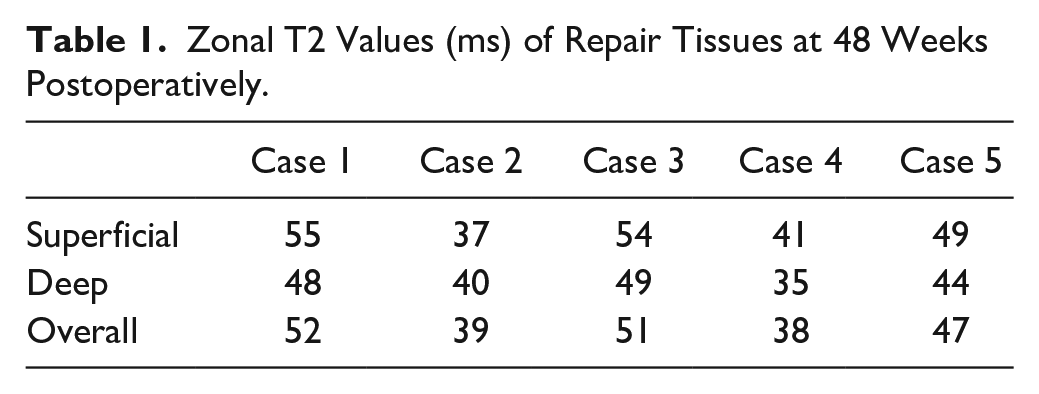
Based on MRI assessments at 48 weeks postoperatively, cartilage defects were filled with newly generated tissues without detectable hypertrophy of the repair tissues for all patients. Also, abnormal signals such as subchondral bone edema were not detected around the implanted site for all patients ( Fig. 3 ). Although somewhat variable among cases, the T2 mapping showed that implanted chondral defects were similar in intensity to the surrounding cartilage at 48 weeks postoperatively. The mean T2 values for the repair tissue were similar to those of healthy cartilage, 31 especially in the lower zone, but there were no statistical significances detected among zones, suggesting no detectable zonal-specific structure in the repair tissue ( Fig. 6A , Table 1 ). On the other hand, the mean T2 values for the surrounding healthy cartilage exhibited zonal differences (superficial 48 ± 5 ms vs. deep 41 ± 6 ms, P = 0.0313).
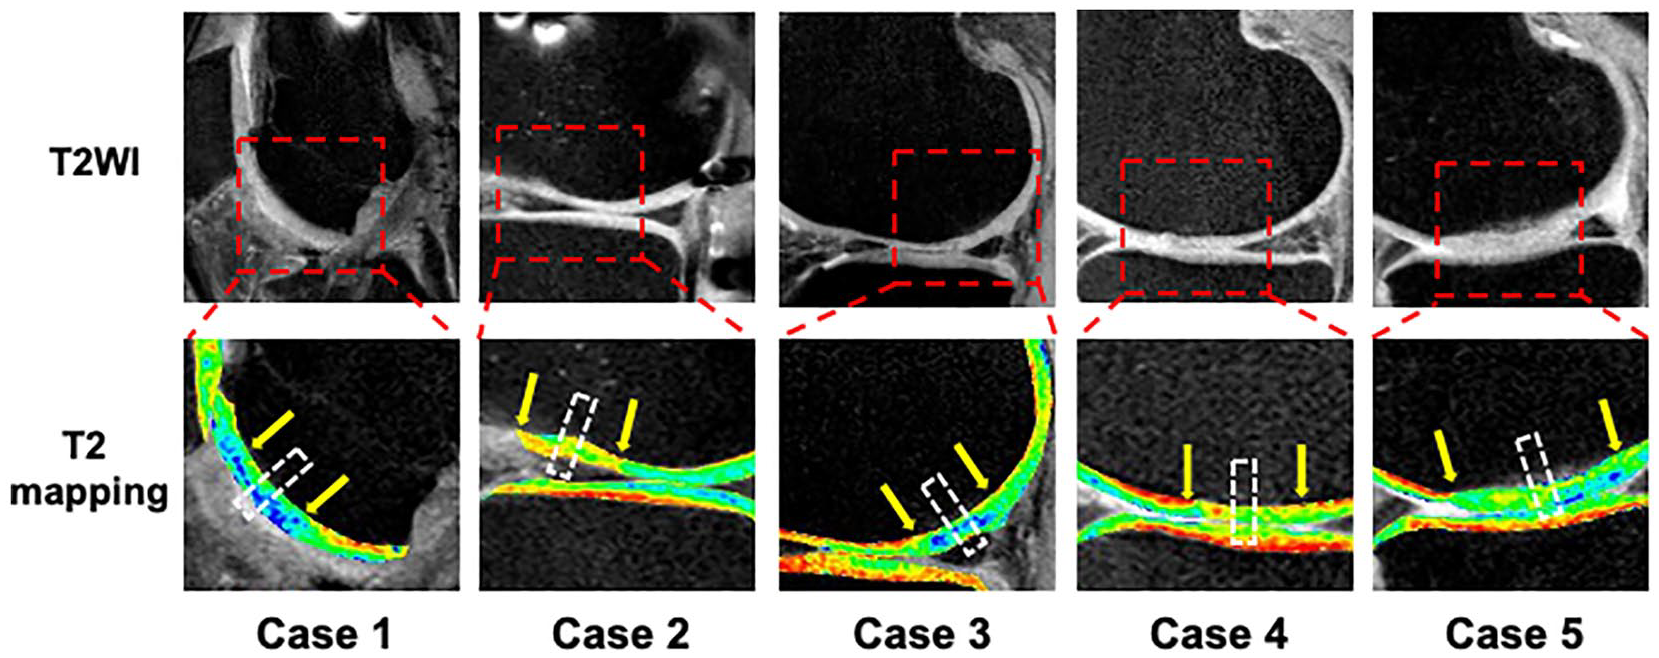
T2 mapping at 48 weeks postimplantation for all 5 patients. The chondral defects treated with a tissue-engineered construct had developed an intensity similar to the surrounding cartilage. Arrows indicate the cartilage repair site. White-dotted boxes indicate the area of histological analysis from the biopsy specimens.
Zonal T2 Values (ms) of Repair Tissues at 48 Weeks Postoperatively.
Histological Findings
Histology of the biopsy specimens at 48 weeks showed repair with cartilaginous tissue exhibiting positive safranin O staining in all cases ( Fig. 4A ). Although somewhat variable among cases, detailed observation showed that the upper zone of the repair tissue exhibited less staining for safranin O and contained predominantly spindle-shaped fibroblast like cells ( Fig. 4B ). In contrast, the majority of the lower repair matrix in all the cases showed strong positive staining for safranin O. Regarding the cellular characteristics in the lower zone, the matrix stained with Safranin O mostly contained round-shaped cells in lacuna in all cases. In addition, the cellular distribution in the areas staining strongly positive for safranin O were fairly well organized in patients 1, 2, and 5, while they were more disorganized in patient 3 and 4. Furthermore, the interface between the repair cartilage and subchondral bone exhibited a normal osteochondral junction for all patients.
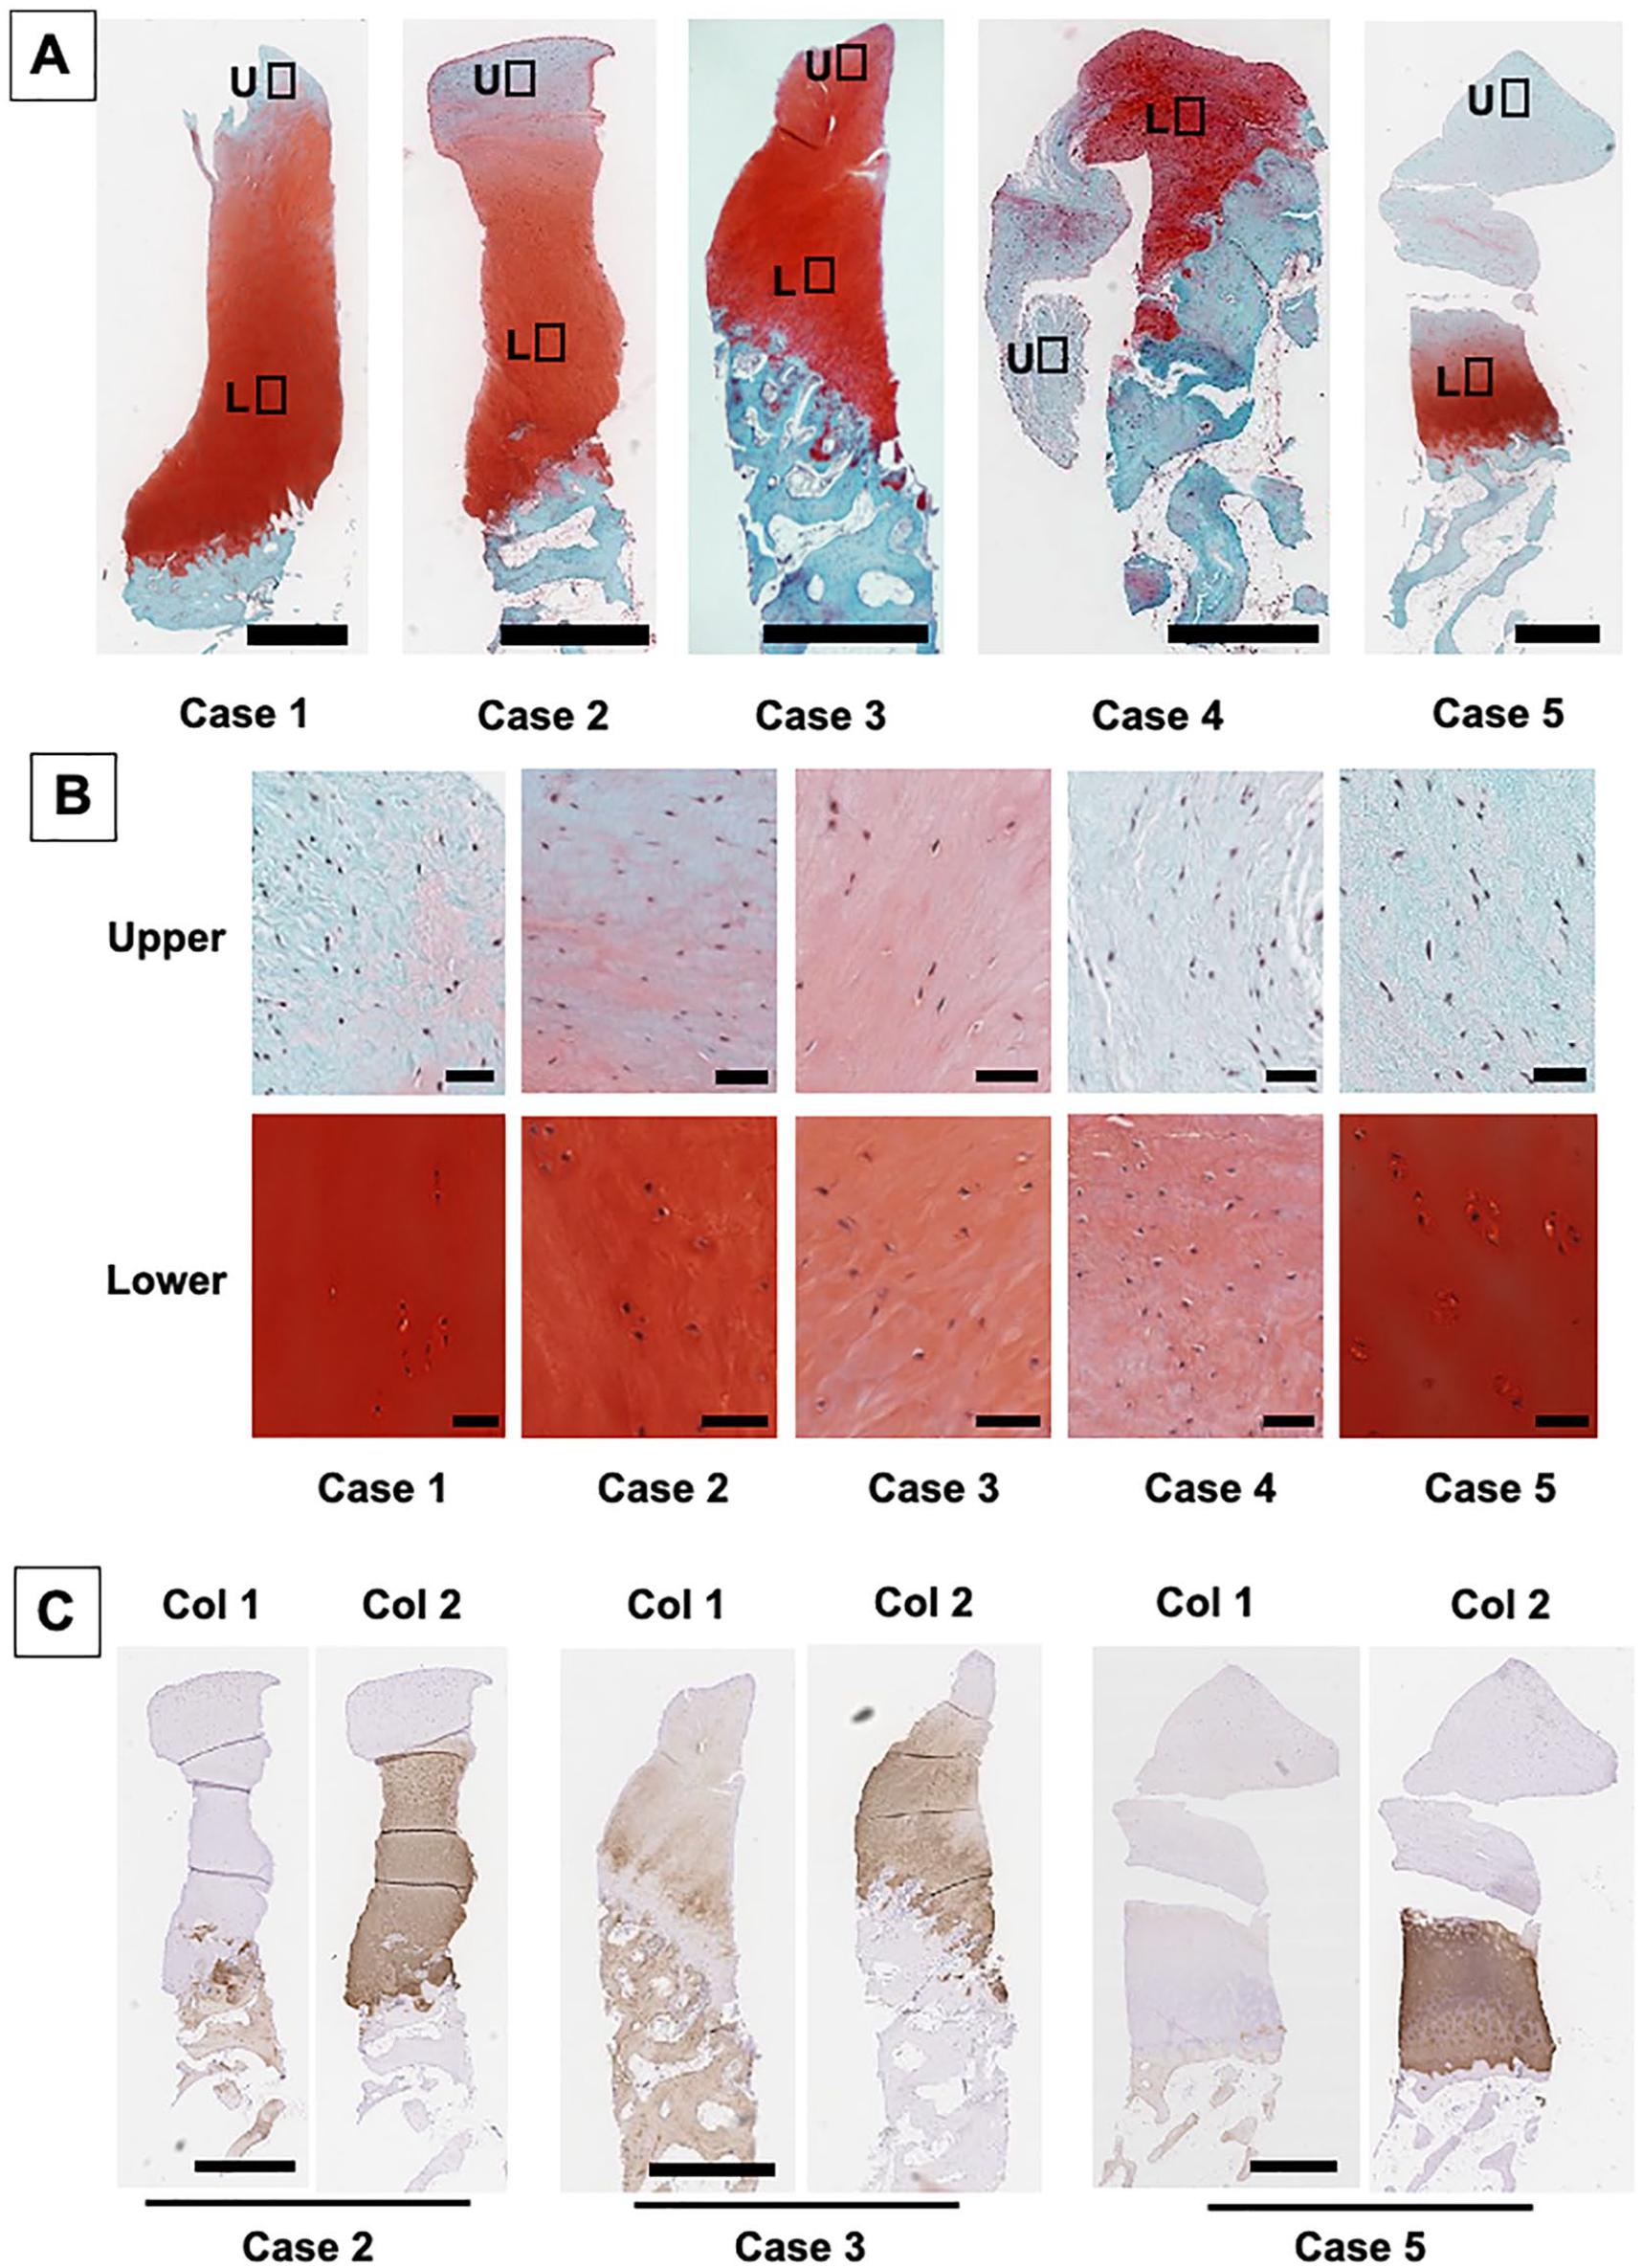
Histological analysis of the biopsy specimens obtained at 48 weeks postimplantation. (
Immunohistochemistry exhibited that the repair matrix staining with type II collagen was consistently in accordance with that staining for safranin O ( Fig. 4C ). Interestingly, such positive staining matrices with both safranin O and type II collagen exhibited the lack of staining with type I collagen in tissue from patients 2 and 5, while they were weakly stained with type I collagen in tissue from patient 3 ( Fig. 4C ). Similarly, picrosirius red staining showed fibrous collagen architecture, with a somewhat disorganized arrangement, was observed not only in the upper zone but also in the lower zone for patients 2, 3, and 4 ( Fig. 5A and B ). Thus, these findings suggested that for patients 1 and 5, the tissue repaired with hyaline cartilage, while for patients 2, 3, and 4 the tissue repaired with fibrocartilage.
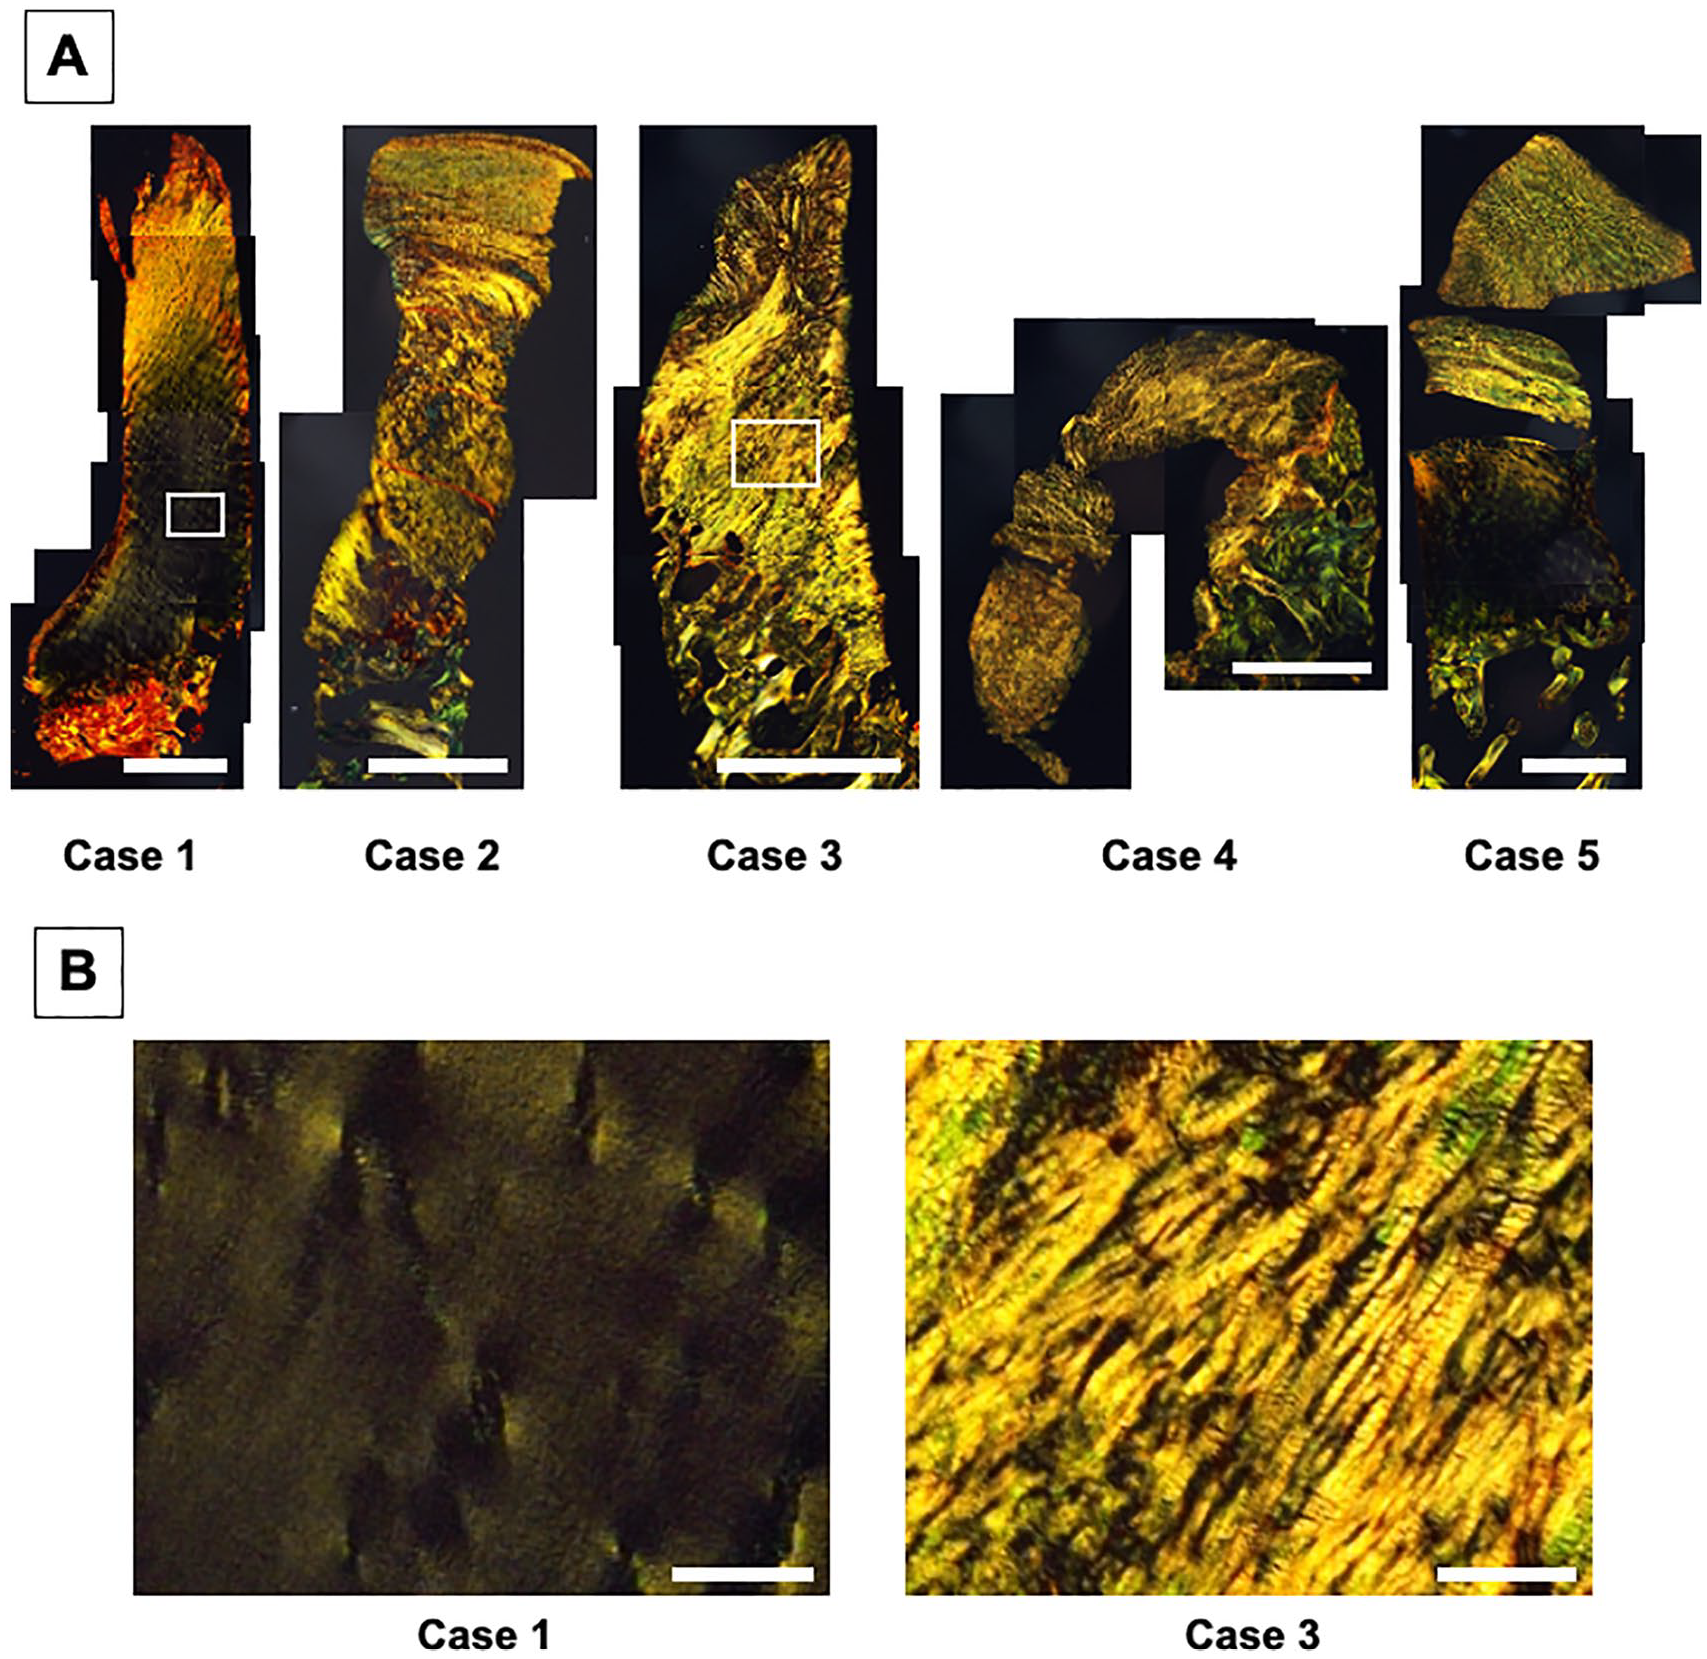
Picrosirius red staining of repair cartilage from biopsy specimens obtained at 48 weeks postimplantation. (
Taken together, the repair tissue clearly showed a zonal structure in all the cases, and the pattern of repair tissue consisted of fibrous upper zone and cartilaginous lower zones, although the cartilaginous zone was mixed with hyaline-like and/or fibrocartilage-like repair tissues for some patients. Based on these detailed histological analyses, the histological scoring showed the scores for the TEC-mediated repair tissue were significantly lower in the upper zone than in the lower zone, regarding the categories of tissue morphology, matrix staining, cell morphology and overall, but with the exception of chondrocyte clustering ( Fig. 6B-F ).
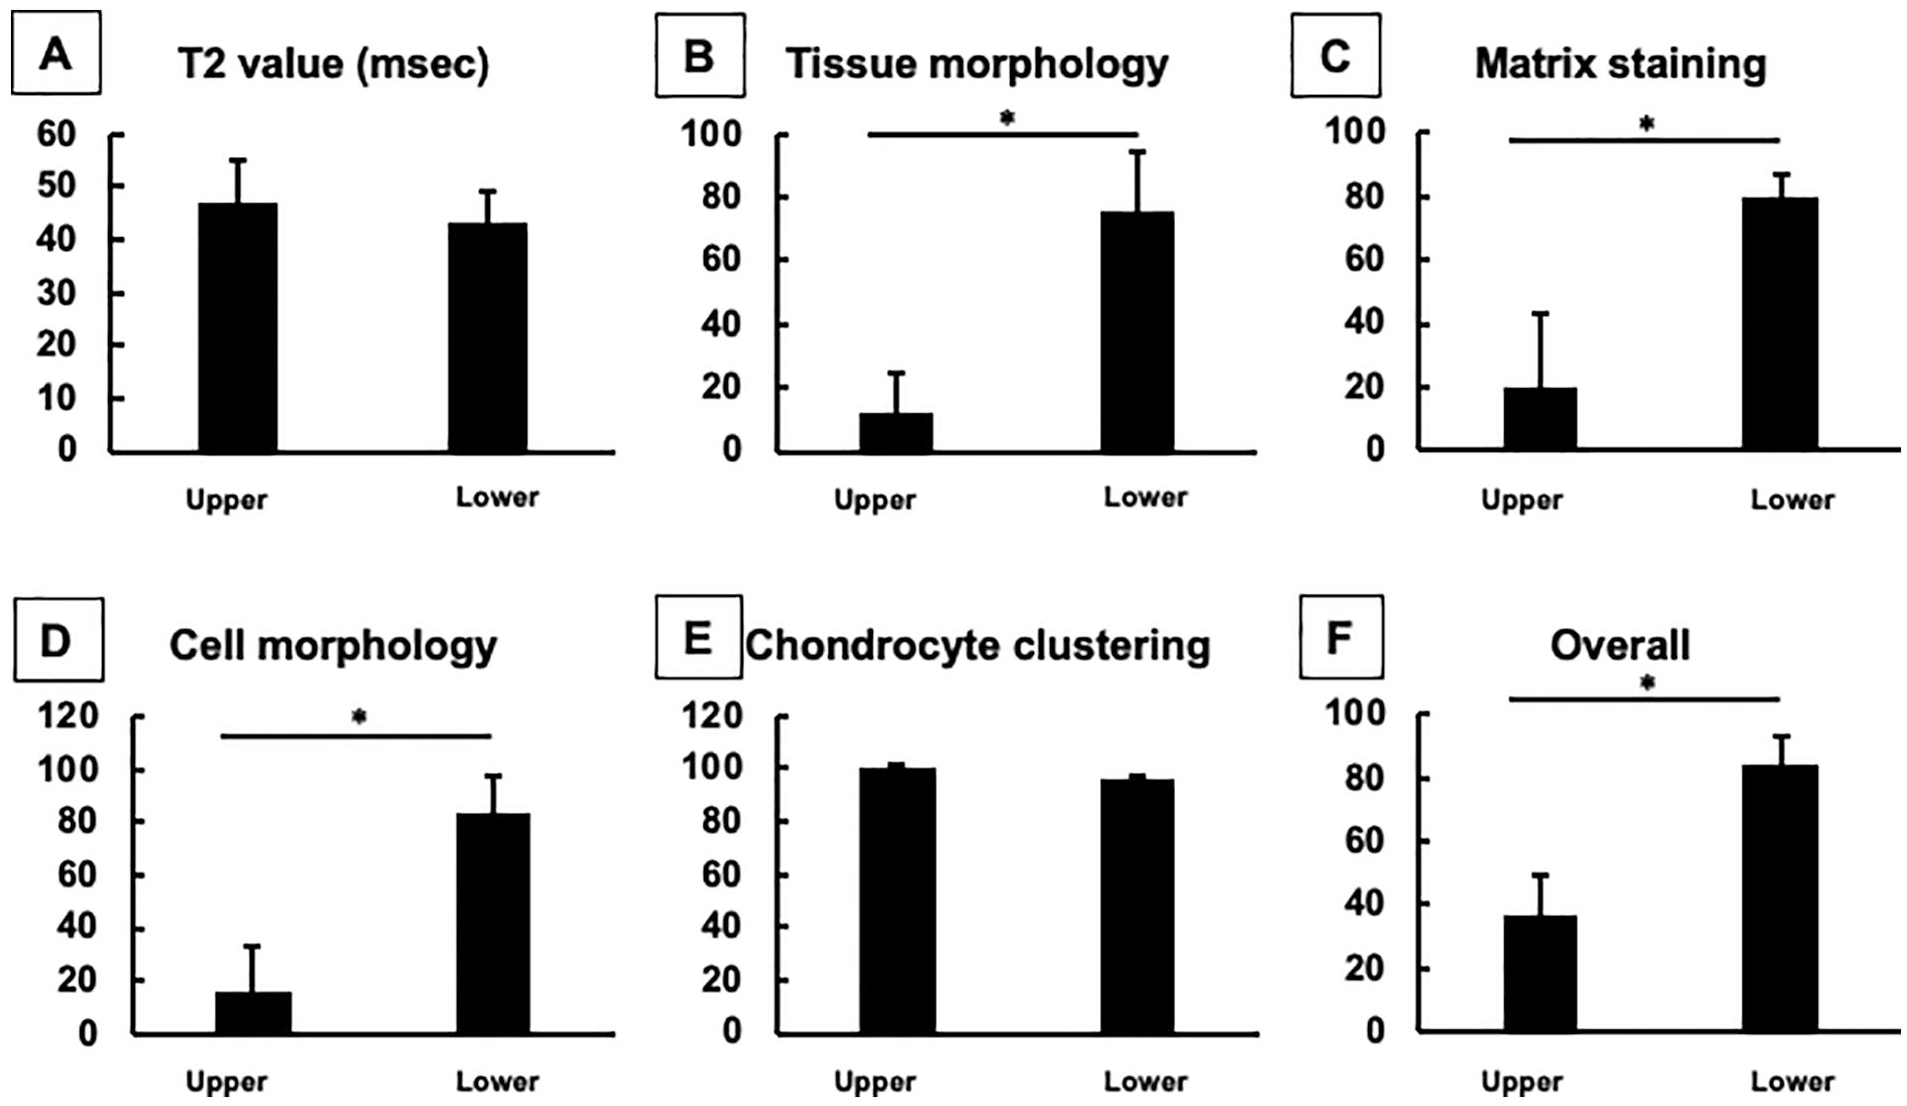
The mean T2 values and histological scores for repair tissues in the upper and lower zones. (
Correlation between T2 Mapping and Histology
There was obvious zonal structure of the repair cartilage observed from the histological assessments, as described above ( Fig. 6B-F ). Conversely, such zonal differences were not detected by quantitative T2-mapping MRI. There were no statistical significances detected among zones regarding T2 values ( Fig. 6A ). Therefore, there were no correlations detected between T2 values and histological scores, in all categories for “tissue morphology,” “matrix staining,” “cell morphology,” “chondrocyte clustering,” and the “overall” scores ( Fig. 7A-E ).
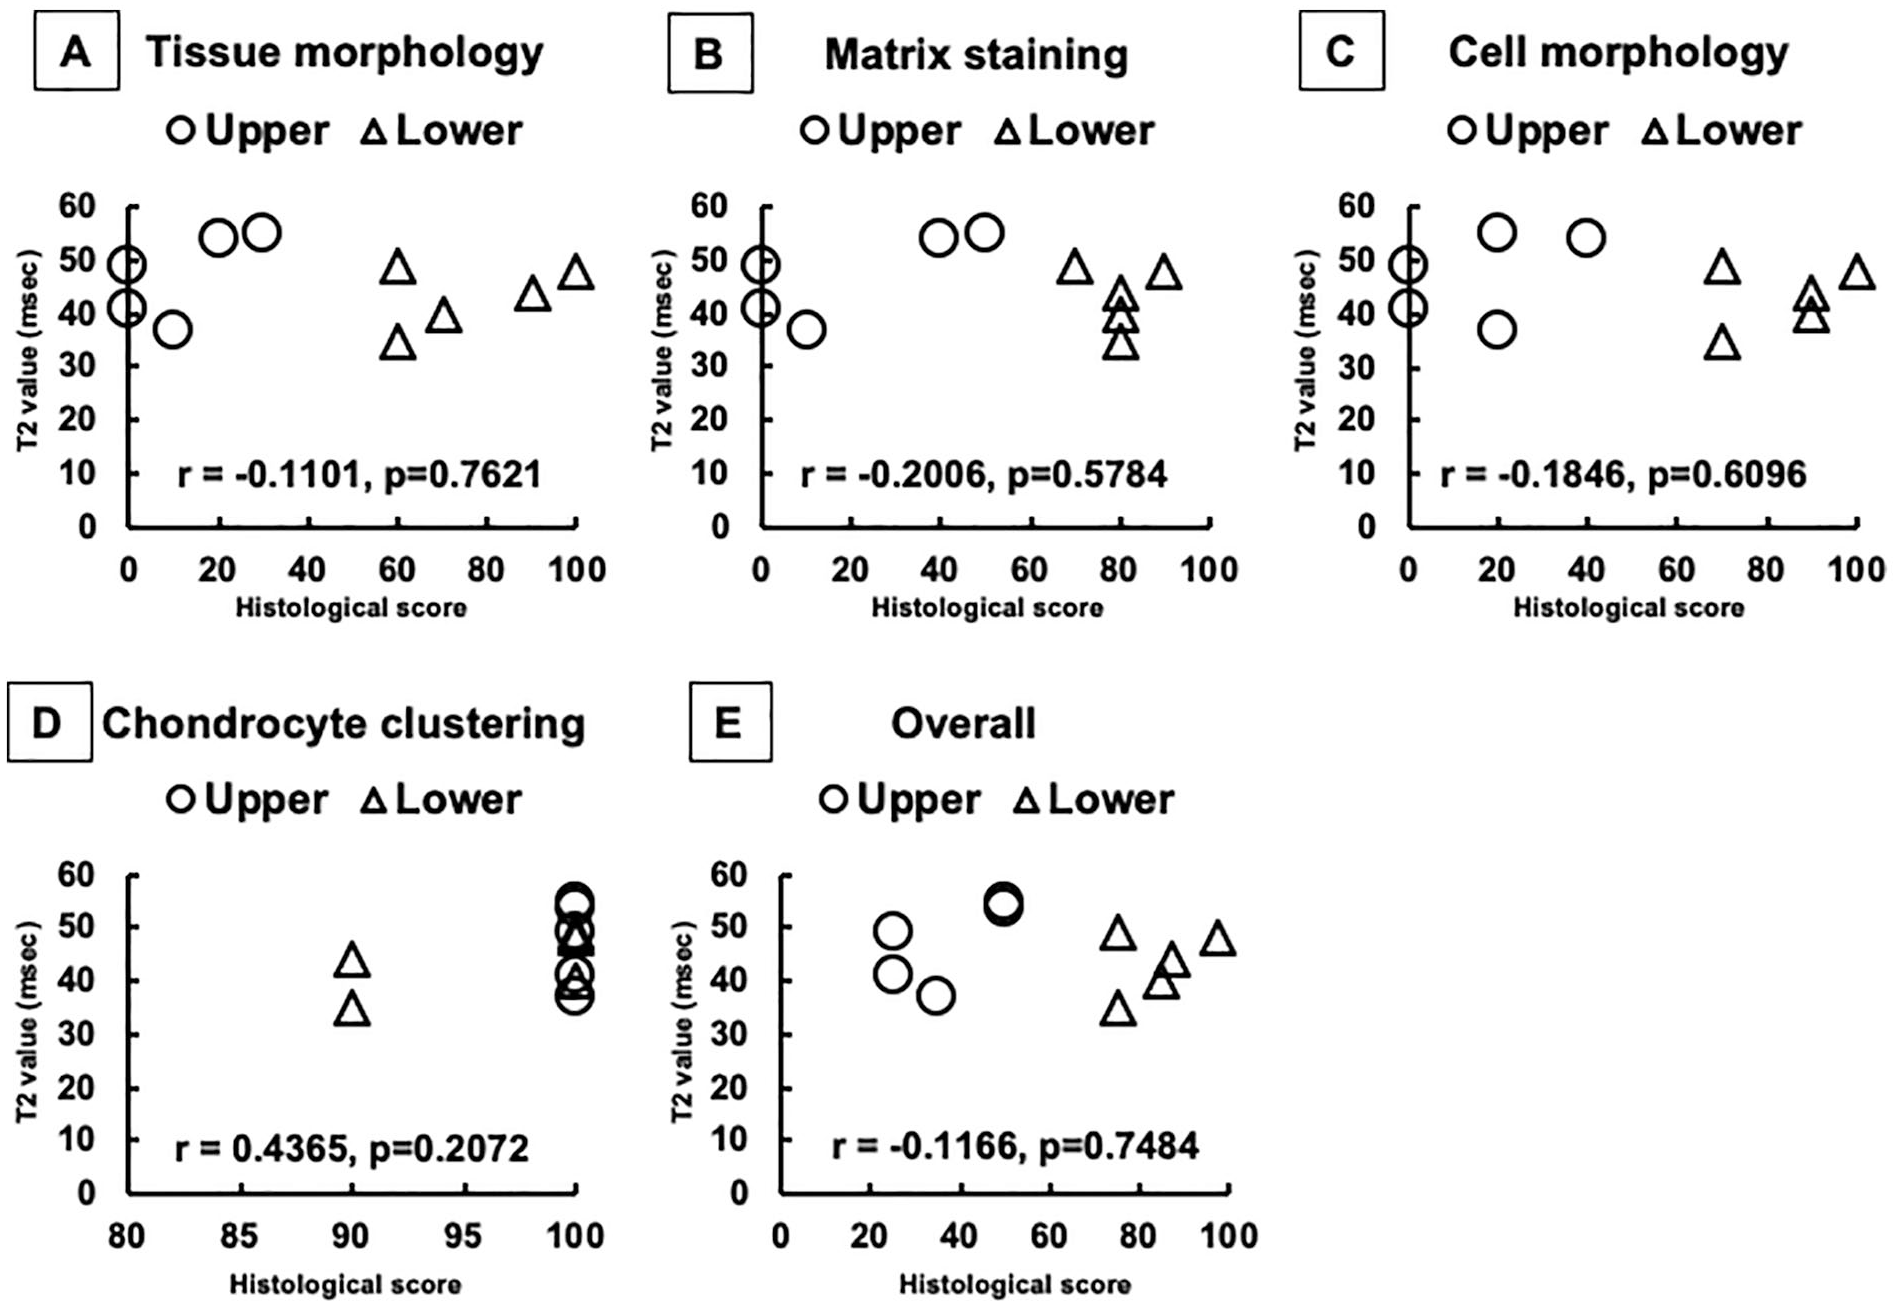
Correlation between T2 values and histological scores. There were no correlations detected between T2 values and histological scores in all categories of “tissue morphology,” “matrix staining,” “cell morphology,” “chondrocyte clustering,” and for the “overall” scores.
Discussion
In this study, we investigated the correlation between zonal T2-mapping MRI and the histology of repair cartilage resulting from implantation of a scaffold-free TEC generated from autologous synovial mesenchymal stem cells. With quantitative compositional evaluations, the zonal structure of the TEC-mediated repair cartilage was clearly detected by histology. Conversely, T2-mapping MRI was not sufficiently sensitive to detect such zonal structural differences at 48 weeks post-implantation of the TEC. This possibly suggests an insufficient ability to detect zonal differences in repair tissues using the current technology of quantitative MRI, and the advantage of a tissue biopsy to accurately evaluate repair quality, although it is invasive. However, given this 48-week postimplantation baseline, it may be possible to detect zonal differences in T2 MRI images as the repair tissue continues to mature at 2 or 5 years postimplantation of the TEC. Likely it may not be ethical to continue to take biopsies of the repair tissue, but determination of the continued maturation of the repair tissue via T2 MRI assessment is a feasible approach.
MRI is widely used to noninvasively evaluate repair cartilage. Specifically, MRI can depict repair condition throughout the repair area and thus, this approach can avoid a potential sampling bias that may occur with a small tissue biopsy taken for histological evaluation. 17 Moreover, the quantitative MRI T2 mapping does allow for biochemical evaluation of the articular cartilage, as the T2 values reflect water content and the organization of the collagen network in the tissue.2,34-36 Such quantitative MRI can detect early osteoarthritic changes, with significant correlation between MRI results and histological assessments using cartilage specimen obtained at the time of total knee arthroplasty.20,21,37 On the other hand, native hyaline cartilage does show a significant trend for increasing T2 values from lower to upper zone, while reparative fibrous and/or fibrocartilaginous tissue after microfracture exhibited no significant detectable change with depth.22,23 Similarly, our results with T2 mapping failed to detect the compositional differences between the upper and lower zone of the repair tissues, while the T2 values of surrounding healthy cartilage clearly showed such zonal differences; however, such differences were clearly detected from the histological analyses. Thus, the present results did not support the claim by a recent report regarding the application of quantitative MRI as the best tool to assess repair quality after implantation. 11 Also, previous studies have also addressed the limitation of quantitative T2 mapping or quantitative dGEMRIC to provide sufficiently detailed structural evaluation of cartilage repair, due to the somewhat limited resolution of currently available imaging technology.19,24 Moreover, it is still controversial as to whether the T2 values of repair cartilage could be correlated with postoperative clinical outcome scores. 24 Taken together, it is likely that the use of T2 mapping in its current form is still not sufficiently sensitive for the detailed evaluation of repair cartilage, especially for the assessment of zonal structure. One possible explanation regarding such limitations of T2 mapping is that upper zone cartilage was more sensitive to the presence of cartilage lesions than lower layer cartilage, likely due to spatial differences in T2 sensitivity, as addressed in previous studies.38,39 As yet another possible reason for the limitations, the repair tissue contained a somewhat disorganized collagen ultrastructure in some cases, a situation that could not be detected by standard histological staining like hematoxylin and eosin or safranin O staining, and the correspondingly affected T2 values. Specifically, the repair tissue with hyaline-like tissue in the lower zone (patients 1 and 5) showed a significant trend of increasing T2 values from lower to upper zone, while those with more fibrocartilage-like tissue (patients 2, 3, and 4) showed no clear zonal trend in their T2 values ( Fig. 8 , Table 1 ). Therefore, the assessment of the collagen architecture in cartilage repair tissue with picrosirius red staining ( Fig. 5 ), in addition to conventional hematoxylin and eosin and safranin O staining, can be helpful not only to provide more precise evaluation of the quality of repair tissue but also to elucidate the potential reason for the current limitations of T2 mapping.
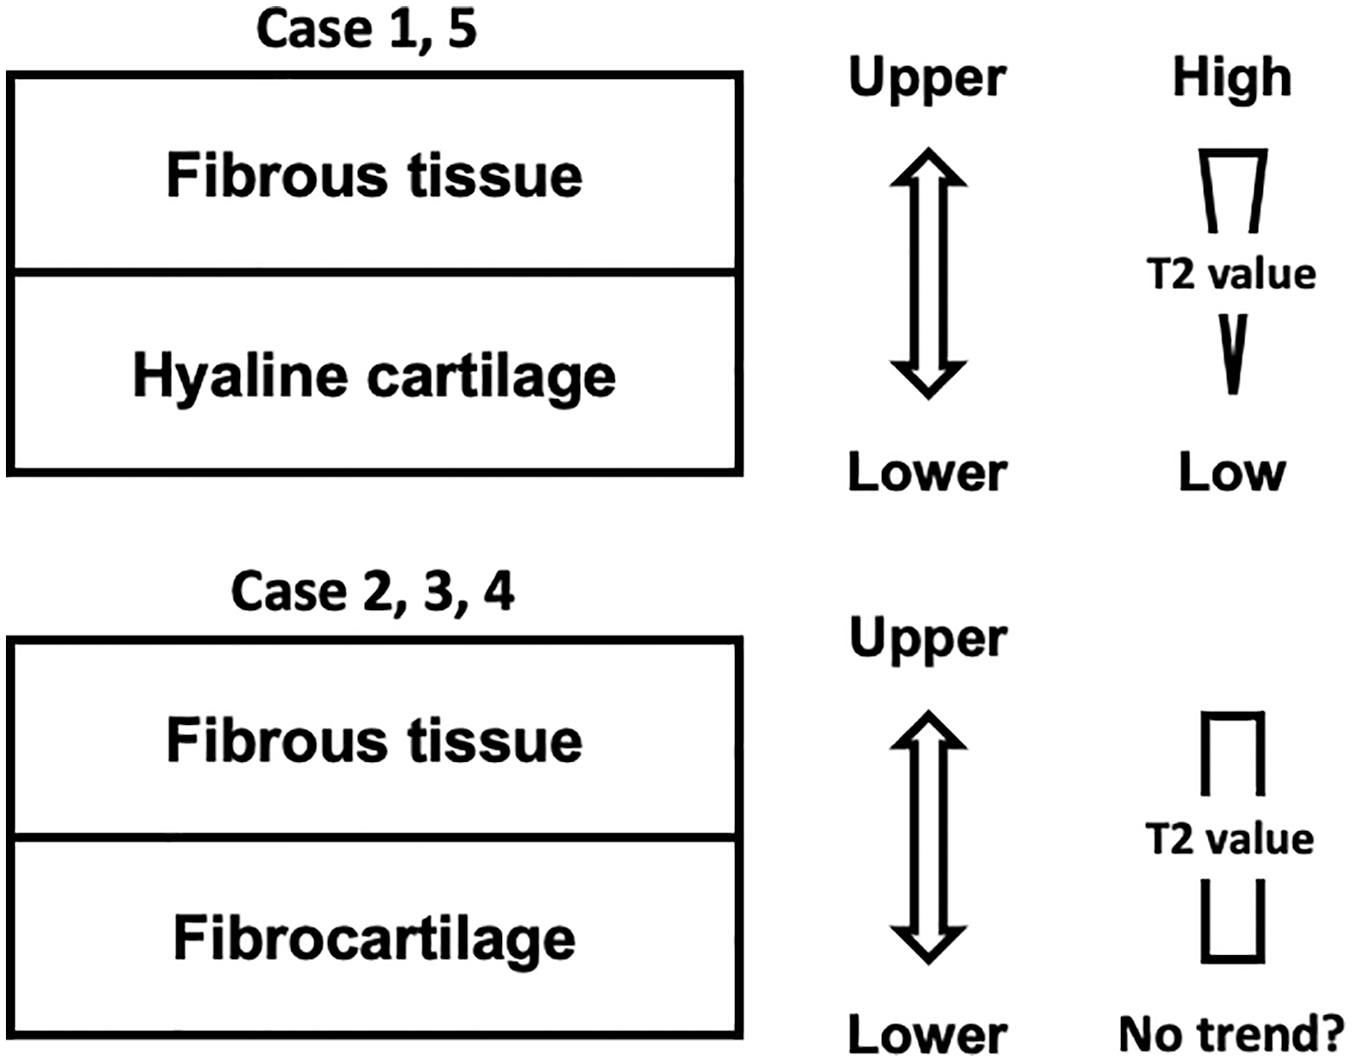
Relationship between repair tissue patterns and T2 values. The repair tissue with hyaline-like tissue in the lower zone (patients 1 and 5) showing a significant trend for increasing T2 values from lower to upper zone, while those with fibrocartilage-like tissue (patients 2, 3, and 4) showing no clear zonal trend in T2 values.
Histologically, safranin O staining specifically detects the quantity and localization of proteoglycan, a major component of articular cartilage. 40 On the other hand, T2 values were reported to show no correlation with proteoglycan content, unlike that of collagen. 41 Consequently, the T2 mapping failed to detect the staining pattern obtained with safranin O that was associated with the zonal structure of the repair tissue ( Fig. 9A ). Similarly, it could be possible that the staining pattern for type II collagen was not comparable to T2 mapping, since the repair matrix staining with type II collagen was consistently accordance with those of safranin O staining. Moreover, the T2 values showed no statistically significant differences among zones, and thus, it is unlikely that T2 mapping could clearly detect the pattern of fibrous collagen orientation stained with picrosirius red staining in this study ( Fig. 9B ). However, T2 values have been reported to reflect the organization of the collagen network in tissue. 36 Taken together, we conclude that the current T2-mapping technique is limited in ability to detect the histological pattern of the repair tissue zonal structure at 48 weeks postimplantation of the TEC. In addition, it may be difficult to predict such patterns from the T2 mapping.
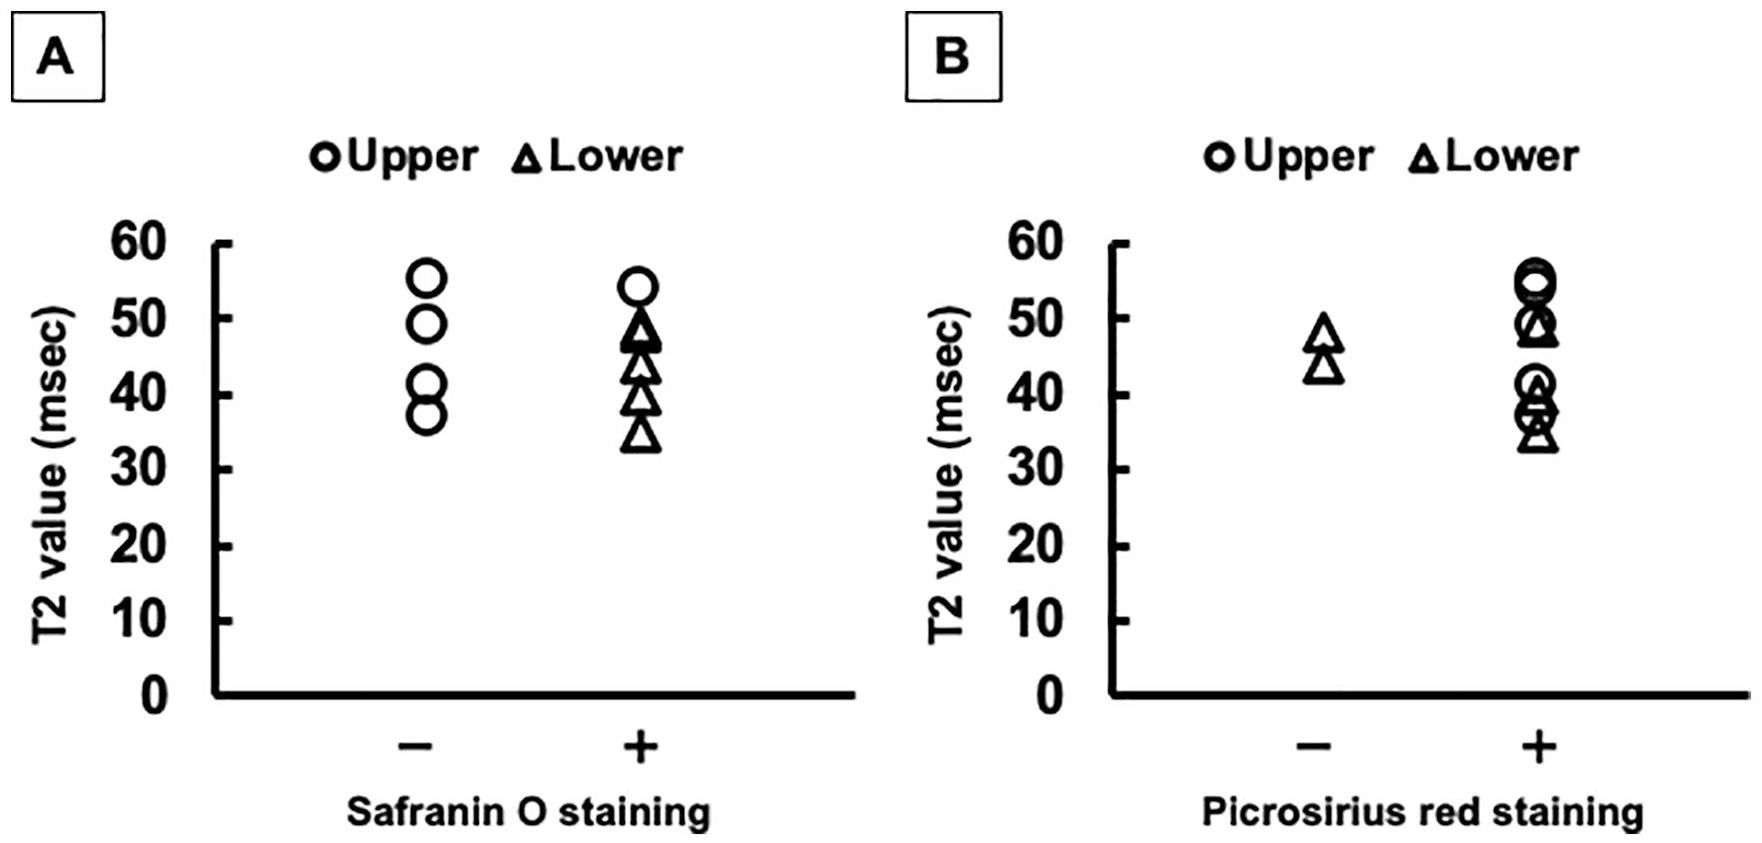
Comparison between T2 values and staining patterns from the histological analyses. (
Regarding the histological analysis for repair tissues after cell-based therapy, recent high-quality clinical trials mostly exhibited zonal structures consisting of fibrous repair in the upper zone and cartilage-like repair in the lower zone, similar to our study, although with somewhat variable results among studies.15,16,42 However, such clinical studies assessed the repair tissues using quantitative T1- or T2-mapping MRI, but detailed zonal analyses for each zone were not performed.11,16,24 Therefore, the present results will be helpful to define the efficacy and limitation of current T2-mapping techniques for cartilage repair tissue. On the other hand, further studies will be necessary to fully elucidate the reason for these limitations and to work to establish a new evaluation method for cartilage repair tissue in the near future. Considering its noninvasiveness, this should be advantageous, and MRI could be a valuable assessment tool, particularly for longitudinal studies. However, it will likely be necessary to find alternative MRI cartilage-specific sequences for the more detailed analyses of cartilage matrix properties. 43
A potential limitation in the present study was that of a small sample size. However, the MRI findings failed to detect zonal differences that were clearly detected by histology at 48 weeks postimplantation of the TEC, and thus could not identify one of the major conclusions of this study. As for a second potential limitation, the T2-mapping MRI evaluated the whole repair tissue filling the cartilage defect, while the histology was limited to assess only the one specimen taken from the center area of repair tissue since the histological assessment of the whole repair tissue was not appropriate in this clinical study. Also, the resolution was different between T2 mapping (approximately 0.44 × 0.54 mm of pixel size) and histology (0.50 × 0.50 μm of pixel size) in this study. As for a third potential limitation, it might be possible to damage the specimen (e.g., tear and bending) in the process of taking a biopsy. Moreover, the repair tissues in the upper zone contained both surface fibrous tissue and underlying cartilage-like tissue, and their patterns were somewhat variable among cases, unlike those in lower zone. To address these limitations of small sample size, we are currently performing an additional clinical trial with increased patient enrollment and including T2-mapping MRI and tissue biopsy assessments. Implementation and completion of such a clinical trial will help reduce the sampling bias and further define the significance of the present study.
In conclusion, current T2-mapping MRI could not detect the morphologic differences between the upper and lower zones of cartilage repair tissues at 48 weeks postimplantation of a TEC, while such differences were clearly detected from the histologic analyses. Thus, although invasive, histologic assessment is likely still the most reliable method for detailed structural quality evaluation of cartilage repair. However, continued assessment of these cartilage repair tissues with T2 mapping may reveal a maturational threshold over time whereby the upper zone may now be distinguished from the lower zone.
Supplemental Material
sj-docx-1-car-10.1177_1947603521989423 – Supplemental material for Histological Analysis of Cartilage Defects Repaired with an Autologous Human Stem Cell Construct 48 Weeks Postimplantation Reveals Structural Details Not Detected by T2-Mapping MRI
Supplemental material, sj-docx-1-car-10.1177_1947603521989423 for Histological Analysis of Cartilage Defects Repaired with an Autologous Human Stem Cell Construct 48 Weeks Postimplantation Reveals Structural Details Not Detected by T2-Mapping MRI by Kazunori Shimomura, Hidetoshi Hamada, David A. Hart, Wataru Ando, Takashi Nishii, Siegfried Trattnig, Stefan Nehrer and Norimasa Nakamura in CARTILAGE
Footnotes
Authors’ Note
This work was performed at the Department of Orthopaedic Surgery, Osaka University Graduate School of Medicine, Osaka, Japan.
Acknowledgments and Funding
The author(s) disclosed receipt of the following financial support for the research, authorship, and/or publication of this article: This work was supported by a Health and Labor Sciences Research grant from the Ministry of Health, Labour and Welfare of Japan; a grant from the New Energy and Industrial Technology Development Organization, Japan; and a Grant-in-Aid for Scientific Research, Japan Society for the Promotion of Science. D.A.H. was supported by the AHS Bone & Joint Health Strategic Clinical Network Program.
Declaration of Conflicting Interests
The author(s) declared no potential conflicts of interest with respect to the research, authorship, and/or publication of this article.
Ethical Approval
This study was approved by the Ministry of Health, Labour and Welfare of Japan (UMIN ID, UMIN000008266; Approval No. HM1201).
Informed Consent
The patients provided written informed consent to participate in this clinical study.
Trial Registration
Not applicable.
References
Supplementary Material
Please find the following supplemental material available below.
For Open Access articles published under a Creative Commons License, all supplemental material carries the same license as the article it is associated with.
For non-Open Access articles published, all supplemental material carries a non-exclusive license, and permission requests for re-use of supplemental material or any part of supplemental material shall be sent directly to the copyright owner as specified in the copyright notice associated with the article.