
Abstract
Objective
Spectroscopic techniques, such as near-infrared (NIR) spectroscopy, are gaining significant research interest for characterizing connective tissues, particularly articular cartilage, because there is still a largely unmet need for rapid, accurate and objective methods for assessing tissue integrity in real-time during arthroscopic surgery. This study aims to identify the NIR spectral range that is optimal for characterizing cartilage integrity by (a) identifying the contribution of its major constituents (collagen and proteoglycans) to its overall spectrum using proxy constituent models and (b) determining constituent-specific spectral contributions that can be used for assessment of cartilage in its physiological state.
Design
The NIR spectra of cartilage matrix constituent models were measured and compared with specific molecular components of organic compounds in the NIR spectral range in order to identify their bands and molecular assignments. To verify the identified bands, spectra of the model compounds were compared with those of native cartilage. Since water obscures some bands in the NIR range, spectral measurements of the native cartilage were conducted under conditions of decreasing water content to amplify features of the solid matrix components. The identified spectral bands were then compared and examined in the resulting spectra of the intact cartilage samples.
Results
As water was progressively eliminated from cartilage, the specific contribution of the different matrix components was observed to correspond with those identified from the proxy cartilage component models.
Conclusion
Spectral peaks in the regions 5500 to 6250 cm−1 and 8100 to 8600 cm−1 were identified to be effective for characterizing cartilage proteoglycan and collagen contents, respectively.
Introduction
Articular cartilage is a highly specialized connective tissue surrounding the ends of diarthrodial joints. It functions by distributing and transmitting load to the underlying bone, as well as providing smooth and frictionless movement in the joints. The function of articular cartilage is governed by the unique interaction between its matrix components, which consist of water (~75%) and extracellular matrix (ECM), comprising mainly collagen (COL, 10%-15%) and proteoglycans (PGs, 3%-10%). 1 Alteration of cartilage matrix components, as a result of either aging or injury, often results in degenerative disorders, such as osteoarthritis (OA)—a debilitating condition characterized by erosion and loss of cartilage tissue. 2 A major challenge in orthopedic research involves development of techniques capable of early detection and monitoring of cartilage degeneration, in order to maximize the outcomes of cartilage repair surgery. Early disease detection is also critical for early deployment of preventative measures, with significant impact on health care.
Recent studies have focused on nondestructive techniques for real-time characterization of this important connective tissue, including optical3-9 and acoustic techniques.10-12 Near-infrared (NIR) spectroscopy is one of the most promising optical techniques that has shown significant potential for rapid characterization of cartilage integrity. 13
NIR spectroscopy is a molecular vibrational technique that is sensitive to specific bond types, including C–H, N–H, O–H, and S–H, which form the fundamental molecular framework of soft biological tissues. 14 Application of this optical technique in biomedicine, particularly in disease diagnosis, has gained significant research interest in recent years, including the detection and characterization of plaques,15,16 diagnosis of arthritis, 17 evaluation of tumors, 18 noninvasive optical measurement of heads of neonates, 19 and nondestructive evaluation of articular cartilage5,6,20-24 and subchondral bone.25,26 Optimal application of this method for cartilage evaluation requires critical understanding of the contribution of individual components of the tissue to its overall NIR spectral response. Thus, relating the components of articular cartilage matrix to specific NIR spectral regions will provide fundamental insight for development of more precise and accurate frameworks for interpreting the tissue’s spectral data in an informed way, with potential diagnostic applications.
The ECM of articular cartilage is composed of a network of collagen fibrils, noncollagenous proteins, and PGs. The collagen fibrils are responsible for the tensile and shear stiffness of the tissue, providing the structural framework for the tissue. These polymeric extracellular structures make up about two-thirds of the dry mass of adult articular cartilage. 27 Collagen fibrils form a 3-dimensional architecture that traps the negatively charged and hydrophilic proteoglycan macromolecules that swell and put the collagen network under intrinsic tension. Type II collagen is the main structural component in mammalian cartilage, but the cartilage ECM of mature individuals also contains collagens III, VI, IX, X, XI, XII, and XIV, which contribute to the mature matrix. 27
Cartilage PGs play a key role in the ability of the tissue to resist compressive loads and recover after unloading.28-31 Accounting for 5% to 10% of cartilage dry weight, PGs primarily consist of aggrecans, which contain covalently attached side chains of the large glycosaminoglycans (GAGs) chondroitin sulfate and keratan sulfate (responsible for the high ECM water content) linked to a protein core. The PG aggregates contain as many as 100 of these aggrecan monomers that are noncovalently linked to hyaluronic acid. Other PGs present in cartilage include the cell surface syndecans and glypican, the small leucin-rich proteoglycans (SLRP) decorin, biglycan, fibromodulin, lumican, epiphycan and the basement membrane PGs, perlecan. 29
The spectrum of articular cartilage can be considered as the sum total of the optical interaction of NIR light with the tissue at the micro- and ultrastructural levels. Hence, structural or compositional changes resulting from loss or alteration of articular cartilage ECM can be detected from its spectral response3,4,22 since the NIR spectrum of articular cartilage contains information on its physical, structural, and functional characteristics.4,5,20,21 Thus, we hypothesize that the NIR spectral response of the individual matrix components of articular cartilage in its physiological state be deduced by assessing the spectrum of matrix component models as proxy. Palukuru et al 32 investigated the contribution of cartilage ECM components to its overall NIR spectrum using pure matrix models in the form of pellets. However, their study did not account for the effect of water, which is a major constituent of cartilage accounting for more than 70% of its composition, and a major absorber of NIR light. 33 The effect of water on light interaction in cartilage is part of the overall spectrum and thus must be accounted for when probing the tissue in its physiological state, for example, for diagnostic applications.
To study the biochemical properties of articular cartilage ECM, cartilage matrix component models, for example, pure COL and GAGs (PGs), suspended in gels, such as hydrogels 34 and metacrylic acid 35 gels, have been used to elucidate the properties of these components in isolation and in interaction with one another. This approach was adopted in this study to identify specific molecular contributions of the matrix components, and to identify their influence on the ultimately resulting NIR spectrum of articular cartilage. The interaction between cartilage components is the basis for the tissue’s biochemical and functional properties. This procedure will address fundamental questions about the regions of cartilage NIR spectra that are specific to its main matrix components. To validate the results obtained from the matrix models, the water content in bovine articular cartilage was gradually eliminated while preserving the matrix composition, and the emerging spectral peaks compared with those of the models.
Materials and Methods
Cartilage Component Models: PG and COL Models
Pharmaceutical grade joint supplement, containing a mixture of glucosamine sulfate and chondroitin sulfate (CS) (Blackmores Pty, Warriewood, New South Wales, Australia), was utilized as a model of cartilage PGs. The ratio of CS to keratan sulfate in cartilage PG is about 2:1, with CS being 4 times heavier than keratan sulfate, thus justifying the use of CS as a representative of cartilage PGs. This is further supported by earlier compositional studies where CS was used as a proxy for cartilage PGs.36,37 Characterization of the interaction of this model with water was examined with model-water mixtures (gel) of varying concentrations. Six different concentrations of PG model gels (50%, 66.7%, 75%, 80%, 83.3%, and 90.9%) were prepared by dissolving the powder in 0.15 M phosphate buffered saline (PBS) solution.
Bovine dermal collagen (Devon Pty, Sydney, New South Wales, Australia) was used as the COL model. Although COL types I and II differ in location and function in the human body, they are chemically and structurally similar. 38 COL type II forms fibrils similar in structure to type I, with a consistent periodicity of 67-nm, although smaller in diameter. 38 NIR spectra were acquired from the dry and different model concentrations in PBS. Gel mixtures of varying concentrations (50%, 66.7%, 75%, 80%, and 83.3%) were also prepared from the combined COL and PG models in order to study the interaction between the matrix components and identify specific spectral features that could provide qualitative insight and enhance quantitative assessment of these components in the intact cartilage matrix.
Cartilage Sample Preparation
Articular cartilage-on-bone samples (n = 2, 10 × 10 × 7 mm) were extracted from healthy bovine (age = 30-42 months) patellae harvested within 24 hours of slaughter. The samples were wrapped in 0.15 M saline-soaked towels and stored at −20 °C until required for testing. Prior to testing, the samples were thawed in 0.15 M saline solution at room temperature for 2 hours.
NIR Spectroscopy: Data Acquisition and Spectral Preprocessing
NIR spectroscopy was conducted using a Bruker MPA FT-NIR spectrometer (Bruker Optics, Ettlingen, Germany), with detector spanning the full NIR spectral range (wavenumber: 12500-4000 cm−1). The spectrometer is equipped with a fiber-optic probe and connected to a PC running OPUS 6.5 software (Bruker Optics, Ettlingen, Germany) for equipment triggering and spectral data acquisition. NIR spectra were acquired from the mixtures and cartilage samples with the probe in contact with the specimens. Spectral data were acquired at 16 cm−1 resolution, with each spectrum consisting of 64 co-added scans. Prior to sample measurements, a reference spectrum was acquired from a reflectance standard—SRS-99 (Labsphere Inc., North Sutton, NH, USA).
Contribution of Cartilage Matrix Components to Its NIR Spectrum
Water accounts for 65% to 80% of cartilage matrix and significantly influences the overall NIR spectrum of the tissue. 23 This often results in total “masking” of peaks, transformation of peaks to “shoulders” (partial masking), and/or shifts in specific absorption peaks associated with cartilage ECM. To match spectral absorption peaks observed in the models with those of articular cartilage, NIR spectra were acquired from intact bovine cartilage samples undergoing systematic removal of matrix water content in order to accentuate matrix-related (COL and PG) absorption peaks that are otherwise masked due to interaction with the tissue water content. Two approaches were employed to gradually alter cartilage matrix water content while preserving the ECM composition, namely: drying at room temperature to eliminate free water; and immersion in ethanol, for removal of both free and bound water.
In the drying protocol, an intact cartilage sample (sample 1) was exposed to room temperature in a control chamber (without any protective hydrated covering over the tissue surface), and NIR spectra were acquired at regular intervals during the drying process. Drying was performed for a total of 16 hours, and spectral data were acquired at 30-minute interval. The second intact cartilage sample (sample 2) was immersed in 75% ethanol solution. With the fiber-optic probe tip in contact with the immersed sample surface, NIR spectra were acquired every 1 minute in the first 15 minutes of treatment, then every 20 minutes for the next 2 hours, and finally every hour for the next 12 hours in order to observe the immediate, short- and long-term effects of eliminating free and bound water from the matrix. Spectral acquisition time was sufficient to observe distinct peaks associated with the solid matrix components of the cartilage matrix. The resulting spectra were compared with that of pure ethanol to verify that spectral peaks obtained can be attributed solely to matrix-related absorptions.
Results and Discussion
Typical NIR spectra of cartilage component models (PG and COL) in their dry state are presented in Figure 1 . Spectral peaks in the region 4000 to 6000 cm−1 are consistent with those observed by Baykal et al. 39 from engineered cartilage constructs. Peaks B (~4400 cm−1) and F (~5100 cm−1) can be observed to be common to both models, albeit with different spectral intensities.
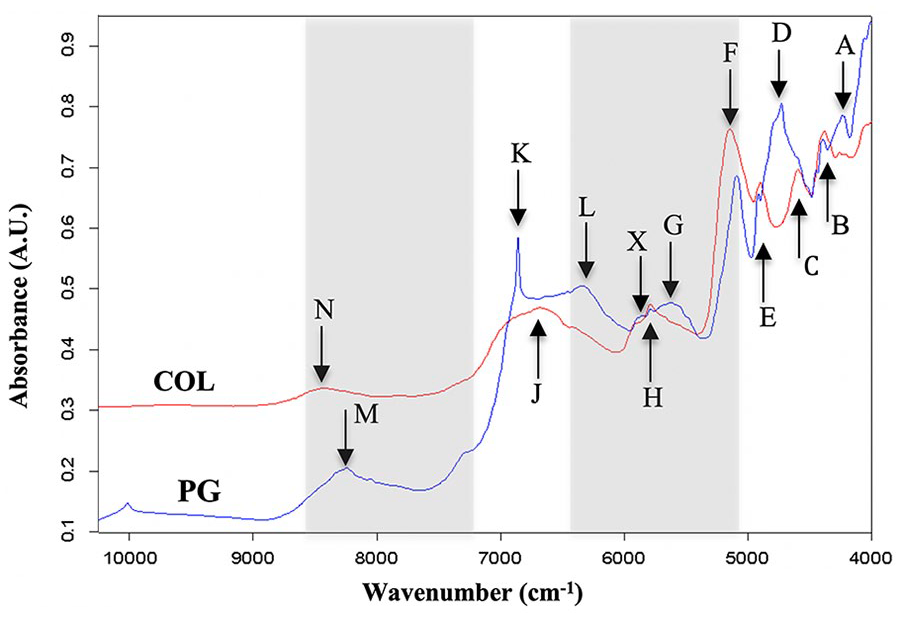
Typical near-infrared (NIR) absorbance spectra of cartilage matrix models (proteoglycan [PG] and collagen [COL]) showing distinct spectral peaks associated with the matrix components. The highlighted sections show regions that are useful for evaluation of articular cartilage in its physiological state. The specific band assignment of each peak identified is defined in Table 1 .
Spectra of the PG model at different concentrations in PBS ( Fig. 2 ) exhibit similar peak profiles as the spectrum of the dry model, albeit with consistently increasing absorption peaks with hydration. The effect of hydration is visible across the full spectral range, with systematic increase in spectral baseline and broadening of peaks, most notably the OH peaks due to absorption by water. These strong OH absorptions peaks are due to first (5076-5250 cm−1) and second (6667-7200 cm−1) overtone OH bond vibrations, 33 which are dominant in the spectra of fluid-saturated biological materials, such as articular cartilage.
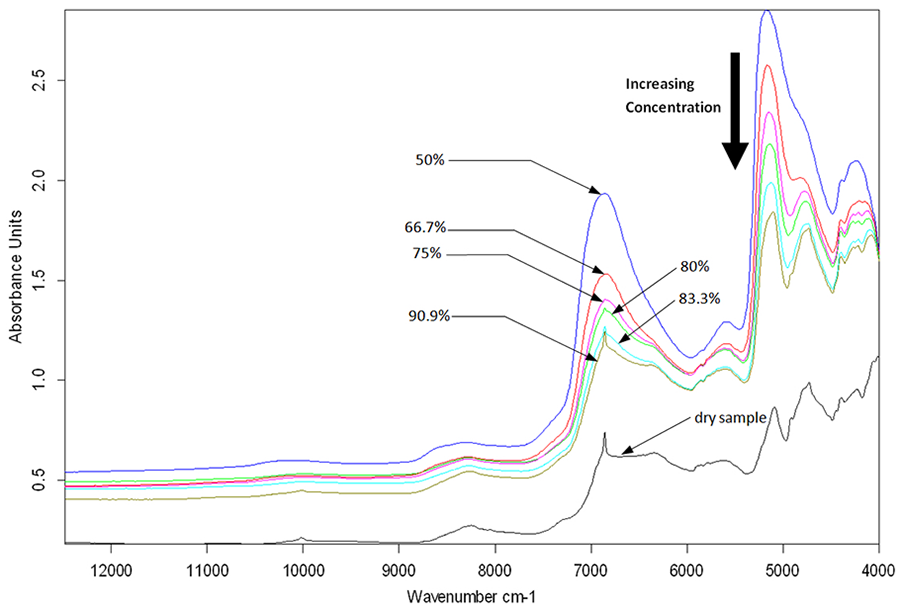
Near infrared spectra of proteoglycan (PG) model gels at varying mass concentrations in saline.
In addition, masking of some peaks can be observed as the level of hydration increases, particularly in the combination band 4000 to 5250 cm−1 ( Fig. 2 ). This indicates that while certain spectral peaks are identifiable in the dry model, they may not be clearly defined or useful for characterization of the physiological (hydrated) tissue. Thus, this spectral region is unlikely to be effective for characterizing cartilage PGs.
Similarly, the spectra of the mixture of PG (1/3) and COL (2/3) models at varying concentrations in PBS show consistent increase in spectral baseline and broadening of peaks with increasing hydration levels ( Fig. 3 ). As with the PG model, distinct peaks in the combination region 4000 to 5250 cm−1 are gradually masked as hydration level increases. Thus, spectral information in this region is neither accessible nor useful for in vivo quantitative characterization of articular cartilage.
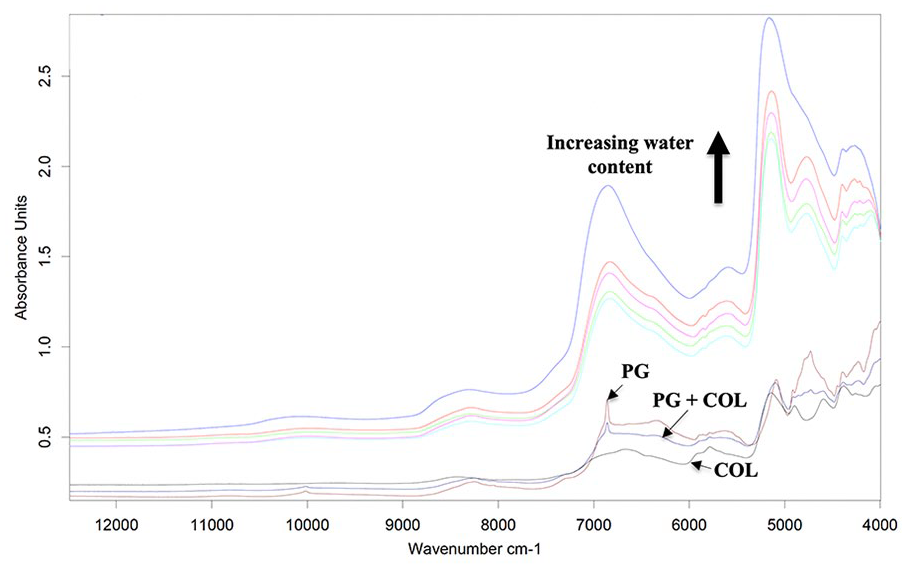
Near-infrared (NIR) spectra of proteoglycan (PG) and collagen (COL) models, with their mixtures at 83.3%, 80%, 75%, 66.7%, and 50% concentrations, respectively, in the direction of the arrow.
In their study, Palukuru et al. 32 used the spectra of pure cartilage component models in the combination region 4000 to 5000 cm−1 to build multivariate models for predicting the matrix composition of bovine cartilage. However, the effect of hydration on the cartilage component models, which significantly alters the resulting spectra ( Figs. 2 and 3 ), was not accounted for.
By comparing the spectra of dry models with those of their hydrated counterparts (
Spectral Absorption Peaks and Band Assignment Associated with Articular Cartilage Solid Matrix Components in the Near Infrared (NIR) Range. a
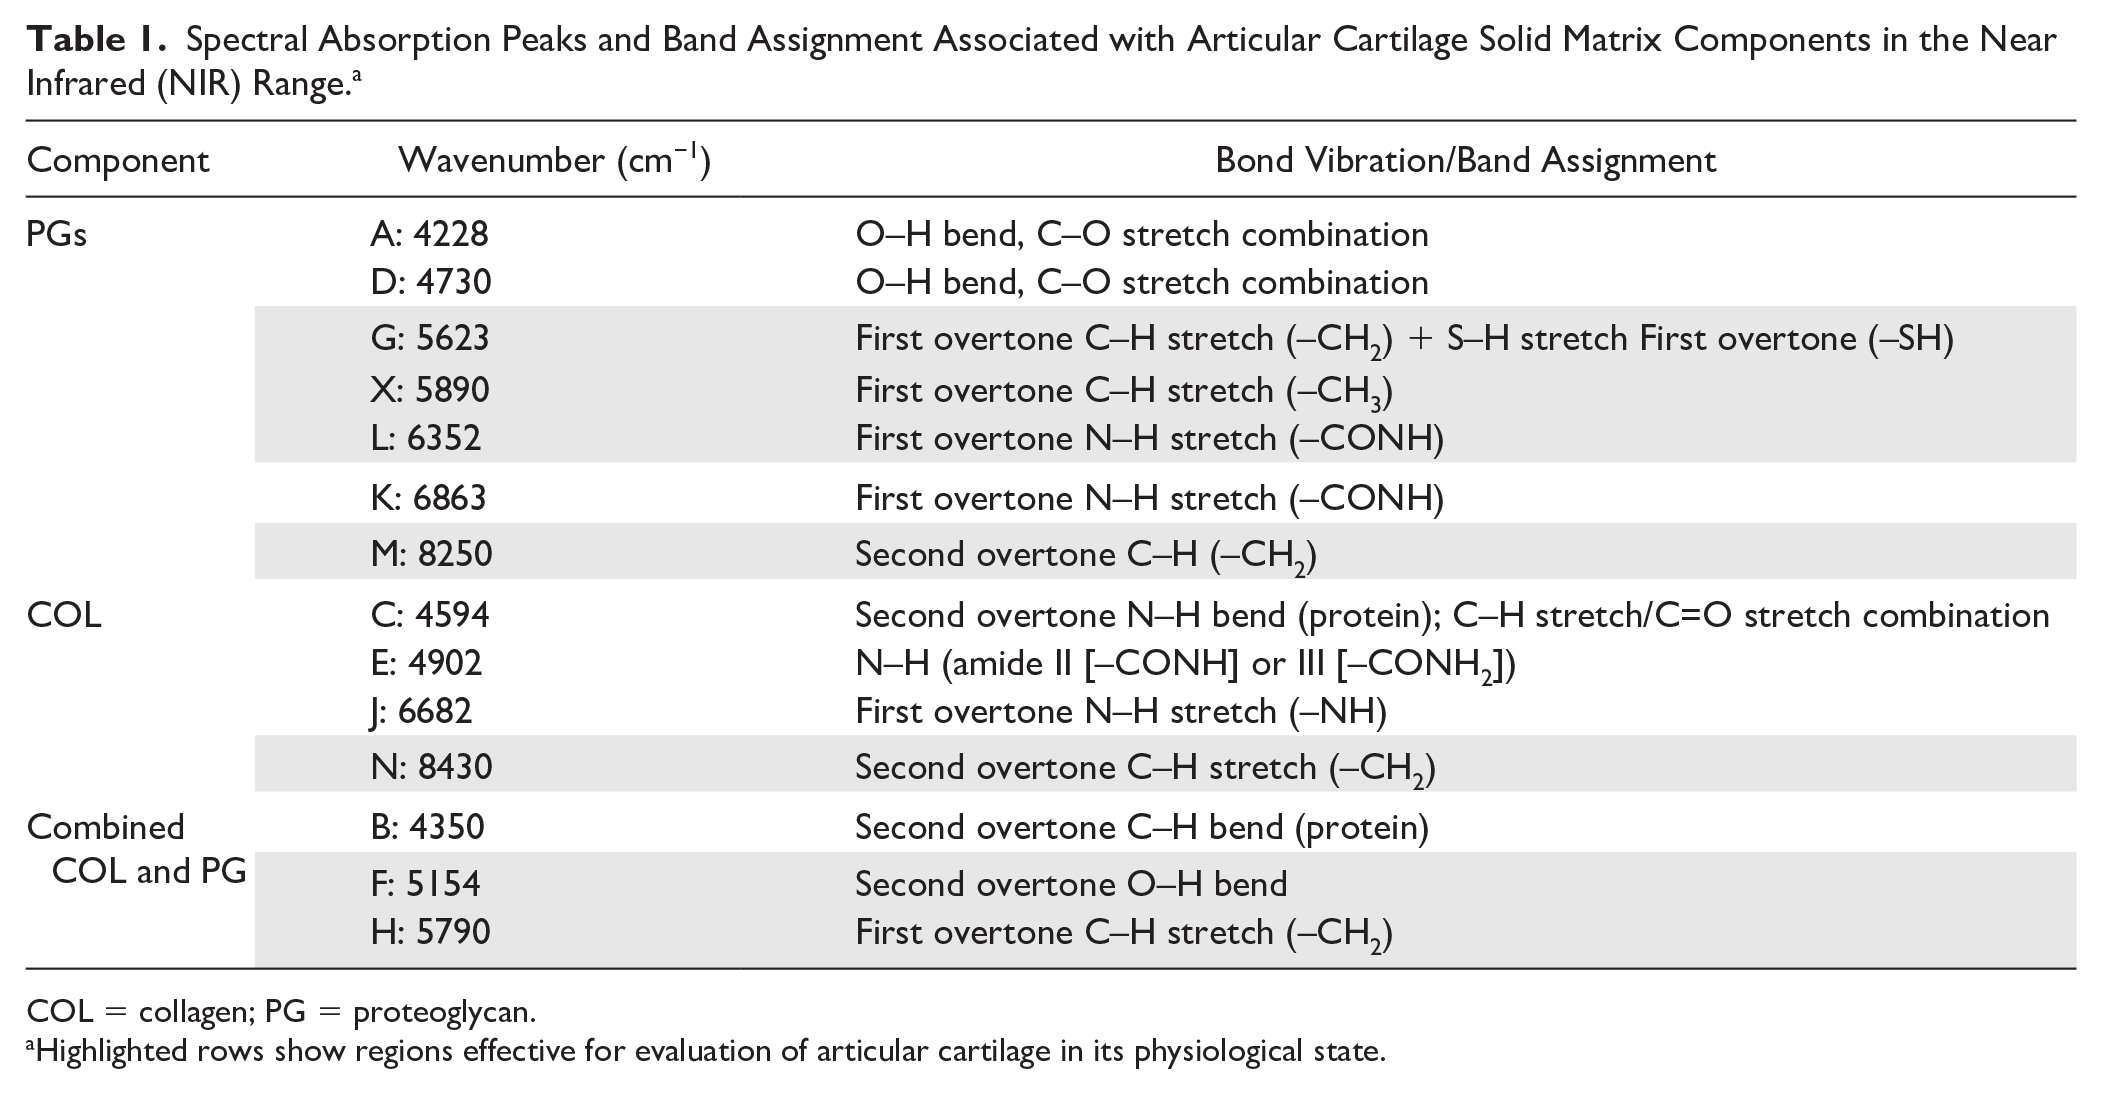
COL = collagen; PG = proteoglycan.
Highlighted rows show regions effective for evaluation of articular cartilage in its physiological state.
The NIR spectrum of intact (healthy) articular cartilage ( Fig. 4 ) is dominated by the effect of water spanning the full spectral range. As with spectra of the hydrated models, the effect of hydration is more apparent around the first (5076-5250 cm−1) and second (6667-7200 cm−1) overtone OH peaks due to cartilage water content. Each absorption spectrum was obtained by computing the negative log of the ratio of the sample spectrum to the reference spectrum.
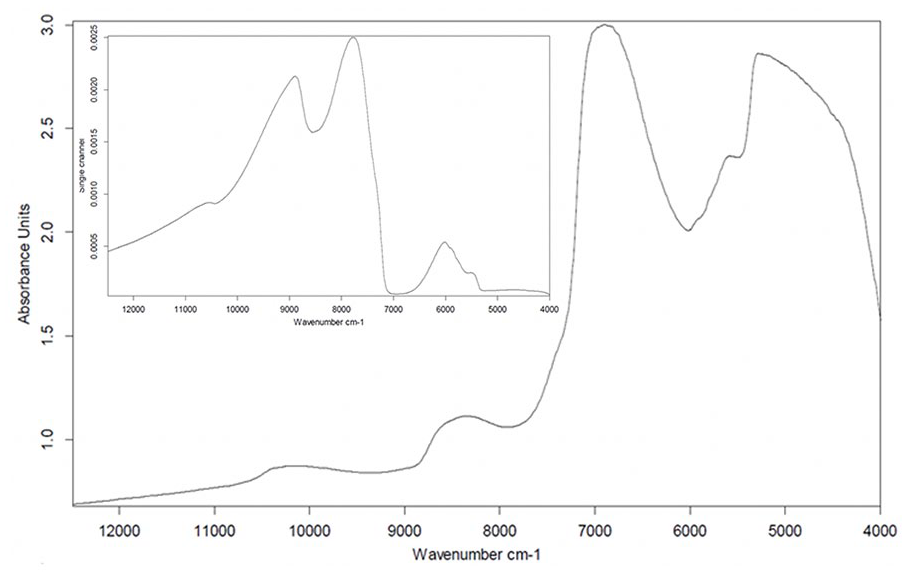
Typical near-infrared (NIR) spectrum of articular cartilage showing the absorption spectrum and raw sample spectrum (
The raw sample spectrum (
To investigate the underlying similarities and differences in the spectral data, principal component analysis ( Fig. 5 ) was performed on the spectra of native articular cartilage (AC) and its matrix component models in dry (PG, COL, and MIX = PG + COL) and different concentrations of wet (PG and MIX) states. The score plot of the first 2 principal components (PC1 and PC2, Fig. 5A ) show distinct sample grouping consistent with increasing hydration from right to left along PC1, with native cartilage having the highest hydration level (>70%). Thus, it is arguable that PC1 is strongly related to the sample water content. The score plot of the second and third principal components (PC2 and PC3, Fig. 5B ) show a different grouping configuration (mostly along PC2), where native cartilage clusters are closer to the dry than wet matrix constituents. Furthermore, the loadings of PC2 and PC3 ( Fig. 5C ) exhibit features similar to those of the input spectra. For examples, the PC2 loadings exhibit peaks (peaks N and J) observable in the spectrum of dry COL ( Fig. 1 ), while spectral features of the dry PG model can be observed in PC3 loadings (peaks M and K). This suggests that PC2 is strongly related to COL and PC3 to PG. In addition, the loadings include spectral regions that are useful for evaluation of articular cartilage in its physiological state (shaded region in Fig. 5C ). This is consistent with spectral peaks highlighted in Figure 1 and listed in Table 1 . The spectral region 5250 to 6400 cm−1 is indicative of cartilage PG content, while the region 7250 to 8700 cm−1 is more indicative of the matrix COL content.
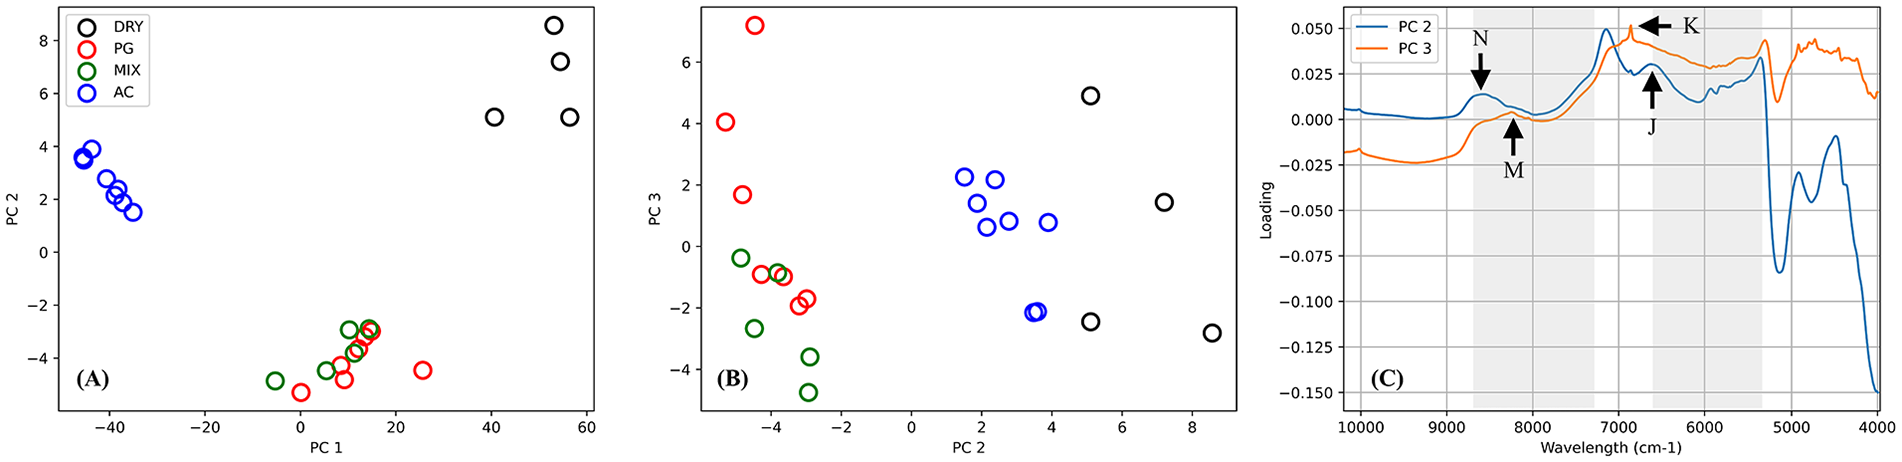
Principal component analysis of the spectra of native articular cartilage (AC) and its matrix component models in dry (COL, PG, and MIX = PG + COL) and different concentrations of wet (PG and MIX) states. (
Water in biological tissues often exists in “free” form or hydrogen-bonded to biomolecules. In nuclear magnetic resonance (NMR) studies of soft tissues, different proton relaxation times have been used to indicate the varying degrees to which water is bound to macromolecules.41,42 Estimation of the amount of bound water in skin, for example, is as much as 90% of total skin water content. 43 Tissue water can be categorized into 3 main types, 44 namely strongly bound water, prevalent at biosurfaces, for example, at the phospholipid bilayer of articular cartilage surface; weakly bound water, hydrogen-bonded to macromolecules; and free water, hydrogen-bonded to itself and with properties similar to pure water, although the transition from bound to free water is not well defined.44,45
In NMR studies of PG hydration in articular cartilage, the weight ratio of PG-bound water to PG was reported to be about 1.1, and 3.6 for free water.42,46 Thus, elimination of both free and bound water could provide an approach for understanding the specific NIR spectral signature of the matrix components in articular cartilage. With the effect of hydrogen-bonding strength on molecular vibrations, 47 it is arguable that the interaction of bound water with the matrix constituents will differ spectroscopically from that of free water. In articular cartilage, a significant proportion of the water exists as exchangeable free water, 48 while the remaining exists as bound water; mostly bound to the matrix PGs. The ratio of PG-bound water to total water content in articular cartilage has been reported to be between 0.2 and 0.23.42,46
Variation in the spectra of articular cartilage with gradual removal of water from the tissue via drying is presented in Figure 6 . The process was continued until no difference in spectral pattern was observed between subsequent spectra, and the final spectrum is indicated as the “finish” spectrum. Examination of the spectra reveals systematic decrease in overall spectral baseline and peak intensity ( Fig. 6A ) as water is expelled from the tissue.
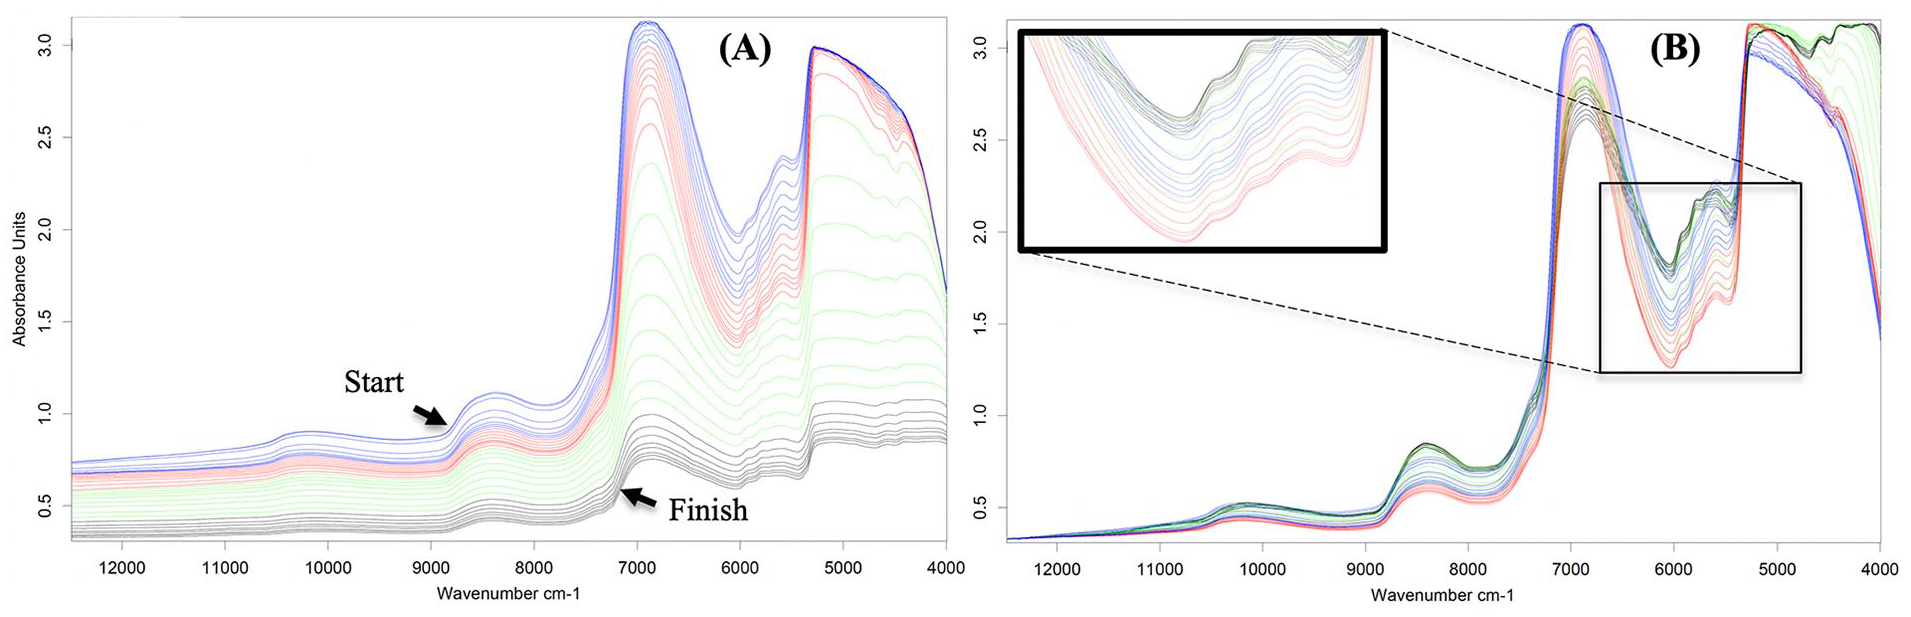
(
When baseline corrected ( Fig. 6B ), resolution of spectral peaks can be observed, primarily between 5500 and 6250 cm−1 after 12 hours of drying. This region is indicative of cartilage PG content, which is justifiable since these negatively charged macromolecules swell in the presence of water, resulting in the creation of the intrinsic swelling pressure responsible for the compressive stiffness of cartilage.
Since drying is a physical process, the observed spectral variations can arguably be attributed to changes in free water, as the bound water is chemically bonded to the matrix components. While some peaks became noticeably resolved postdrying, they are not clearly defined due to the masking effect of water which spans the NIR spectral range. This observation suggests that a significant proportion of fluid-solid matrix spectral interaction may be attributed to bound water, which is intimately linked to the cartilage collagen-proteoglycan matrix complex.
Elimination of bound water by immersion in ethanol permitted direct inspection of spectral contribution from the solid matrix components that would otherwise be masked by association with bound water. The output spectra of 14.25 hours of treatment ( Fig. 7 ) show clear resolution of distinct peaks (inset I and II) as the masking effect of bound water diminishes. Inspection of the spectra reveals gradual emergence of peaks C (5780 cm−1), D (5902 cm−1), and E (8435 cm−1) on the “red” spectra (4-8 hours) from partially masked spectra (shoulders) in the “blue” (0-4 hours) spectra. A shift of the absorption peak from A (5582 cm−1) to B (5668 cm−1) can also be observed. Given the relationship between cartilage ECM and bound water, the changes observed in the spectra with varying bound water content could hold potential diagnostic information. Although the experiment in this study was not designed to answer this question, it is plausible that changes in matrix integrity at the early stages of degeneration, which are more biochemical and microstructural in nature, could be detected via changes in the effect of bound water at the spectral bands identified.
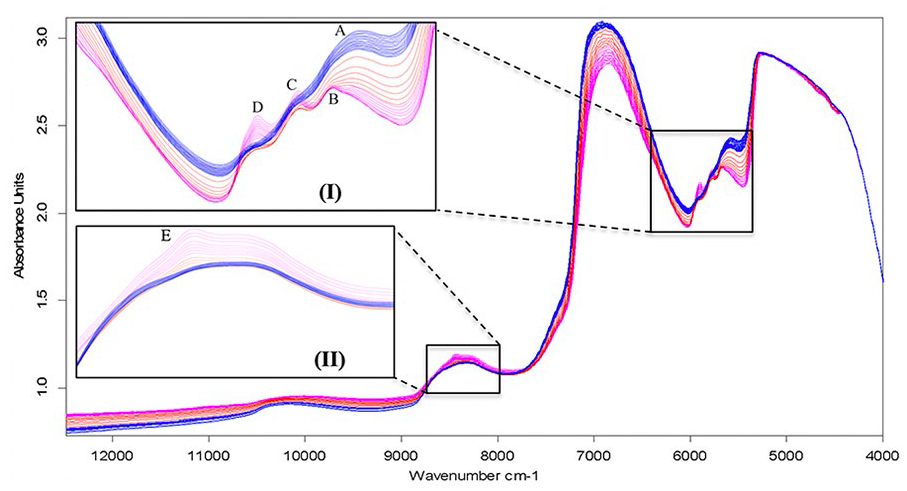
Spectra of articular cartilage showing changes in spectral peaks as bound water is gradually dissociated from the solid matrix components using ethanol. Inset plots show the most noticeable peak spectral changes. Blue = first 15 minutes of treatment; red = next 2 hours of treatment; pink = next 12 hours of treatment. Note: For clarity, not all spectra are displayed.
Although the proportion of bound water in articular cartilage is only a fraction of the amount of free water, its effect on the spectral response is profound. The effect of ethanol in the early stages of treatment (represented by the blue and red spectra) can be ascribed to removal of some free water, as the spectra are similar to those obtained from drying (after baseline correction). However, transformation of shoulders (on the “blue” spectra) into distinct peaks at C, D and E (on the ‘pink’ spectra) can be attributed to removal of bound water from the matrix, thus accentuating the spectral signature of the solid matrix components (PG and COL). In addition to removal of bound water from the tissue, ethanol also preserves the tissue structure. 49
Comparing the observed peaks with the proposed peak assignment for cartilage matrix components ( Table 1 ), peak A in the “blue” spectra is arguably the PG peak proposed to be at 5623 cm−1 ( Table 1 , peak G), but observed at around 5582 cm−1 due to interaction with the matrix water. As the effect of bound water diminishes, peak A can be observed to shift leftward to B at around 5668 cm−1, which is within the region proposed to be indicative of matrix PGs and due to first overtone –CH2 and –SH stretch vibrations ( Table 1 ). Hence, for full thickness cartilage samples, the region 5500 to 5700 cm−1 would be effective for assessment of cartilage PG content.
Peak C is consistent with the combined COL-PG absorption peak ( Table 1 , peak H) and results from first overtone CH2 stretch vibrations. Peak D exhibited the most dramatic change with alteration of the matrix hydration and based on comparison with the spectral peak assignments on Table 1 , this peak is consistent with peak X and associated with the matrix PG content. Similarly, peak E is consistent with the collagen-related peak (N) in Table 1 , resulting from second overtone CH stretch vibrations. Thus, observation of peaks in the region 5500 to 6250 cm−1 is effective for characterization of cartilage PG content, while the region 8100 to 8600 cm−1 is optimal for assessment of cartilage collagen content.
The outcomes of this study present a framework that could enable effective application of NIR spectroscopy for characterization and diagnostic assessment of articular cartilage integrity. For example, when adapting NIR spectroscopy for evaluation of PG-related properties of cartilage, such as tissue recovery postcompression,20,50 more attention could be given to the regions characteristic of the molecular signature of PG (
Table 1
). This is supported by studies20,50,51 where the relationship between NIR spectrum and PG-controlled parameters was optimized in the region 5440 to 6100 cm−1 (
Footnotes
Author Contributions
IOA: Study conception, experimental design, data collection, and analysis; drafting of article; and approval of final version to be submitted. AO: Study conception and experimental design, revising draft article for important intellectual content, and approval of final version to be submitted.
Acknowledgments and Funding
The author(s) disclosed receipt of the following financial support for the research, authorship, and/or publication of this article: Dr. Afara acknowledges Academy Research Fellowship funding from the Academy of Finland (Grant No.: 315820).
Declaration of Conflicting Interests
The author(s) declared no potential conflicts of interest with respect to the research, authorship, and/or publication of this article.
Ethical Approval
Bovine patellae samples used in this study were obtained from a local abattoir; thus, no ethical permission was required.