
Abstract
Objectives:
In this study, we examine the capacity of a new parameter, based on the recovery response of articular cartilage, to distinguish between healthy and damaged tissues. We also investigate whether or not this new parameter correlates with the near-infrared (NIR) optical response of articular cartilage.
Design:
Normal and artificially degenerated (proteoglycan-depleted) bovine cartilage samples were nondestructively probed using NIR spectroscopy. Subsequently they were subjected to a load and unloading protocol, and the recovery response was logged during unloading. The recovery parameter, elastic rebound (ER), is based on the strain energy released as the samples underwent instantaneous elastic recovery.
Results:
Our results reveal positive relationship between the rebound parameter and cartilage proteoglycan content (normal samples: 2.20 ± 0.10 N mm; proteoglycan-depleted samples: 0.50 ± 0.04 N mm for 1 hour of enzymatic treatment and 0.13 ± 0.02 N mm for 4 hours of enzymatic treatment). In addition, multivariate analysis using partial least squares regression was employed to investigate the relationship between ER and NIR spectral data. The results reveal significantly high correlation (R2cal = 98.35% and R2val = 79.87%; P < 0.0001), with relatively low error (14%), between the recovery and optical response of cartilage in the combined NIR regions 5,450 to 6,100 cm−1 and 7,500 to 12,500 cm−1.
Conclusion:
We conclude that ER can indicate the mechanical condition and state of health of articular cartilage. The correlation of ER with cartilage optical response in the NIR range could facilitate real-time evaluation of the tissue’s integrity during arthroscopic surgery and could also provide an important tool for cartilage assessment in tissue engineering and regeneration research.
Introduction
Articular cartilage is a highly specialized connective tissue that functions by transmitting stress (load) to the underlying bone in articulating joints. The solid component of this complex tissue, extracellular matrix (ECM), consists mainly of negatively charged proteoglycan (PG) macromolecules trapped within a fibrous collagenous meshwork. The function of articular cartilage is directly related to the integrity of its ECM; thus, detailed knowledge of the macroscopic response and mechanical properties of this tissue is essential for characterizing its functional integrity. 1 This characterization is also important for validating the effectiveness of protocols such as those involved in tissue development, 2 degeneration, 3 and functional assessment of engineered 4 and repair tissue, 5 with consequences for development of effective tissue engineered scaffolds.
Methods such as indentation, confined and unconfined compression, 6 stress relaxation, and creep have been employed to obtain mechanical parameters including stiffness, 7 confined compression modulus (Ha),8,9 and hybrid elastic parameters such as structural elasticity parameters (SEP) 10 for characterizing the functional integrity of articular cartilage. These parameters are determined from the loading response of compressed cartilage samples. In this study, our first aim was to investigate the potential of the recovery response of articular cartilage for characterizing its functional integrity. This is based on the hypothesis that the functional capacity of articular cartilage depends on its ability to fully recover before the next loading cycle.11,12 We note that articular cartilage exhibits instantaneous, short- and long-term recovery 11 ; thus, we utilize a parameter based on the instantaneous recovery response for characterizing normal and artificially degenerated articular cartilage in this study. In addition, existing studies suggest that cartilage recovery is an important parameter in determining the health of the tissue.11,12
A parameter that is sensitive to the state of cartilage health may be useful as an objective tool to complement conventional arthroscopic evaluation, which is limited by subjectivity and poor observer reliabilities.13,14 In order to adapt this parameter for real-time characterization of articular cartilage in laboratory and clinical applications, a method that can aid rapid estimation of the parameter is required. Nondestructive and rapid means of evaluating cartilage integrity in real-time has seen increased research, with optical techniques emerging as promising modalities. Prominent among these techniques are near-infrared (NIR) spectroscopy,11,15-23 Raman spectroscopy,24,25 and optical coherence tomography.26-28 As the second aim of this study, we investigate the capacity of NIR spectroscopy to characterize the integrity of articular cartilage from its recovery parameter.
The capacity of NIR spectroscopy to nondestructively characterize biological systems has been demonstrated in several studies, and its application in the biomedical fields has shown remarkable potentials for clinical diagnoses.29-32 Furthermore, recent studies have demonstrated the ability of this technique to accurately estimate the properties of articular cartilage in both in vitro11,16,19 and ex vivo15,18,33,34 experimental animal studies. In this study, we investigate the relationship between the NIR absorption spectrum of articular cartilage and the proposed recovery-based parameter, based on the hypothesis that the parameter could be estimated from the optical response of cartilage. To model the relationship between the optical response and recovery parameter of normal and degenerated articular cartilage, we employed partial least square (PLS) regression multivariate technique, coupled with spectral preprocessing and transformation.
Materials and Methods
Sample Preparation and Study Protocol
Visually intact bovine patellae samples (N = 4), harvested from prime oxen within 24 hours of slaughter, were used in this study. The patellae were wrapped in 0.15 M saline-soaked towels and stored at −20°C until required for testing. Prior to testing, the intact patellae were thawed in 0.15 M saline at room temperature for 6 hours; cartilage-on-bone blocks (n = 12, l × b × h = 10 × 10 × 5 mm) were then extracted from the patellae. All tests were conducted with the specimens fully hydrated in 0.15 M saline.
The experimental protocol adopted in this study is summarized in Figure 1 . First, the osteochondral samples are subjected to NIR spectroscopic probing ( Fig. 1a ). Subsequently, the same site on each sample is subjected to mechanical loading up to a nominated strain using a plain-ended cylindrical indenter ( Fig. 1b ), and then the instantaneous recovery of the sample is obtained immediately after unloading ( Fig. 1c ).
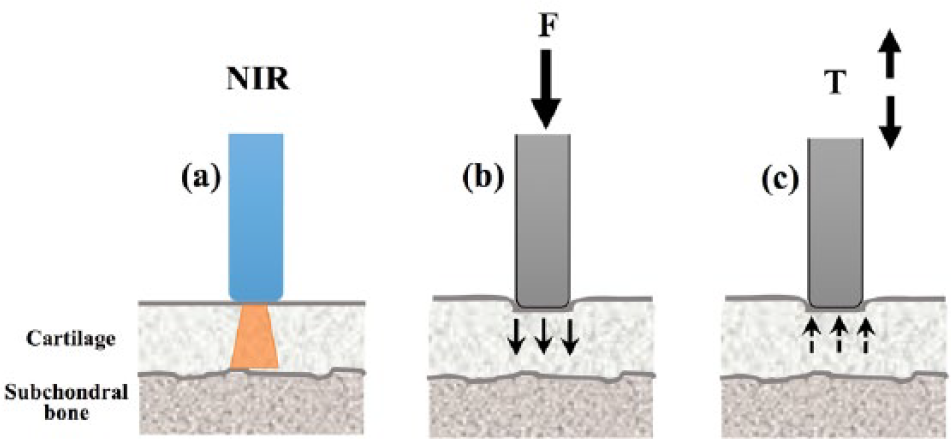
Experimental protocol adopted in this study. Near-infrared spectral data are obtained from osteochondral samples (
Near-Infrared Spectroscopy
Diffuse reflectance NIR spectroscopy was performed as part of a previously published study, 11 in the full NIR range (12,500–4,000 cm−1 wavenumber; 800–2,500 nm wavelength), using a Bruker MPA FT (Fourier Transform) NIR spectrometer (Bruker Optics, Ettingen, Germany). The instrument was fitted with a 5 mm diameter window fiber-optic probe consisting of 50 optical fiber bundles (diameter = 600 µm per strand, 25 transmitting and 25 receiving fibers). Instrument trigger and data acquisition was controlled via OPUS 6.5 software (Bruker Optics). Precautions from preliminary experiments and previous studies11,16 were observed to ensure accuracy and repeatability of the acquired spectral data. Prior to sample scanning, a reference spectrum was taken from a Spectralon reflectance standard—SRS-99 (Labsphere, Inc., North Sutton, NH). The probe was lowered (until it touched the specimen surface) and firmly locked in position. Absorption spectrum was obtained over the full range of the NIR spectrum at 16 cm−1 resolution, with each spectrum averaged over 64 scans.
Mechanical Indentation and Instantaneous Recovery Parameter
Mechanical testing of the samples was performed as part of a previously published study. 11 In summary, each cartilage-on-bone specimen was firmly secured in a purpose-built sample holder, with the bone resting on the base and the specimen held on all 4 sides with flat-ended screws. The specimen was then mounted for mechanical testing on a material testing device fitted with a 2 kN load cell (Instron Model 5944, Instron Pty Ltd, Victoria, Australia; 0.5 mN sensitivity). Each specimen was compressed to a displacement equivalent to 30% strain relative to the intrinsic thickness at a loading rate of 0.005/s. A previous study showed that loading to 30% strain does not damage the tissue. 35 The load was centrally applied to the cartilage surface via a 3 mm plane-ended polished stainless steel cylindrical indenter.
After reaching the nominated deformation, the load was immediately reduced to a relatively low value (tare load = 0.35 N), while maintaining indenter contact with the tissue and allowing the unloaded cartilage to instantaneously recover against the indenter. This is so that the osmotic mechanism and its associated swelling pressure exhibited by cartilage may be observed.36,37 In this mode, the indenter serves to track the recovery of the unloaded tissue, and this information is logged. Of interest in this study is the first 3 seconds after unloading in order to capture the transient instantaneous response of the tissue. The loading and recovery profile ( Fig. 2 ) for each sample was obtained, and the instantaneous elastic rebound parameter, denoted by ER, was calculated as the area under the instantaneous recovery curve (a strain energy-type parameter) for all the samples.
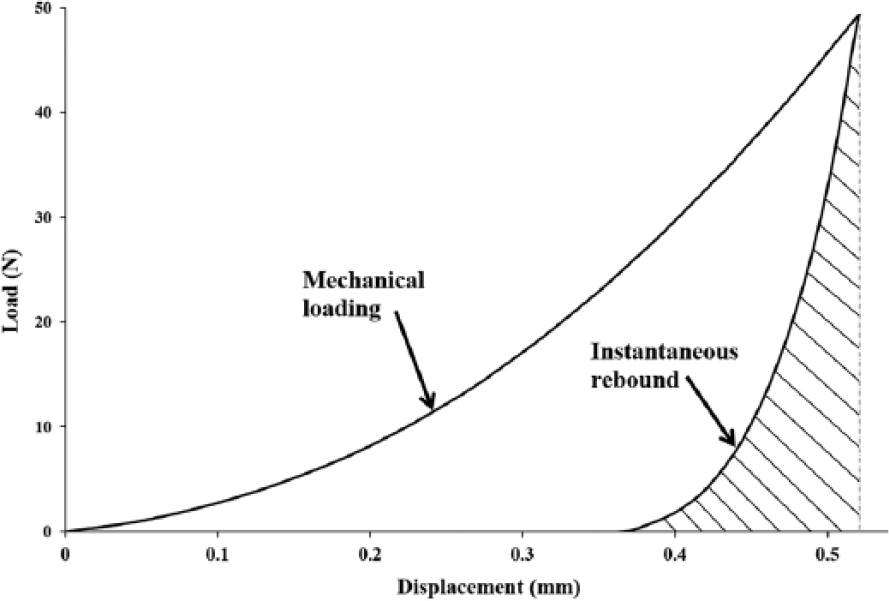
Typical load-displacement profile showing compression and recovery behavior of articular cartilage. The instantaneous recovery parameter is calculated as the area under the shaded region on the curve.
After testing, the specimens were fully unloaded and allowed to recover for 2 hours in 0.15 M saline to ensure that full thickness has been regained before proceeding with further tests. It is worth noting here that we have not directly measured the osmotic pressure; however, it is arguable that this would be a significant component of the force detected by the indenter as it tracks the recovering cartilage.
Artificial Degeneration: Proteoglycan Depletion
Alteration and evaluation of the PG content of the samples were performed as part of a previously published study. 11 Briefly, after initial spectroscopic and mechanical indentation/recovery testing, each normal sample was incubated in 1 mg/mL of trypsin (T4667, Sigma Aldrich, Sydney, Australia) in 0.15 M phosphate-buffered saline solution at 37°C to deplete PGs. This was to simulate changes in cartilage ECM associated with early-stage osteoarthritic degeneration. The PG depletion program (described diagrammatically in Fig. 3 ) was performed for 4 hours, with NIR spectroscopic probing and biomechanical tests repeated at intervals of 1 hour. Osteochondral sections were extracted from the samples for PG content analysis at each time interval ( Fig. 3 ). Each normal sample was subjected to this protocol, yielding a total of n = 60 test specimens (normal + each stage of PG depletion). The gradual enzymatic digestion of PGs from cartilage surface to bone closely resembles the pattern of PG loss observed in the initial stages of osteoarthritis. 38
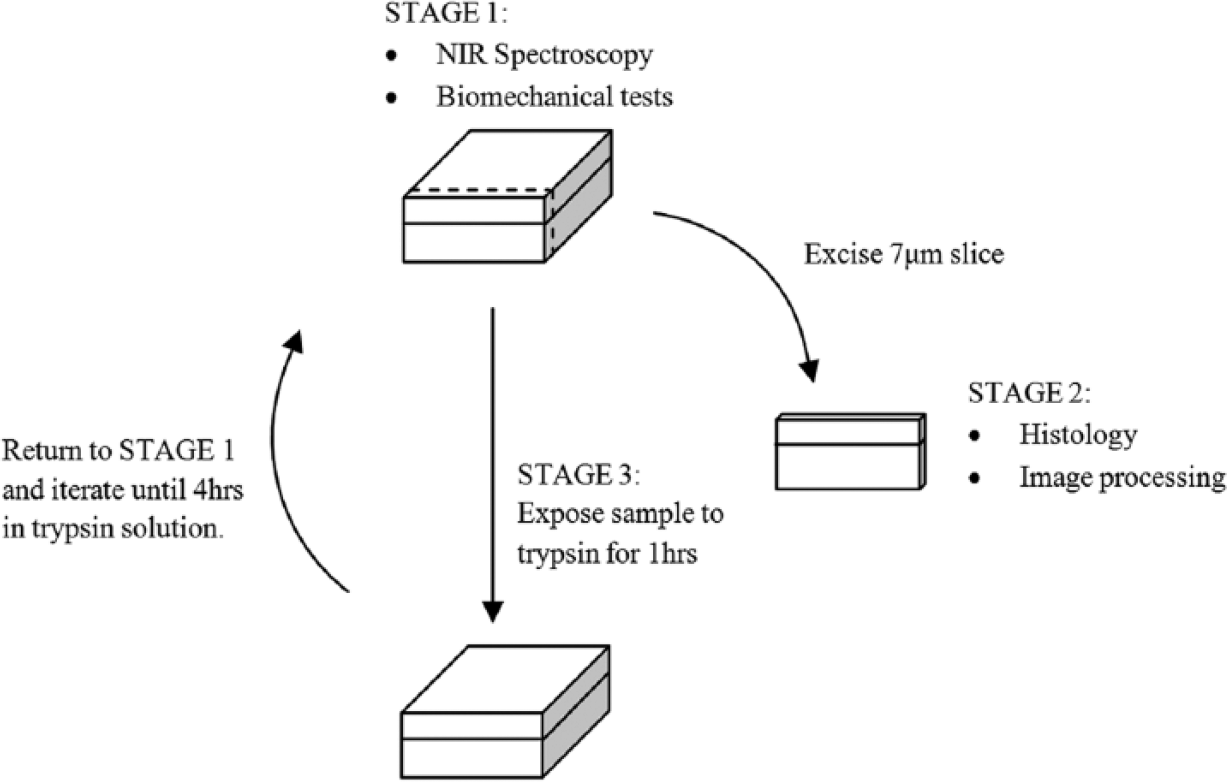
Protocol for gradual and controlled depletion of proteoglycans from articular cartilage samples.
Image Analysis and Proteoglycan Content Approximation
In order to quantitatively assess the PG depletion over time, 7 µm osteochondral sections were extracted at each interval ( Fig. 3 ), prepared and stained with Safranin-O, using a previously published staining regime. 39 Optical absorbance profile provided visualization and indication of the approximate PG content and distribution. This method is based on the stoichiometric binding of Safranin-O to chondroitin 6-sulfate and keratan sulfate that has previously been validated by biochemical comparison in solution 40 and in cartilage tissue sections.41,42 Linearity of this relationship between dye and PG was maintained through alcohol fixation to transform Safranin-O to orthochromatic form.40,41 This was followed by absorbance profiling under monochromatic light source using a Nikon Labo-Phot light microscope to obtain micrographic images of each section before and after staining. A validated image analysis approach 43 was employed to determine the approximate PG content using custom-written program in ImageJ (version 1.45d, Wayne Rasband, National Institute of Health, Bethesda, MD). This was calculated as the area under the Safranin-O absorbance-depth profile, which shows the PG concentration and distribution. 43
Statistical Evaluation and Multivariate Analysis
Statistical analysis for the recovery parameter was performed on Graphpad Prism statistical software (version 5.0, GraphPad Software Inc., La Jolla, CA). The data were expressed as mean ± SEM (standard error of mean) and were compared using one-way ANOVA, a P-value of less than 0.05 was considered to be statistically significant. The normal distribution assumption was tested and passed for all groups (normal and degenerated) prior to analysis using the D’Agostino and Pearson omnibus normality test.
NIR spectral data (predictor variables) were correlated with the recovery parameter ER (response variables) using the single y-variable partial least squares (PLS1) regression algorithm, 44 adopted in our previous study. 11 This multivariate technique uses factors extracted from the transformed predictor and response variables to develop multivariate regression models for correlating the predictor to the response variable. 44 The developed (calibration) models are then validated to determine their performance in predicting the response variables of new samples. To optimize the multivariate model, preprocessing algorithms were employed to correct spectral nonlinearities and baseline offsets resulting from light scattering variations in reflectance spectroscopy. 45 All spectral analyses were performed using OPUS Quant2 software (Bruker Optics).
Analyses and Results
Proteoglycan Content Approximation
The Safranin-O absorbance-depth profiles of normal and progressively degraded cartilage samples, obtained from image analysis of the histological images, show distinct and gradual loss of PGs from surface to bone ( Fig. 4 ). The area under the absorbance-depth profiles represents an approximate measure of the proteoglycan content in the tissue.
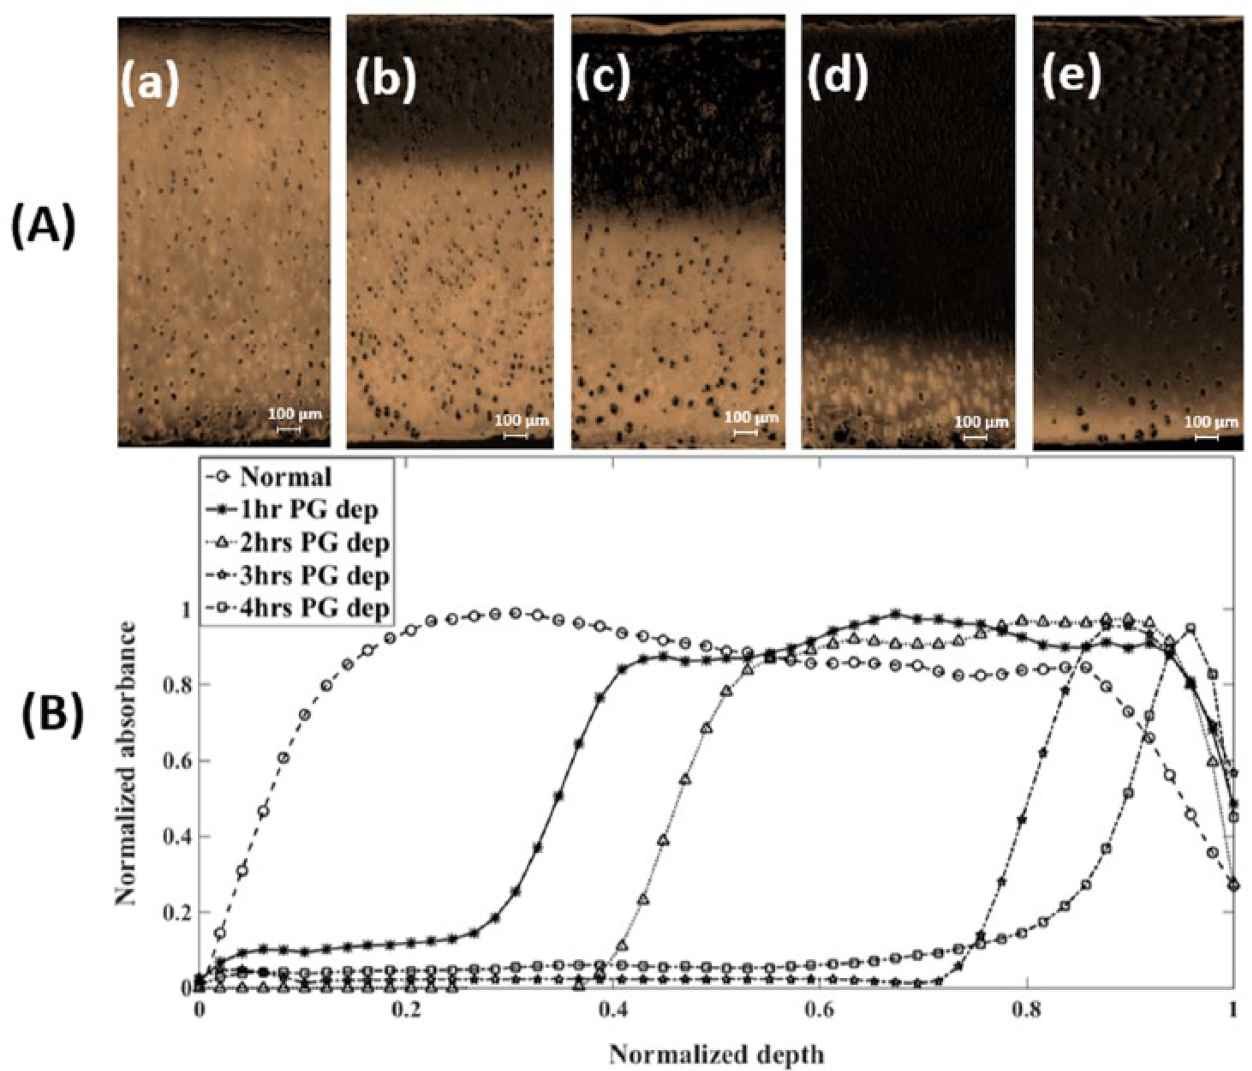
Typical Safranin-O stained histological sections (
The change in thickness (mean ± SEM) between normal and PG depleted samples for the different levels of PG depletion are 19.4 ± 15.4 µm for 1 hour, 13 ± 10 µm for 2 hours, 33.6 ± 19.7 µm for 3 hours, and 57.6 ± 18.4 µm for 4 hours of depletion.
Characterization of Cartilage Function with Recovery Parameter, ER
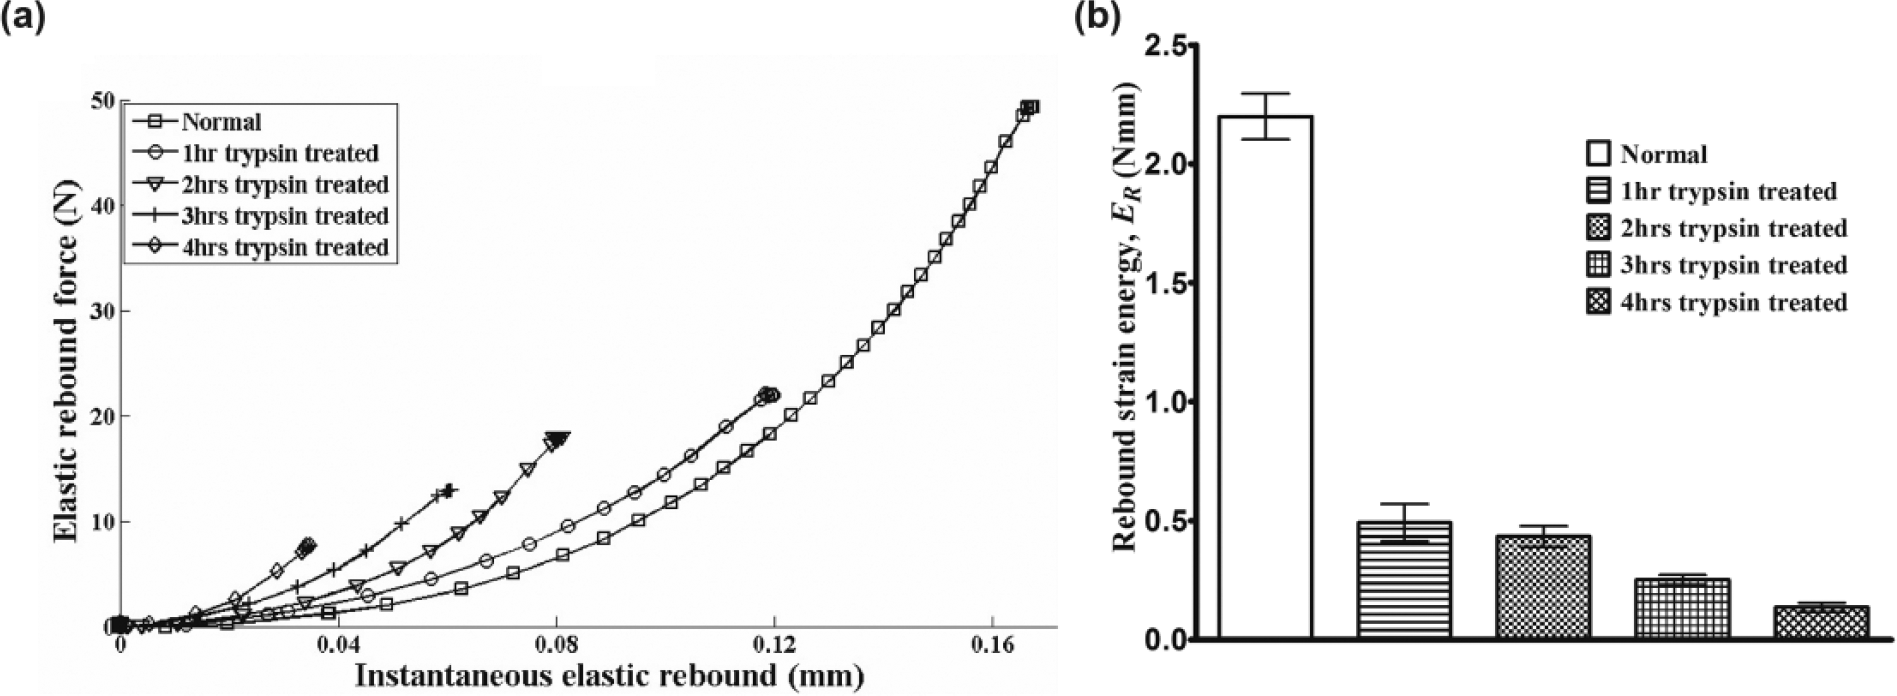
The data presented in this study are based on new insight and further analyses of the samples presented in our previous study, 11 with focus on the transient instantaneous response of cartilage, as pointed out earlier. Representative experimental curves for the instantaneous recovery characteristic for normal and different levels of PG-depleted cartilage samples, extracted from the recovery portion of the load-displacement curve ( Fig. 2 ), are presented in Figure 5a . The recovery-based parameter, the elastic rebound ER, was calculated as the area under the instantaneous recovery curve, a measure of the elastic strain energy released in this early recovery stage. The curves can be observed to follow the characteristic trend of PG loss in the samples (indicated by the amount of trypsin digestion time), suggesting a relationship between the recovery response of cartilage and its matrix PG content ( Fig. 5a and b ).
(
Initial PG loss (after 1 hour incubation in trypsin), which simulates PG loss in the superficial zone of the matrix, resulted in significant reduction (approximately 77%) in ER and hence the recovery response of the tissue. Subsequent enzymatic treatment yielded only small changes in ER until severe PG loss between 3 and 4 hours (approximately 91%) of incubation.
Spectral Preprocessing, PLS1 Calibration, and Validation
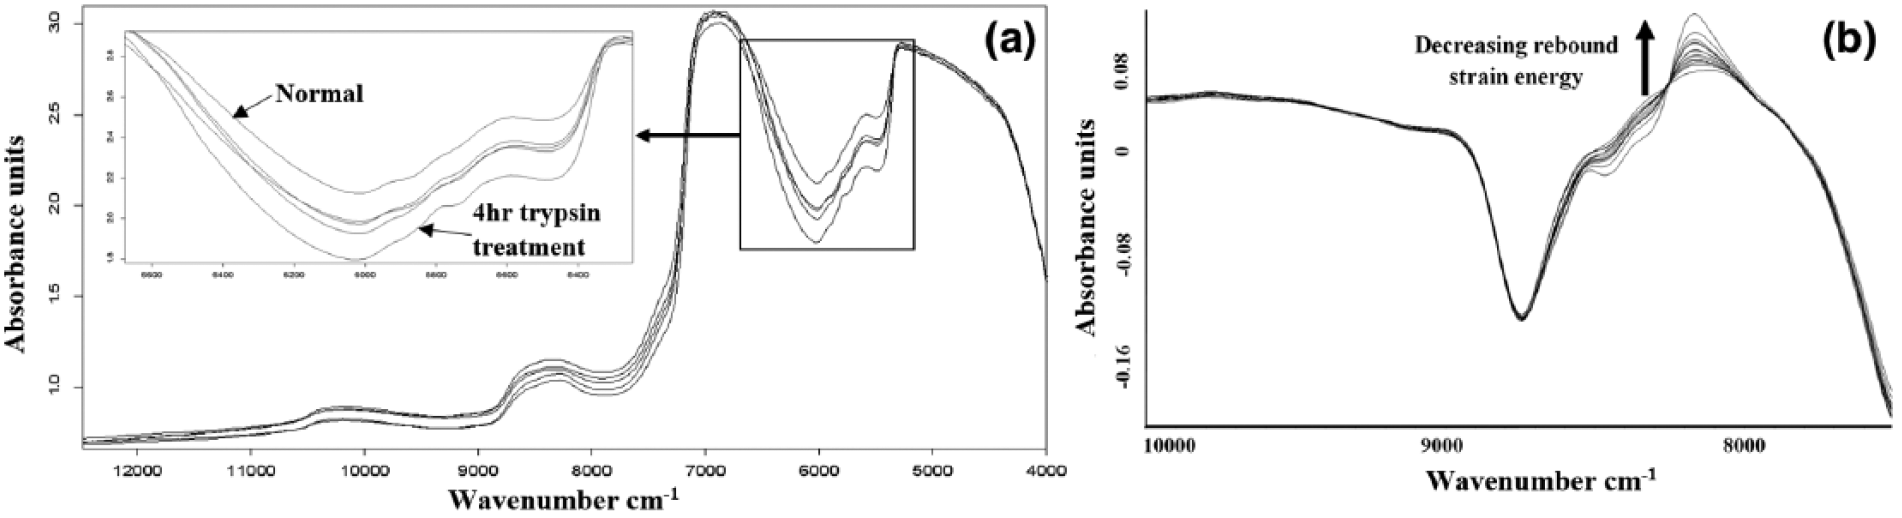
Representative NIR spectra of normal and different levels of PG-depleted cartilage samples are presented in Figure 6a . Prior to analyses, the proposed elastic rebound parameter (response variable) and corresponding NIR spectral data (predictor variables) for each sample in the normal and degenerated states were collected and formatted as specified in the software suite. Using data from different NIR spectral regions, PLS multivariate analysis was performed to model the relationship between articular cartilage absorption spectra and its recovery parameter, ER. Leave-one-out (LOO) cross-validation method was used to estimate prediction error and coefficient of determination for model selection, and a maximum of 10 PLS components was tested. In this validation method, the left out sample is predicted with the model developed using the remaining samples in the calibration set; this procedure is repeated with each sample being left out of the calibration set. The correlation coefficients between the predicted and measured values are then calculated.
(
Prior to multivariate analysis, spectral preprocessing and transformation algorithms including multiplicative scatter correction (MSC), straight-line subtraction (SLS), standard normal variate (SNV), derivative preprocessing, and different combination of these algorithms were applied in order to improve multivariate correlation. The combination of MSC with first derivative preprocessing was found to be optimal for pretreating the predictor variables ( Fig. 6b ).
To avoid under- or overfitting, optimal model selection was based on a balance between the highest coefficient of determination (R2), lowest root mean square error of cross-validation (RMSECV), and minimum PLS factor. The best model was obtained with spectral data in the combined regions 5,450 to 6,100 cm−1 and 7,500 to 12,500 cm−1, and yielded the lowest error of cross-validation ( Table 1 ). The performance of this model is presented in the calibration and validation plots of Figure 7 .
PLS Correlation of Data from Different Regions of Articular Cartilage NIR Spectra with Its Recovery Parameter.
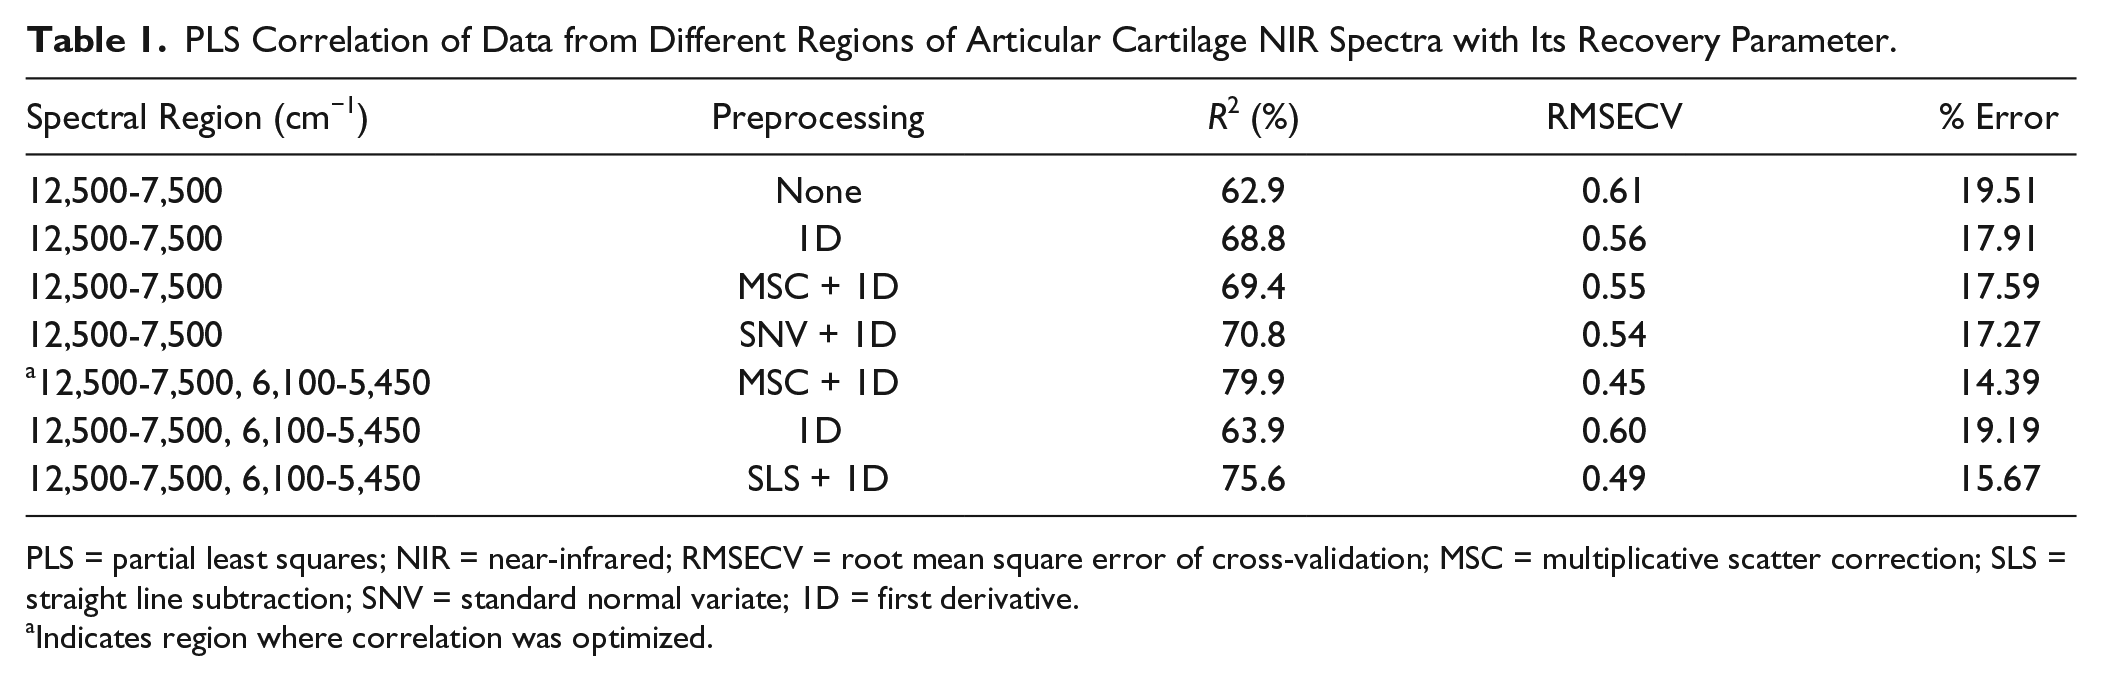
PLS = partial least squares; NIR = near-infrared; RMSECV = root mean square error of cross-validation; MSC = multiplicative scatter correction; SLS = straight line subtraction; SNV = standard normal variate; 1D = first derivative.
Indicates region where correlation was optimized.
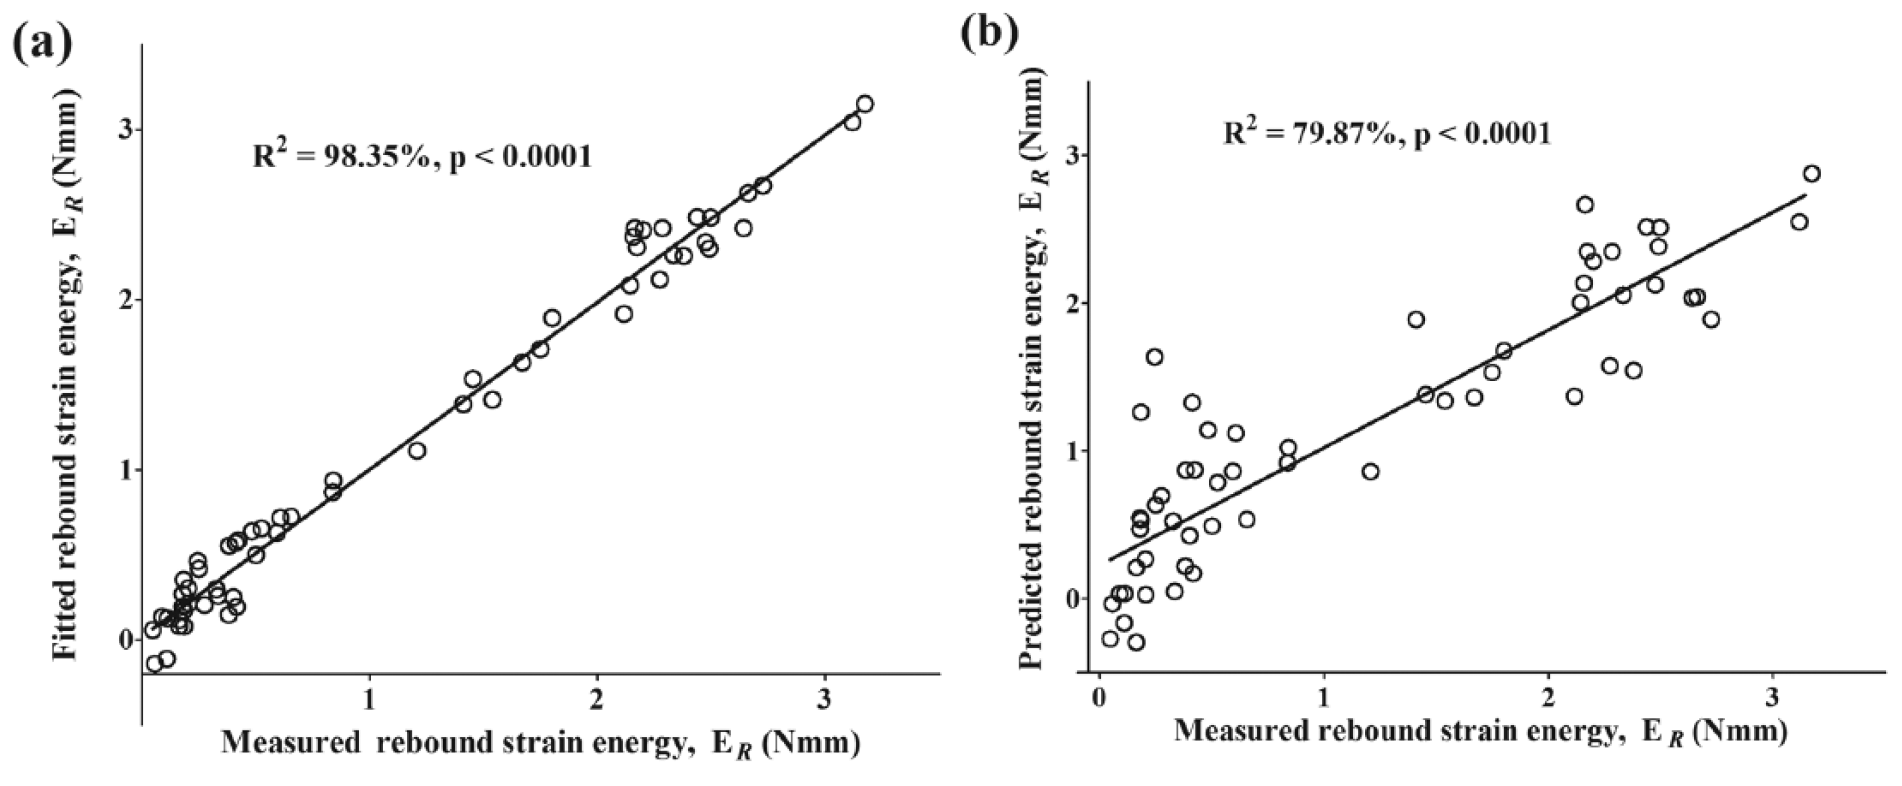
Relationship between NIR spectra and instantaneous cartilage recovery, ER, for normal and artificially degraded cartilage samples. (
Discussion
In this study, we investigated the potential of evaluating the functional integrity and health of articular cartilage from its recovery response via the parameter ER, a strain energy-type parameter. We also investigated the correlation of this parameter with the NIR absorption spectrum of articular cartilage. ER is based on the early-stage recovery response of articular cartilage, and we argue that it is a “lumped” parameter that in effect comprises mechanical, structural, and physicochemical (osmotic) characteristics of the matrix. The parameter is sensitive to changes in the matrix PG content and is capable of distinguishing normal intact from (artificially) degenerated cartilage. Although ER bears slight similarity to the previously published SEP parameter proposed by Brown et al., 10 however, unlike SEP, which is a strain-only parameter, ER is based on the strain energy released/dissipated during unloading of articular cartilage. In addition, the experimental approach for obtaining the instantaneous recovery in this study was different from that adopted by Brown et al. 10
The recovery parameter ER is indicative of how much stored strain energy is released from the tissue as it recovers from compressive loading, similar to the strain energy released by an unloaded elastic spring. Under compression, water is lost from the region under load as the applied force (together with internal restraining forces) exceeds the intrinsic swelling pressure of the tissue. As deformation progresses, the applied stress is gradually transferred from the fluid component to the stiffening and more concentrated solid structure, leading to increased swelling pressure and fixed charge density (FCD), eventually reaching another equilibrium.46,47 This swelling pressure is a function of the amount of strain energy stored in the collagen-proteoglycan entrapment system, and a measure of the integrity of the matrix. Thus, ER (estimated as the area under the recovery curve after release of the stored strain energy) is related to the physicochemical condition (FCD) and associated osmotic swelling potential, which are major determinants of the tissue’s structural efficacy. Furthermore, articular cartilage resistance to compression, and thus its recovery capacity, is a function of the FCD of its constrained PGs.48-50 Hence, the recovery of articular cartilage is primarily influenced by the matrix PGs, and possibly to a lesser degree by the superficial collagen integrity.
The systematic decrease in the ER of samples with progressive (enzymatic) matrix alteration suggests a good relationship with the osmotic-related property of the tissue. Since cartilage exhibits loss of PGs during degeneration, leading to associated loss of swelling pressure and thus compromised recovery response, the proposed parameter could be used as proxy indicator for cartilage health. This could provide a useful technique for characterizing articular cartilage in the early stages of degeneration where matrix alteration is often characterized by loss of superficial cartilage PGs. Given the gradual loss of PGs from the surface to the bone, the exponential relationship between the recovery parameter and PG content in the samples ( Fig. 5b ) suggests that the integrity of articular cartilage superficial zone is critical for its effective recovery after unloading. Although the confining collagen meshwork plays a role in the functional response of articular cartilage, the effect of altering this component was not considered in this study. Further investigations will be required to study the effect of multicomponent alteration on the recovery response of cartilage.
The method employed to obtain ER requires classical mechanical compression protocol in order to generate sufficient strain energy in the tissue’s matrix for release during unloading,6,7 requiring a significant amount of time for the protocol. The relationship between this parameter and the NIR optical response of the matrix ( Fig. 7 ) allows the inherent time commitment and delay of this traditional method to be circumvented. The significance of this correlation is that ER, and thus the functional and structural integrity of articular cartilage, could be evaluated in real time, using NIR spectroscopy, with potential for in vivo assessment of cartilage during surgery. Nevertheless, it is worth noting that PG loss in the cartilage matrix could result in some collateral effects, such as swelling, increased water content, and even superficial collagen damage in the early stages of degeneration. Thus, the NIR spectral response also incorporate these simultaneous changes in both organic and fluid content of the tissue and could provide information on the holistic health of the tissue.
Correlation between the NIR absorption spectra and rebound parameter ( Fig. 7 ) was optimal using data from a combination of 2 spectral regions within the NIR range. The first region (5,450–6,100 cm−1) is due to the first overtone CH2 and SH stretch vibrations at 5,623 cm−1 associated with the matrix PGs, 51 although the peak is slightly shifted due to interaction with water. The second region (7,500-12,500 cm−1) is characterized by both second and third overtone vibrations mainly arising from CH n and RNH2 bond vibrations. These spectral absorptions are indicative of the solid components of cartilage, that is, the combined effect of matrix collagen and PGs. The application of MSC preprocessing and first derivative pretreatment prior to multivariate analysis for scatter correction and baseline elimination significantly improved the correlation between the spectral data and recovery parameter (Table 1). MSC eliminates light scatter effects in diffuse reflectance spectroscopy due to factors such as varying particle sizes, 45 which in this case could be associated with depth-dependent variation of matrix collagen size and orientation. Derivative preprocessing corrects for baseline shifts and offsets, 52 which could also be a consequence of differences in matrix collagen size and orientation, and also provides spectral transformation and peak enhancement.
The NIR spectrum of articular cartilage matrix embeds latent information on its physical, 16 structural, and morphological properties.15,18 In addition, the penetrating property of light in the NIR spectral range into biological tissues29,33 makes this optical technique suitable for full-thickness evaluation of cartilage material integrity in its physiological state. Furthermore, the capacity of NIR to monitor key chemical and morphological properties of organic materials 51 presents a unique potential to quantify changes in cartilage functional properties via relationship with parameters such as ER. Although the NIR radiation was applied and the spectral data acquired via the cartilage surface, there may be contributions from the subchondral bone. 53 Nevertheless, it can be expected that the overlying cartilage would contribute significantly to the resulting spectrum due to large amount of water in the tissue.
The use of enzymatic degradation in this study to deplete PGs was intentional because the level of matrix degeneration could be controlled and quantified. Thus, the relationship between cartilage recovery and the tissue condition could be closely investigated; naturally degenerated (osteoarthritic) samples often have multicomponent degeneration, and at different degrees. However, a limitation of this approach of modeling cartilage degeneration by enzymatic treatment is that PG loss may also be accompanied by some collateral damage to the collagen fibrils. In addition, the effect of collagen network, and combined alteration of the matrix ECM (collagen and PGs), on the recovery response of cartilage was not investigated in the current study. Thus, this warrants further studies in order to fully understand the mechanisms involved in the recovery of articular cartilage. Nevertheless, this does not diminish the outcome of the current study, which shows the important role matrix PGs play on the recovery response of articular cartilage. Finally, the sensitivity of the recovery parameter was observed to decrease in cases of extreme degeneration ( Fig. 5b ); however, we believe this is not a critical issue as cartilage identified as extremely degenerated would usually be removed by the surgeon. Nonetheless, this can be addressed by using this parameter in tandem with other parameters, such as reswelling. 11
In conclusion, the recovery response of articular cartilage (quantified via the elastic rebound parameter ER) could be used as an indicator of its integrity and functional health, and this characteristic of the tissue correlates significantly with its optical response in the NIR spectral range. This presents a potential method for clinical and laboratory assessment of cartilage conditions and provides an approach that could enhance the diagnostic accuracy of conventional arthroscopy.
Footnotes
Acknowledgments and Funding
The author(s) received no financial support for the research, authorship, and/or publication of this article.
Declaration of Conflicting Interests
The author(s) declared no potential conflicts of interest with respect to the research, authorship, and/or publication of this article.
Ethical Approval
Ethical approval was not sought for the present study because the bovine joint samples were obtained from a local abattoir from animals slaughtered for commercial purposes.
Animal Welfare
Guidelines for humane animal treatment did not apply to the present study because the bovine joint samples were obtained from a local abattoir from animals slaughtered for commercial purposes.