
Abstract
Objective
To investigate the influences of the diffusion gradient directions (angular resolution) and the strength of the diffusion gradient (b value) on diffusion tensor imaging (DTI) metrics and tractography of various connective tissues in knee joint.
Design
Two rat knee joints were scanned on a preclinical 9.4-T system using a 3-dimensional diffusion-weighted spin echo pulse sequence. One protocol with b value of 500, 1500, and 2500 s/mm2 were acquired separately using 43 diffusion gradient directions. The other protocol with b value of 1000 s/mm2 was performed using 147 diffusion gradient directions. The in-plane resolution was 45 µm isotropic. Fractional anisotropy (FA) and mean diffusivity (MD) were compared at different angular resolution. Tractography was quantitatively evaluated at different b values and angular resolutions in cartilage, ligament, meniscus, and growth plate.
Results
The ligament showed higher FA value compared with growth plate and cartilage. The FA values were largely overestimated at the angular resolution of 6. Compared with FA, MD showed less sensitivity to the angular resolution. The fiber tracking was failed at low angular resolution (6 diffusion gradient directions) or high b value (2500 s/mm2). The quantitative measurements of tract length and track volume were strongly dependent on angular resolution and b value.
Conclusions
To obtain consistent DTI outputs and tractography in knee joint, the scan may require a proper b value (ranging from 500 to 1500 s/mm2) and sufficient angular resolution (>14) with signal-to-noise ratio >10.
Introduction
The knee joint is the largest and one of the most complex joints in human body. 1 It includes various types of tissues, such as articular cartilage, meniscus, ligament, muscle, tendon, and so on. 2 Magnetic resonance imaging (MRI) provides excellent soft tissue contrast and plays a vital role in evaluation of knee joint anatomy and pathology.3,4 Quantitative MRI has been used to detect the composition changes (collagen and proteoglycan) prior to the morphological degradation of cartilage.5-9 The degradative changes of collagen accompanying the loss of proteoglycan at the cartilage surface have been related to the early development of osteoarthritis (OA).10-13 To probe the collagen fiber alignment, both T2 relaxation time and quantitative susceptibility mapping (QSM) have been developed due to their high sensitivity to the collagen fiber architecture.14-16 However, accurately estimation of collagen fiber alignment requires physically rotating the specimens for both methodologies, which limits their clinical applications.11,15,17,18
Diffusion tensor imaging (DTI) allows to quantify the water molecular diffusion properties and calculate the orientation of the principal eigenvector. 19 Fiber tractography has opened an entire new window to investigate the anatomical connections in brain, kidney, and spinal cord.20-23 Recently, DTI and tractography have been developed to study the complex collagen fiber structures of connective tissues in knee joint.24,25 Compared with T2 and QSM, DTI estimates the fiber direction by detecting the signal decay at different diffusion gradient directions with no need to physical rotate the specimen or subject.26-30 Diffusion tractography of the anterior cruciate ligament (ACL) graft has been proved to be feasible on clinical 3-T MRI scanners and can provide a reliable estimation of quantitative diffusion indices of the ACL graft. 27 DTI-based tractography of Achilles tendon affords a noninvasive method to detect the tendinopathy-induced changes to microstructure integrity. 31
Although diffusion tractography was successfully performed in some individual regions of knee, investigating the effects of the acquisition parameters for the whole joint are still lack. For DTI scans, both b value and angular resolution (AR) are crucial for the final DTI outputs and tractography results in central nervous system (CNS), the optimization for knee joint has not been explored in detail.32-35 In this study, we systematically investigated the influences of these 2 important experimental factors on the DTI metrics and tractography in knee joint. We aimed to provide a coherent baseline for the different factors that can influence the measurement of DTI in knee joint.
Methods
Specimen Preparation
All animal preparation protocols were approved by the Duke University institutional animal care and use committee (IACUC). Two knee joints were harvested shortly after sacrifice from 2 mature, healthy rats. The specimens were stained by immersion in a phosphate-buffered saline solution of 0.5% Prohance (Bracco Diagnostics Inc., Princeton, NJ) to shorten T1 (to about 110 ms) and reduce scan time. 25
MRI Protocols
The specimens were scanned at 9.4 T (Oxford 8.9-cm vertical bore; Agilent VnmrJ 4.0 imaging console) with maximum gradient strength of 2000 mT/m on each axis. A modified 3-dimensional (3D) Stejskal-Tanner diffusion-weighted spin-echo pulse sequence was used with under sampling the phase dimensions by 4 times, which has been described in detail previously.36,37 The scan parameters: repetition time (TR) = 100 ms, matrix size = 400 × 256 × 256, field of view (FOV) = 18 × 11.52 × 11.52 mm3, with 45 µm in-plane resolution. Two protocols were used in this study to explore the effects of AR (protocol 1) and b value (protocol 2). Protocol 1: a dMRI dataset was acquired with 147 unique diffusion directions and 15 non-diffusion-weighted (b0) images at b value of 1000 s/mm2 (echo time [TE] = 9.1 ms). The scan time was about 73.4 hours. Protocol 2: 3 dMRI datasets were acquired separately with 43 unique diffusion directions and 4 non-diffusion-weighted (b0) images at b value of 500 (TE = 6.5 ms), 1500 (TE = 9.0 ms), and 2500 (TE = 10.5 ms) s/mm2. The scan time at each b value was about 21.3 hours. The readout bandwidth was 62.5 kHz. Temperature was monitored throughout all the scans and the fluctuation was less than 1 °C. All the results related to AR were derived from protocol 1 ( Figs. 1 - 7 ); the results related to b value were derived from protocol 2 ( Fig. 8 ).
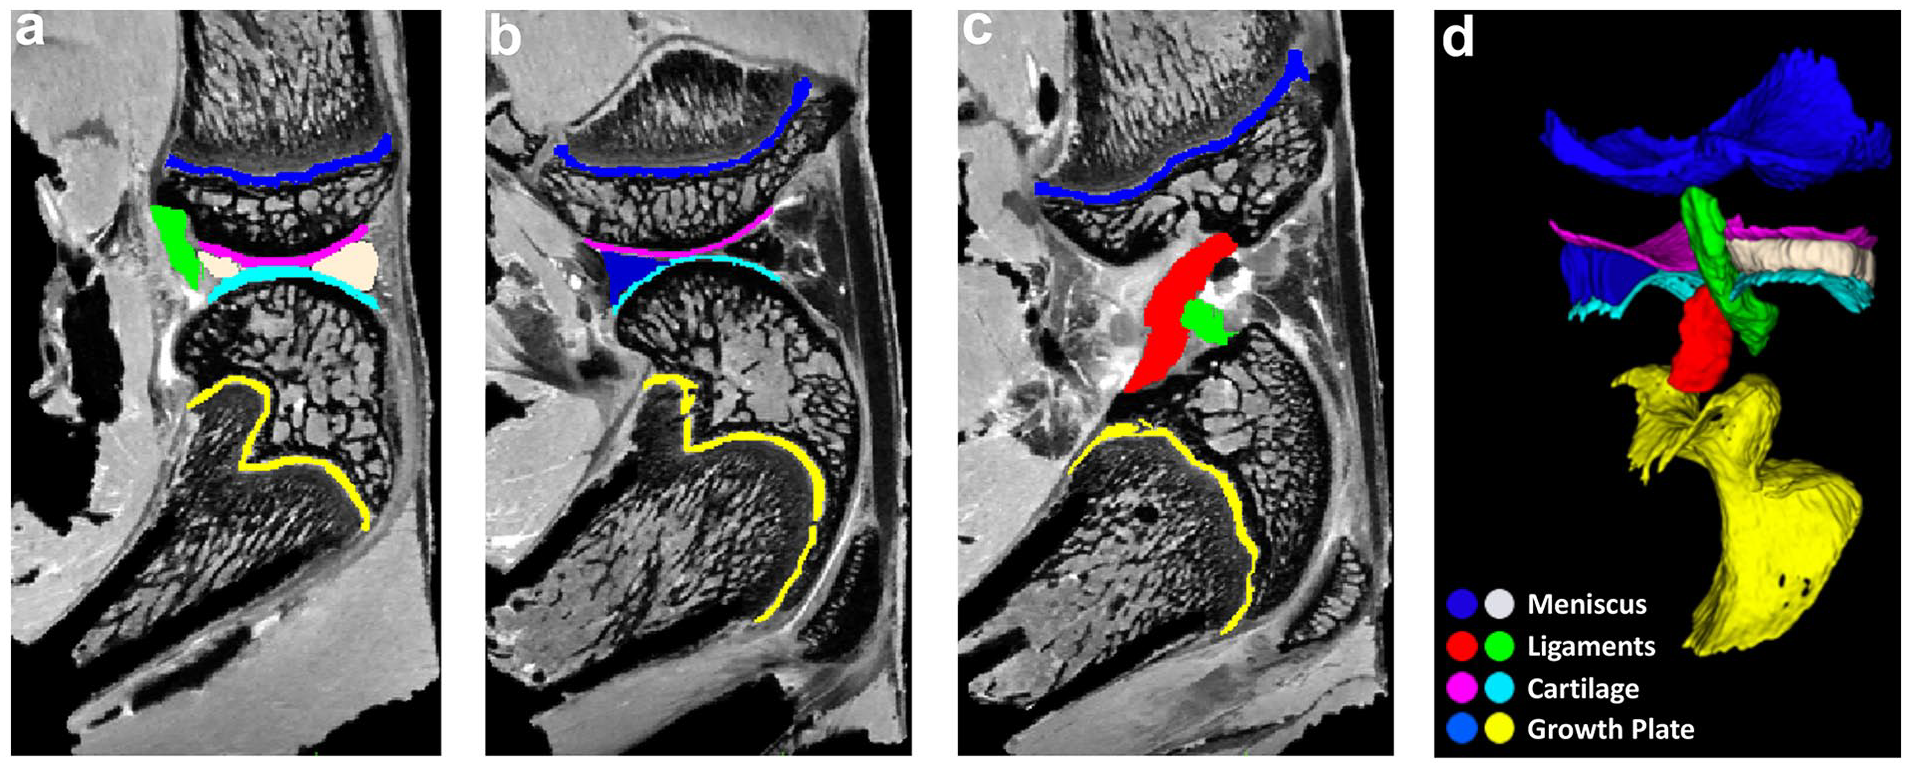
Delineation of different connective tissues, including articular cartilage, meniscus, growth plate, and ligament based on the anatomic b0 images (
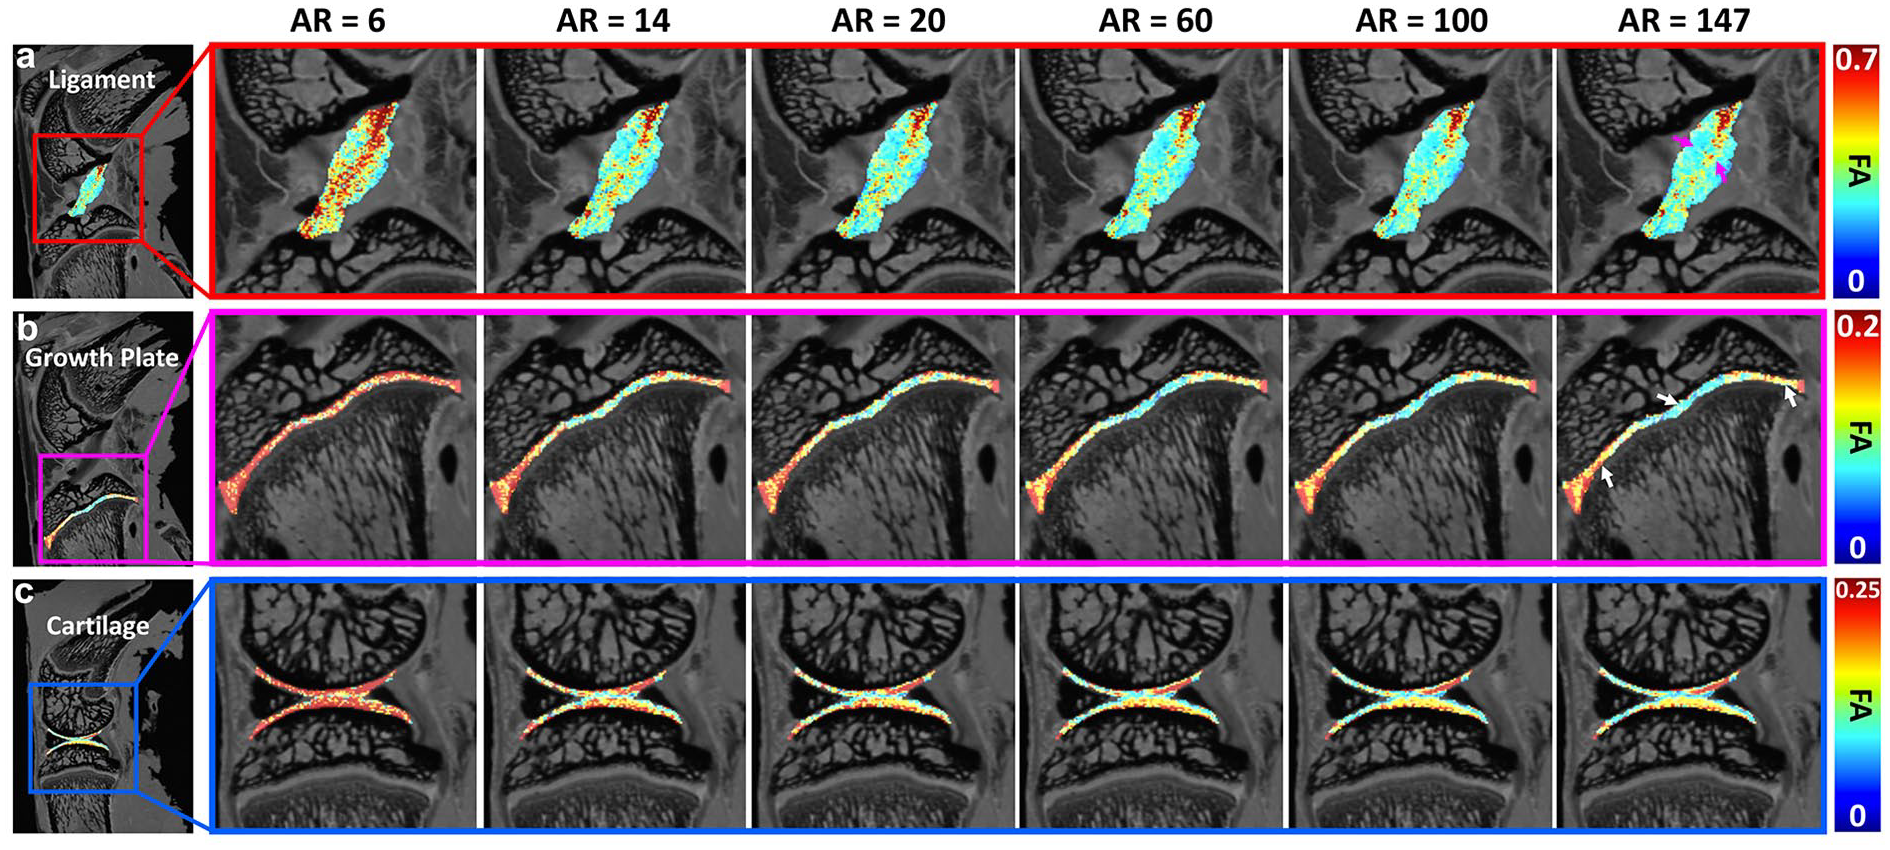
The FA maps of ligament, growth plate, and articular cartilage at different AR. The FA values were largely overestimated with the AR of 6. The values showed visually little differences when the AR is higher than 14. Higher FA values were found in the center part of the ligament (purple arrows). Lower values were found in the center part of growth plate (white arrows). AR, angular resolution; FA, fractional anisotropy.
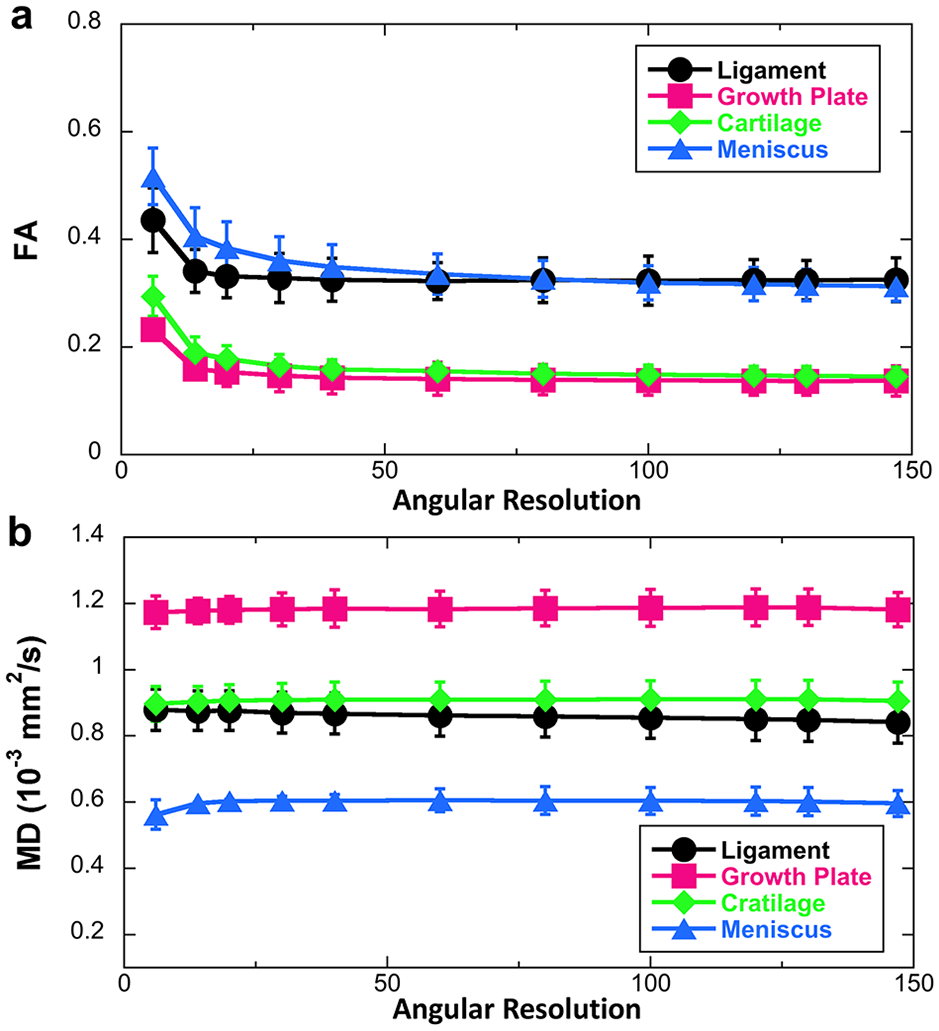
The FA (
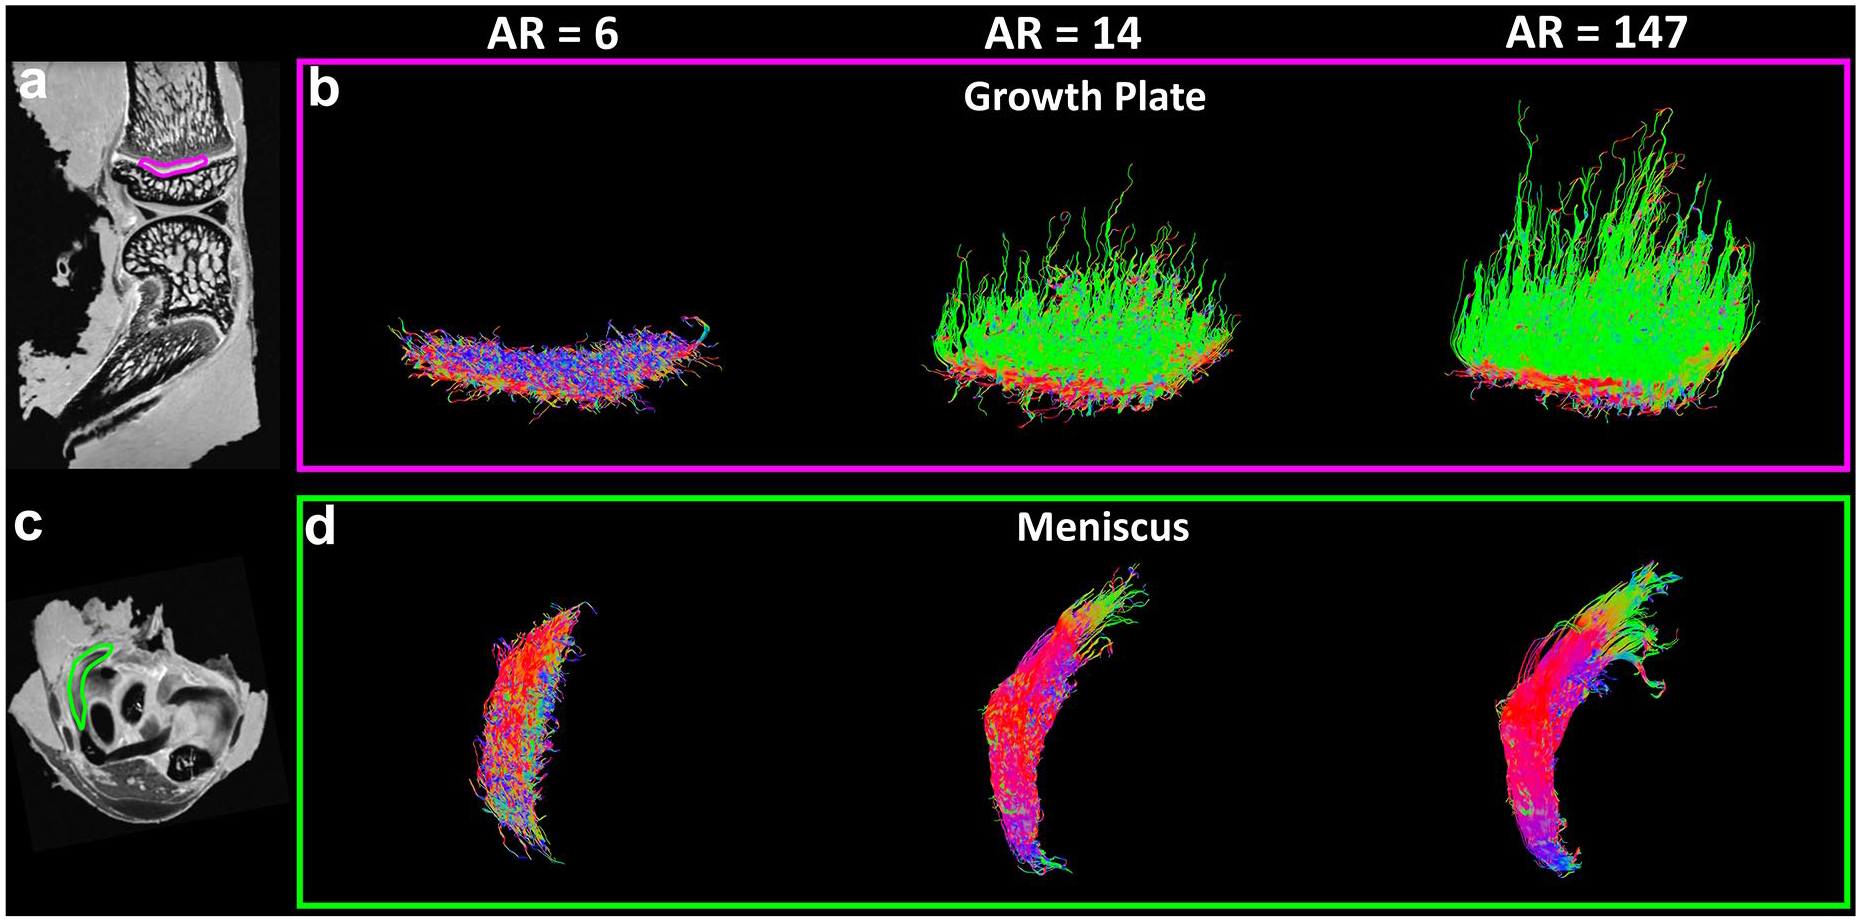
Tractography results in growth plate (
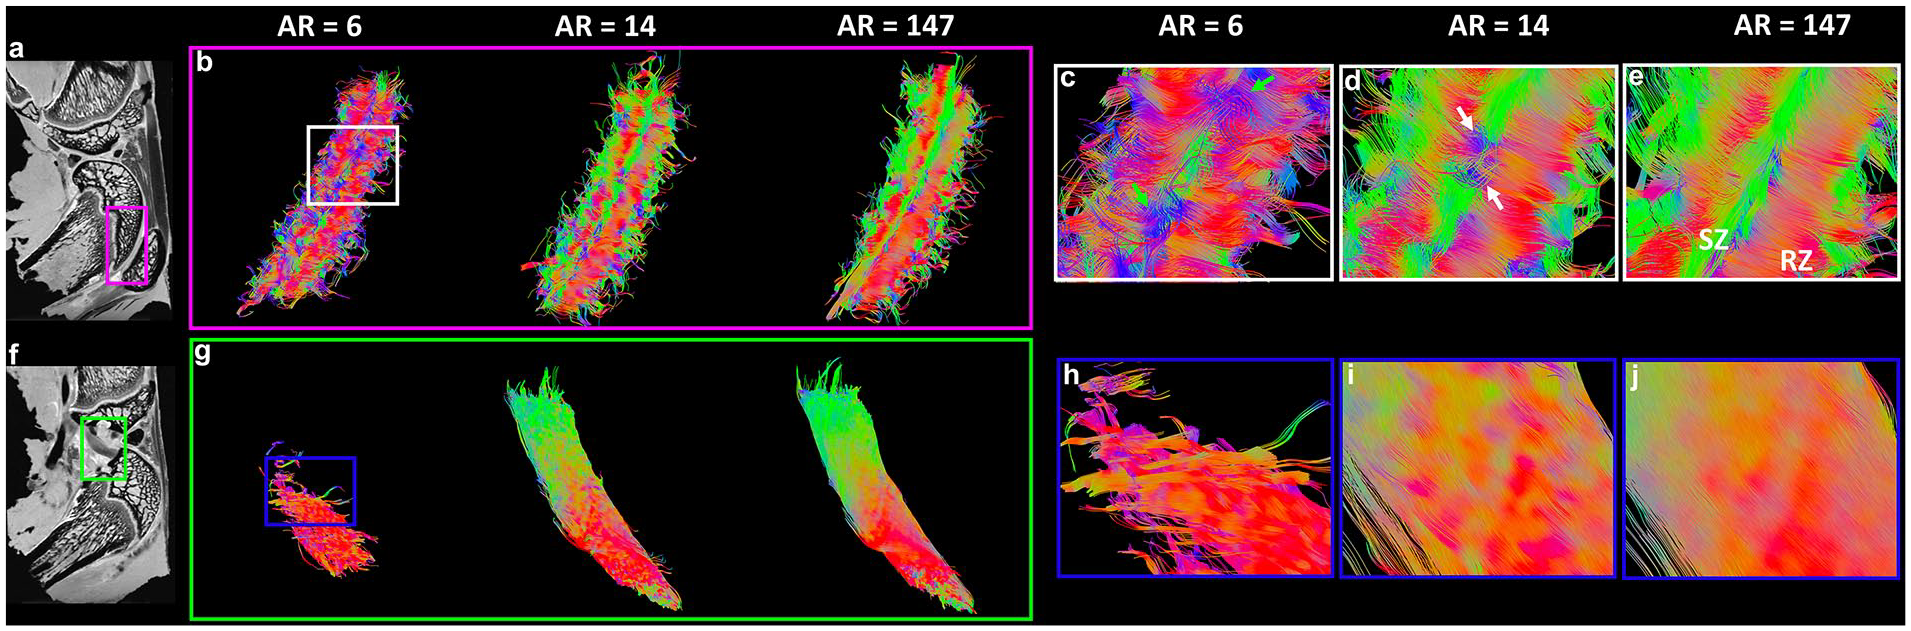
Tractography results in articular cartilage (
The fiber orientation images in articular cartilage (
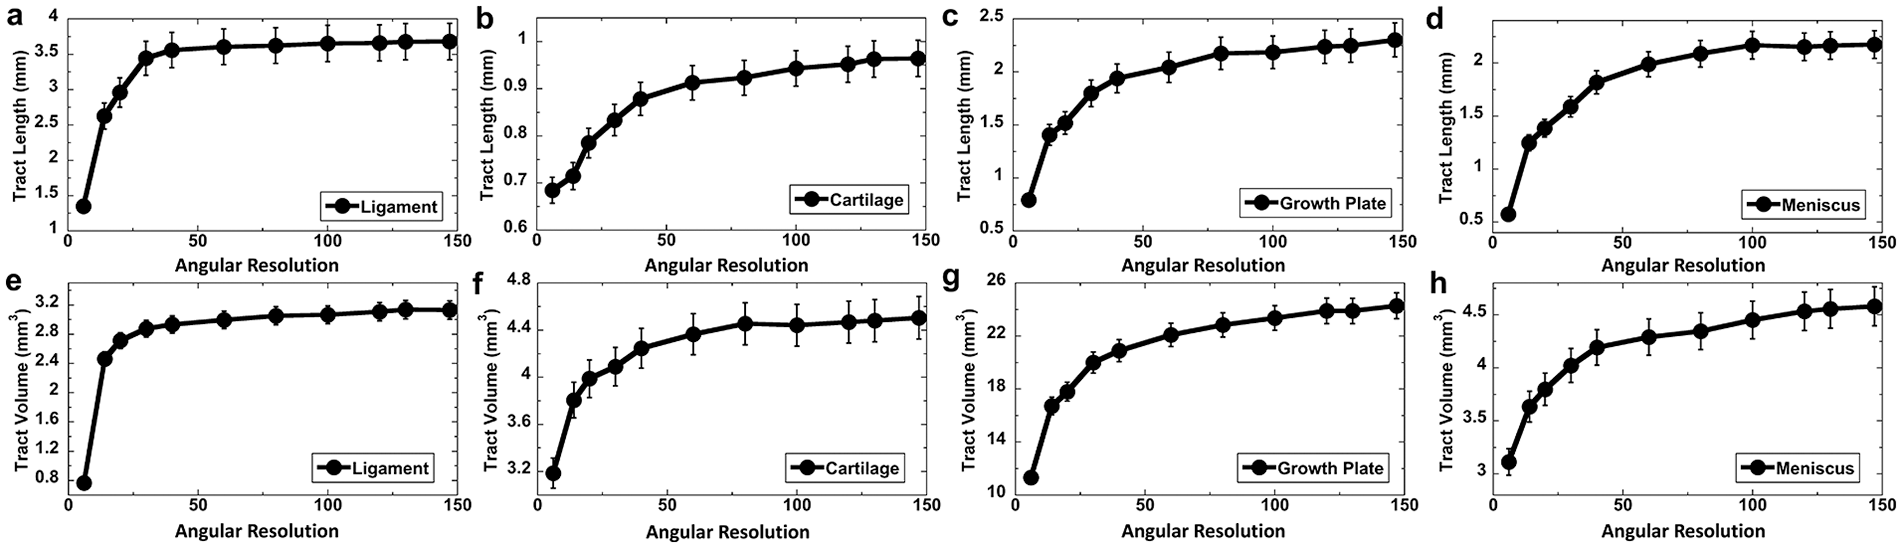
Tract length (
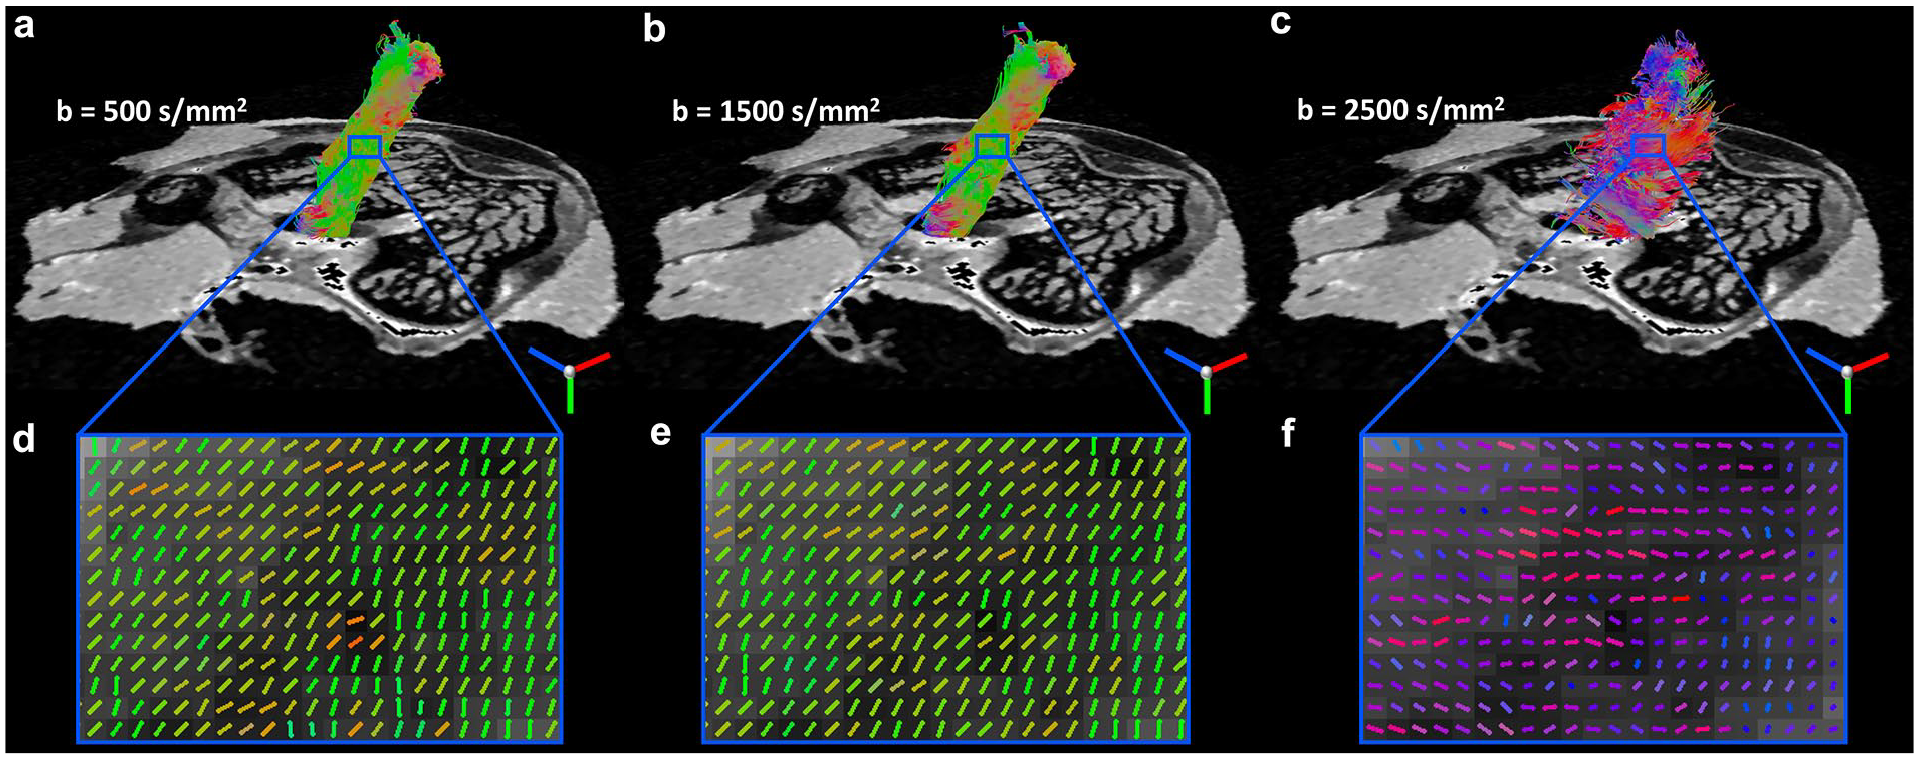
Diffusion tractography of ligament at different b values. The tracts (
Knee Joint Tractography and Diffusion Quantification
All the diffusion-weighted images (DWIs) were registered to the baseline images (b0) to correct the eddy currents. DTI model was used to calculate the tensor and the scalar indices (FA and MD). Regions of interest of various tissues, including articular cartilage, meniscus, growth plate, and ligament were manually drawn in ITK-SNAP software based on the anatomic b0 image ( Fig. 1 ). Deterministic fiber tracking was perfomed on the selected regions of interest. The propagation direction was calculated by applying trilinear interpolation on the fiber orientations provided from neighborhood voxels. The next point was then determined by moving in the propagation direction 0.02 mm. The propagation process was repeated until the tracking trajectory exceeded either a turning angle greater than 45°, or the anisotropy threshold. All fiber tracking operations were preformed using DSI studio toolbox. 38 To investigate the AR effect for DTI metrics and tractography, the 147 diffusion gradient directions dataset as the ground truth was subsampled to 6, 14, 20, 30, 40, 60, 80, 100, 120, 130 diffusion gradient directions datasets.
Results
Figure 1a-c shows the delineation of different connective tissues in the knee joint, including articular cartilage, meniscus, growth plate, and ligament based on the anatomic b0 images. The different connective tissues were segmented by different colors. The high-resolution b0 images exhibited good image contrast to distinguish different tissues in the knee joint. The 3D rendering of the connective tissues was illustrated in Fig. 1d .
To explore the effect of AR, FA maps of ligament, growth plate, and cartilage at different AR are shown in Fig. 2 . The ligament had higher FA value compared with growth plate and cartilage. The FA values were largely overestimated at the AR of 6 (minimum requirement of DTI model) for all 3 types of tissues. The FA maps showed visually little differences when the AR was higher than 14. Higher FA values were found in the center part of the ligament (purple arrows) through all the AR. Inhomogeneous FA values were also observed in growth plate, where lower values were found in the center part of growth plate (white arrows). Compared with FA, MD maps at different AR showed less variation (Supplemental Figure S1).
Figure 3 illustrates both FA ( Fig. 3a ) and MD ( Fig 3b ) profiles of different connective tissues as the function of AR. FA values reached a plateau when the AR is higher than 14 for ligament, growth plate, and cartilage, while higher than 40 for meniscus. Compared with FA, MD showed less sensitivity to the AR. The MD values of ligament, growth plate, and cartilage exhibited consistent results through all the AR. The MD values of meniscus became stable with the AR higher than 6.
Figure 4 shows the tractography results in growth plate ( Fig. 4a and b ) and meniscus ( Fig. 4c and d ) at different AR. Tractography was failed in all the regions with AR = 6. Tractography with higher AR showed more intact and organized fiber tracts. The fiber orientation images of meniscus and growth plate were exhibited in Supplemental Figure S2.
Figure 5 indicates the tractography results in articular cartilage ( Fig. 5a-e ) and ligament ( Fig. 5f-j ) at different AR. Similar to growth plate and meniscus, tractography with higher AR showed better organized fiber tracts. The fiber tracking cannot perform well at the AR of 6 for both cartilage ( Fig. 5c , green arrows) and ligament ( Fig. 5h ). The 3D tractography of ligaments are demonstrated in the Supplemental Video 1. Orthogonal collagen fiber directions were revealed between the superficial zone (SZ, Fig. 5e , green color) and radial zone (RZ, Fig. 5e , red color) in articular cartilage. The transition of the collagen fiber orientation from RZ to SZ were evident in the transition zone (TZ, Supplemental Figure S3). The cartilage tractography images were visually comparable at the AR of 14 and 147 (ground truth). However, subtle differences can be observed in some regions ( Fig. 5d , white arrows).
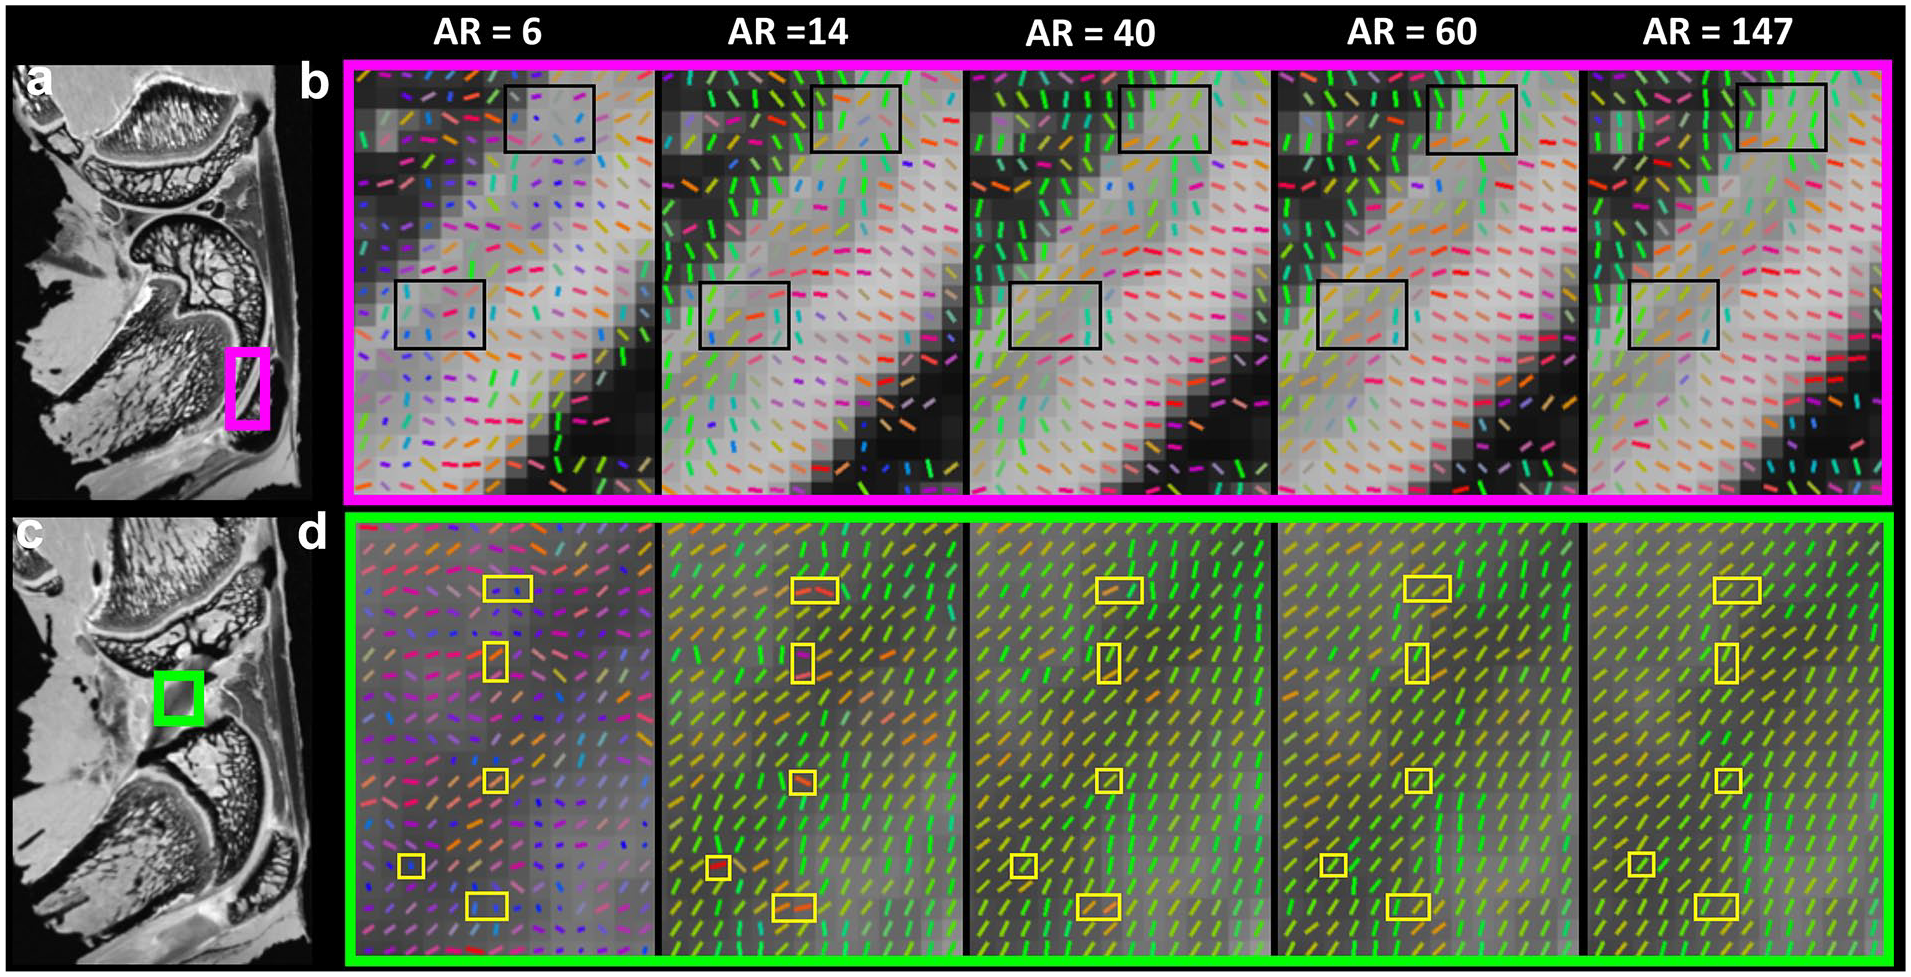
To investigate the tractography difference at different AR, the fiber orientation images in articular cartilage ( Fig. 6a and b ) and ligament ( Fig. 6c and d ) are indicated in Fig. 6 . The fiber orientation could not be accurately estimated with the AR of 6. This situation was largely mitigated when the AR was higher than 40. The fiber orientation differences are highlighted in black (cartilage) and yellow (ligament) boxes. The angular deviations were dramatically reduced when the AR is higher than 14 (Supplemental Figure S4).
Figure 7 shows the quantitative tractography metrics (tract length, Fig. 7a-d and tract volume, Fig. 7e-h ) of different connective tissues in knee joint, including cartilage, growth plate, ligament, and meniscus. Two distinct stages of the profiles were observed for the tract length and volume as a function of the AR. Both tract length and volume rose steeply as the AR reached 40, and then increased mildly when the AR was higher than 40.
To investigate the effect of b value, diffusion tractography of ligament at b value of 500 s/mm2 ( Fig. 8a ), 1500 s/mm2 ( Fig. 8b ), and 2500 s/mm2 ( Fig. 8c ) are illustrated in Fig. 8 , respectively. The tracts and collagen fiber directions were visually comparable at b value of 500 and 1500 s/mm2. The fiber orientation estimation ( Fig. 8f ) and the fiber tractography failed at b value of 2500 s/mm2, probably due to the lower single-to-noise ratio (SNR) (Supplemental Figure S5). The fiber orientation and tractography of ligament and cartilage exhibited consistent results at both b value of 500 and 1500 s/mm2 with only 14 diffusion gradient directions (Supplemental Figure S6).
Discussion
Proteoglycan depletion, collagen fiber degradation, and water content increase are observed during the progress of OA.39,40 Although conventional MRI is relatively insensitive for early OA detection, recent advances of quantitative MRI have improved its ability to evaluate biochemical components in articular cartilage.8,41-43 Besides the quantitative measurements based on relaxation times, MD and FA derived from DTI are 2 promising biomarkers for early OA.29,44 However, the DTI metrics may be strongly dependent on the acquisition parameters, such as AR and b value. Systematically investigating these effects can provide substantial guidance to choose proper parameters for DTI scans in knee joint.
Effect of Angular Resolution
There are many studies that have analyzed the optimal diffusion directions for DTI, mainly in the CNS. 45 The DTI model requires minimum 6 diffusion encoding directions, acquiring additional directions can significantly improve the robustness of the FA and MD values in brain white matter.20,45 The effect of AR for DTI metrics in knee joint has not been investigated in detail. An increase in MD can be interpreted as indicative of the proteoglycan change in cartilage and has the potential to improve the diagnosis of the early phase of OA. 44 In this study, MD showed consistent results even at the AR of 6 in cartilage, ligament, and growth plate. This less sensitivity to the AR suggests that MD could be a promising and stable imaging biomarker for early OA. In contrast, the AR higher than 14 for consistent FA values implies that the sufficient AR is critical for quantifying the collagen anisotropy and fiber alignment. FA is a quantitative index of DTI used to characterize the degree of tissue anisotropy, where lower AR may result in variance of each of the tensor elements and finally in overestimating FA value. MD, which describes the rotationally invariant magnitude of water diffusion within the tissue, is determined by both axial diffusivity (AD) and radial diffusivity (RD). The decrease of AR leads to an overestimation of AD and an underestimation of RD, which results in the less variation of MD as a function of AR. The minimum AR of FA and MD for meniscus is higher than other connective tissues, probably because of the complex collagen architecture in meniscus. 26
It has been reported that the tractography became more stabilized when the AR was higher than 18 for cartilage, growth plate, and ligament. 25 However, the maximum AR was only 31, the tractography performance at higher AR is still unknown. The diffusion dataset with 147 diffusion gradient directions in the current study provides a foundation for exploration of trade-offs among different acquisition parameters. The tract length and tract volume are strongly dependent on the AR, especially when the diffusion gradient directions are lower than 40. The higher AR generally results in better tracts results, while the scan time will increase dramatically with more diffusion gradient directions.
Effect of b Value
The collagen fiber direction is indicated by the main eigenvector of diffusion tensor model. Diffusion tractography, which can visualize and quantify the fiber tracts, is based on the eigenvector information in each image voxel and the tracking algorithms. 32 In general, higher b value can suppress the isotropic diffusion component for better estimation of fiber direction in the soft tissue. 45 However, higher b value also results in lower SNR due to the longer TE and fast signal dephasing under the strong diffusion gradient. Because of the short T2 of cartilage and other connective tissues in knee joint, it is crucial to keep the TE as short as possible. 33 The optimal b values for cartilage have been reported between 700 and 1000 s/mm2 for in vivo cartilage DTI acquisition. 33 In another study, the b value of 400 to 800 s/mm2 was used and the changes of microstructural integrity in tendinopathy was successfully detected by DTI. 31 It has been demonstrated that DTI metrics and tractography results reach a plateau at the b value higher than 750 s/mm2. 25 In this study, we demonstrated that consistent tractography results can be obtained with the b value as high as 1500 s/mm2. However, both fiber orientation estimation and tractography failed at an even higher b value (2500 s/mm2), probably due to the dramatically drop of SNR (<10 for both cartilage and ligament). It is generally accepted that an SNR of at least 5 in the DWI with the highest b value is necessary to avoid bias. 33 We found that if the SNR was lower than 10, the fiber orientation and tractography were incorrectly estimated, even with high AR (43). In contrast, when the SNR was higher than 10, consistent tractography results were observed from b value of 500 to 1500 s/mm2 with a much lower AR (14). The SNR greater than 10 is essential to avoid apparent bias for fiber orientation estimation and tractography. 33
In summary, we have systematically explored the effects of b value and AR on DTI performance at different connective tissues in knee joint. The tract length and volume are sensitive to both b value and AR, which demands care in interpretation. To obtain consistent DTI outputs and tractography in knee joint, the scan may require a proper b value (ranging from 500 to 1500 s/mm2), sufficient AR (>14), and SNR (>10). Please note that changing b values normally will affect the SNR, which should be considered for the setup of DTI acquisitions.
Supplemental Material
sj-pdf-1-car-10.1177_19476035211007909 – Supplemental material for Effects of Angular Resolution and b Value on Diffusion Tensor Imaging in Knee Joint
Supplemental material, sj-pdf-1-car-10.1177_19476035211007909 for Effects of Angular Resolution and b Value on Diffusion Tensor Imaging in Knee Joint by Qi Zhao, Rees P. Ridout, Jikai Shen and Nian Wang in CARTILAGE
Footnotes
Supplemental Material
Acknowledgments and Funding
All the MRI scans were performed at the Center for In Vivo Microscopy (CIVM), supported through the NIH/NIBIB National Biomedical Technology Resource Center P41 EB015897 (G. Allan Johnson). The work is also supported by Charles E. Putman MD Vision Award of the Department of Radiology, Duke University School of Medicine (Nian Wang and Charles E. Spritzer). The authors thank Tatiana Johnson for editorial comments on the manuscript and Yi Qi, Gary Cofer, James Cook, and Lucy Upchurch for significant technical support.
Declaration of Conflicting Interests
The author(s) declared no potential conflicts of interest with respect to the research, authorship, and/or publication of this article.
Ethical Approval
All animal preparation protocols were approved by the Duke University institutional animal care and use committee (IACUC).
References
Supplementary Material
Please find the following supplemental material available below.
For Open Access articles published under a Creative Commons License, all supplemental material carries the same license as the article it is associated with.
For non-Open Access articles published, all supplemental material carries a non-exclusive license, and permission requests for re-use of supplemental material or any part of supplemental material shall be sent directly to the copyright owner as specified in the copyright notice associated with the article.