
Abstract
Objective
Regulatory guidelines for preclinical cartilage repair studies suggest large animal models (e.g., sheep, goat, [mini]-pig, or horse) to obtain results representative for humans. However, information about the 3-dimensional thickness of articular cartilage at different implantation sites in these models is limited.
Design
To identify the most suitable site for experimental surgery, cartilage thickness at the medial femoral condyle (MFC), lateral femoral condyle (LFC), and trochlea in ovine, caprine, and porcine cadaver stifle joints was systematically measured using hematoxylin-eosin staining of 6 µm paraffin sections and software-based image analysis.
Results
Regarding all ventral-dorsal regions of the MFC, goat showed the thickest articular cartilage (maximal mean thickness: 1299 µm), followed by sheep (1096 µm) and mini-pig (604 µm), with the highest values in the most ventral and dorsal regions. Also for the LFC, the most ventral regions showed the thickest cartilage in goat (maximal mean thickness: 1118 µm), followed by sheep (678 µm) and mini-pig (607 µm). Except for the mini-pig, however, the cartilage thickness on the LFC was consistently lower than that on the MFC. The 3 species also differed along the transversal measuring points on the MFC and LFC. In contrast, there were no consistent differences for the regional cartilage thickness of the trochlea among goat and sheep (≥780 µm) and mini-pig (≤500 µm).
Conclusions
Based on their cartilage thickness, experimental defects on goat and sheep MFC may be viable options for preclinical cartilage repair studies, in addition to well-established horse models.
Keywords
Introduction
Articular cartilage, a thin avascular layer covering the bone surface in different joints and allowing smooth motion with minimal friction, consists of chondrocytes, mesenchymal progenitor cells, and extracellular matrix (ECM). Its collagen and proteoglycan components provide both tensile/shear strength and elasticity, and render the cartilage a highly specialized tissue with excellent biomechanical properties.
Articular cartilage is characterized by a limited regeneration capacity after injury, and even small cartilage defects can lead to progressive degeneration. This represents a significant clinical problem, since different studies have demonstrated that 60% to 63% of the patients undergoing knee arthroscopy show various degrees of chondral lesions.1-3 This poor intrinsic regeneration has prompted the development of different therapeutic strategies, including intrinsic repair enhancement (microfracture, abrasion), osteochondral transfer techniques (OATS), and cell-based cartilage engineering (autologous chondrocyte transplantation [ACT] and matrix-induced autologous chondrocyte transplantation [MACT]4-8). To evaluate established strategies or develop novel approaches for the repair of cartilage injuries, meaningful preclinical animal studies are required.
Animals frequently used for the analysis of cartilage regeneration are mouse, rat, and rabbit (small animal models), or dog, sheep, goat, (mini)-pig, and horse (large animal models). The latter models are believed to better reflect the anatomical and human clinical situation and are therefore recommended for preclinical studies by the “European Medicines Agency” (EMA9-13).
To evaluate new cartilage implants, focal cartilage defects are preferably created on the medial femoral condyle (MFC), lateral femoral condyle (LFC), and trochlea of the stifle joint. The complexity of these studies requires optimized conditions to guarantee high reproducibility and reliability. Thus, the present study aimed at a systematic comparison of the cartilage thickness on these stifle joint locations to identify the sites most suitable for experimental surgery with a minimally invasive, medial parapatellar approach. 14 In particular, the goal was to provide a detailed 3-dimensional mapping of the thickness at these implant sites, since previous studies had assessed specific selected spots in different large animals, however, without comprehensive mapping of the entire tibiofemoral joint surface.12,15-22
For this purpose, osteochondral samples from cadaver stifle joints of the large animals sheep, goat, and mini-pig were processed for conventional hematoxylin-eosin (HE) staining. The cartilage thickness was then measured using software-based image analysis.
Materials and Methods
Animal Models
Ten cadaver stifle joints from Merino sheep (all female, 3-11 years old, 60-95 kg body weight), 10 stifle joints from German goats (all female, 4-8 years old, 40-75 kg body weight), and 8 stifle joints from Goettingen mini-pigs (all female, 5-7 years old, 40-50 kg body weight) were used for the analysis. Joint samples were derived from either unpublished studies of experimental chondral repair (permission from the governmental commission for animal protection, Free State of Thuringia, Germany; registration number 02-007/11) or published studies on the injection of calcium phosphate cement into bone defects of lumbar vertebral bodies. 23
Both right and left stifle joints were utilized. Animals were sacrificed in strict accordance with the Guidelines for the Care and Use of Laboratory Animals of the Friedrich Schiller University Jena, Jena, Germany. The stifle joint was opened and MFC, LFC ( Fig. 1A ), and the trochlea ( Fig. 1B ) were separated from the femur using a pneumatic saw. This resulted in osteochondral samples with a cartilage surface representing the surface maximally accessible in minimally invasive, medial parapatellar stifle joint surgery ( Fig. 1C and D ). 14 Only samples without signs of cartilage degeneration were used.
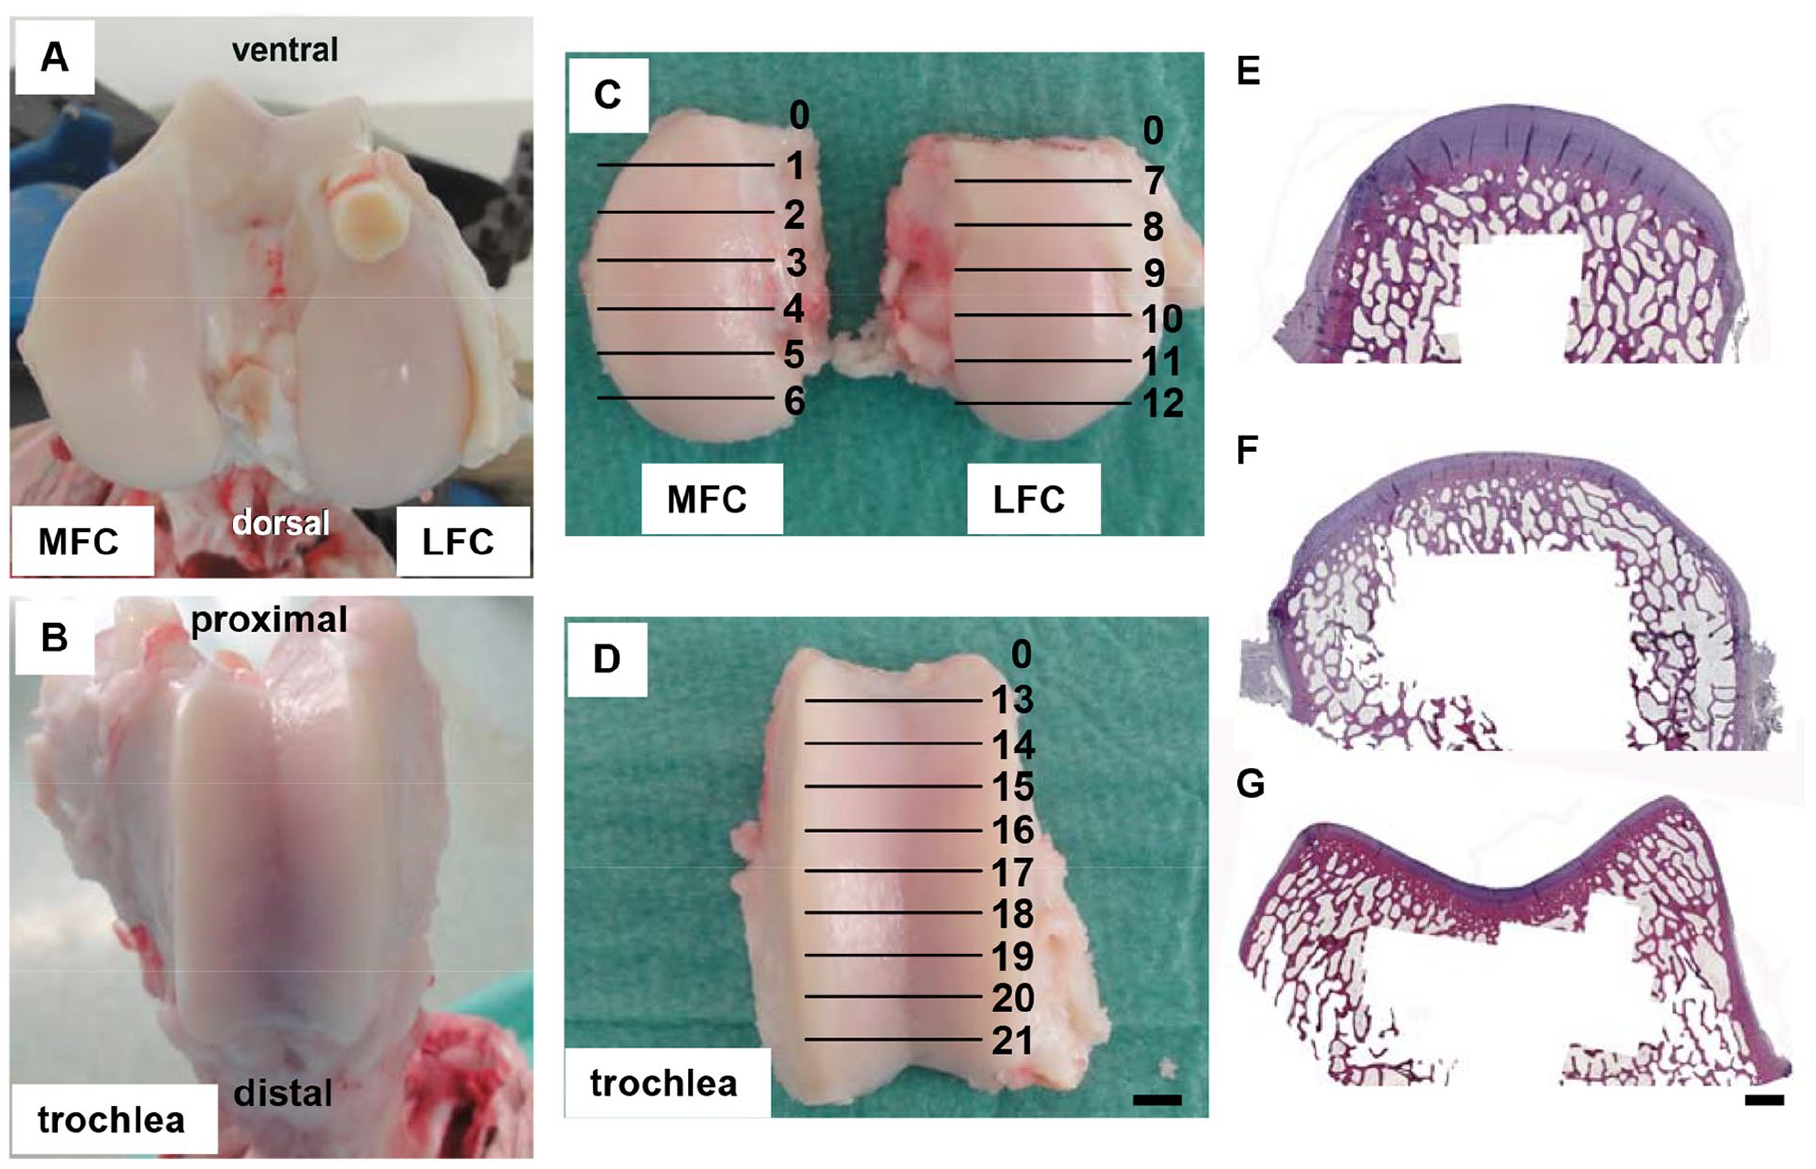
Preparation of osteochondral samples (species sheep). The potential cartilage implantation sites medial femoral condyle (MFC), lateral femoral condyle (LFC;
Histology
Directly after preparation, the osteochondral samples were fixed in 4% paraformaldehyde in phosphate-buffered saline (PBS) for 7 days and then subjected to paraffin embedding. Decalcification of the samples was achieved by incubation in Osteodec (Bio-Optica, Milan, Italy) for 3 to 4 weeks with a weekly exchange of the decalcifying solution. For the ovine and caprine model, decalcified osteochondral samples were sectioned into 7 (MFC and LFC) or 10 equally sized blocks (trochlea) respectively ( Fig. 1C and D ); the most ventral/proximal block was discarded and the remaining blocks were used for analysis. The osteochondral samples were separated longitudinally as follows: (1) MFC (regions 1-6), (2) LFC (regions 7-12), and (3) trochlea (regions 13-21). Because of the small size of the mini-pig stifle joint, only the central 3 blocks were chosen to evaluate the cartilage thickness of the condyles and the trochlea (MFC—regions 2, 3, and 4; LFC—regions 8, 9, and 10; trochlea—regions 15, 17, and 19). Decalcified osteochondral blocks showed a total length of 0.40 to 0.54 cm (condyles) and 0.36 to 0.56 cm (trochlea), depending on the cartilage available for experimental cartilage defects in the different species. After dehydration and paraffin embedding, microtome sections (thickness 6 µm) of MFC, LFC, and trochlea were stained with conventional HE and used to evaluate the cartilage thickness ( Fig. 1E and G ).
For each longitudinal region, 10 (MFC and LFC) or 15 (trochlea) equally spaced measuring points were chosen in the transversal direction to determine the cartilage thickness between the tidemark (border between the noncalcified and calcified layer of cartilage) and the cartilage surface ( Fig. 2A and B ; see 3 examplary scales with corners in a perpendicular orientation to the surface). For each longitudinal region, data were then expressed as mean ± SEM, minimum, and maximum of all transversal measuring points (see Table 1 ).
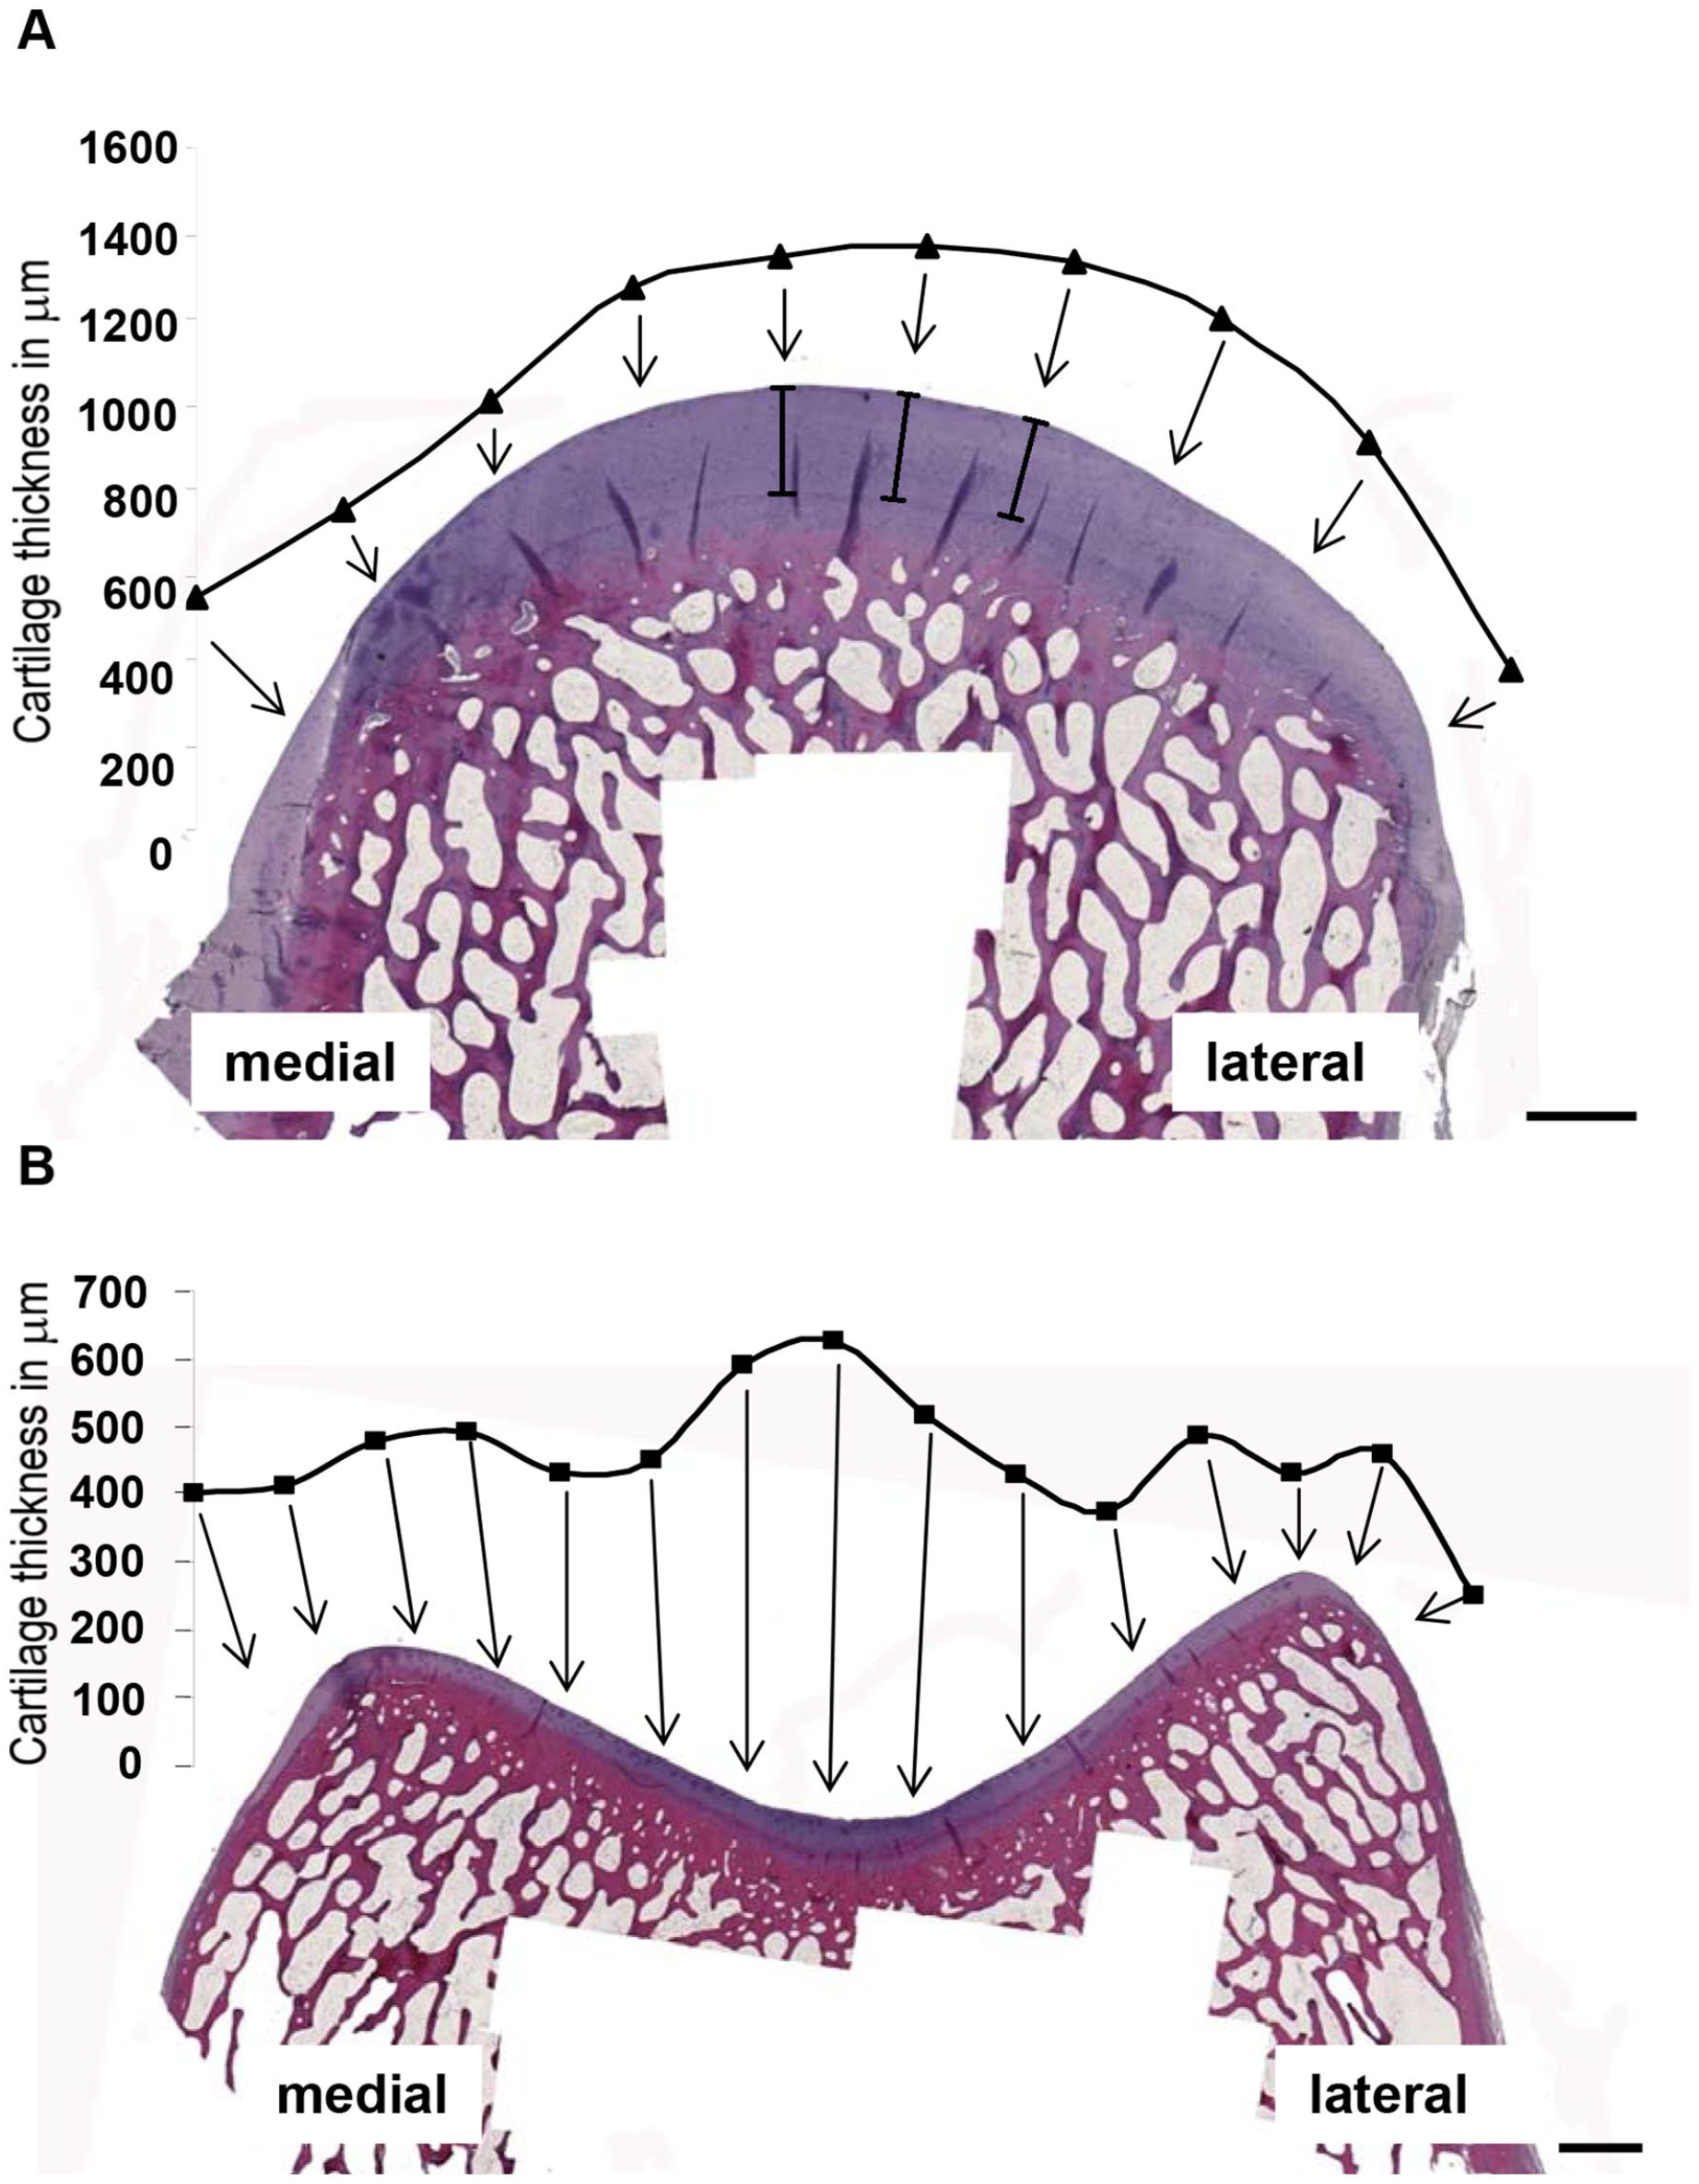
Determination of the articular cartilage thickness (species sheep). Articular cartilage thickness on the medial femoral condyle (MFC) and lateral femoral condyle (LFC) (10 transversal measuring points each; shown for region 2 of the MFC in
Mean, Minimal, and Maximal Cartilage Thickness of Medial Femoral Condyle (MFC) and Lateral Femoral Condyle (LFC) in the Different Animal Models. a .
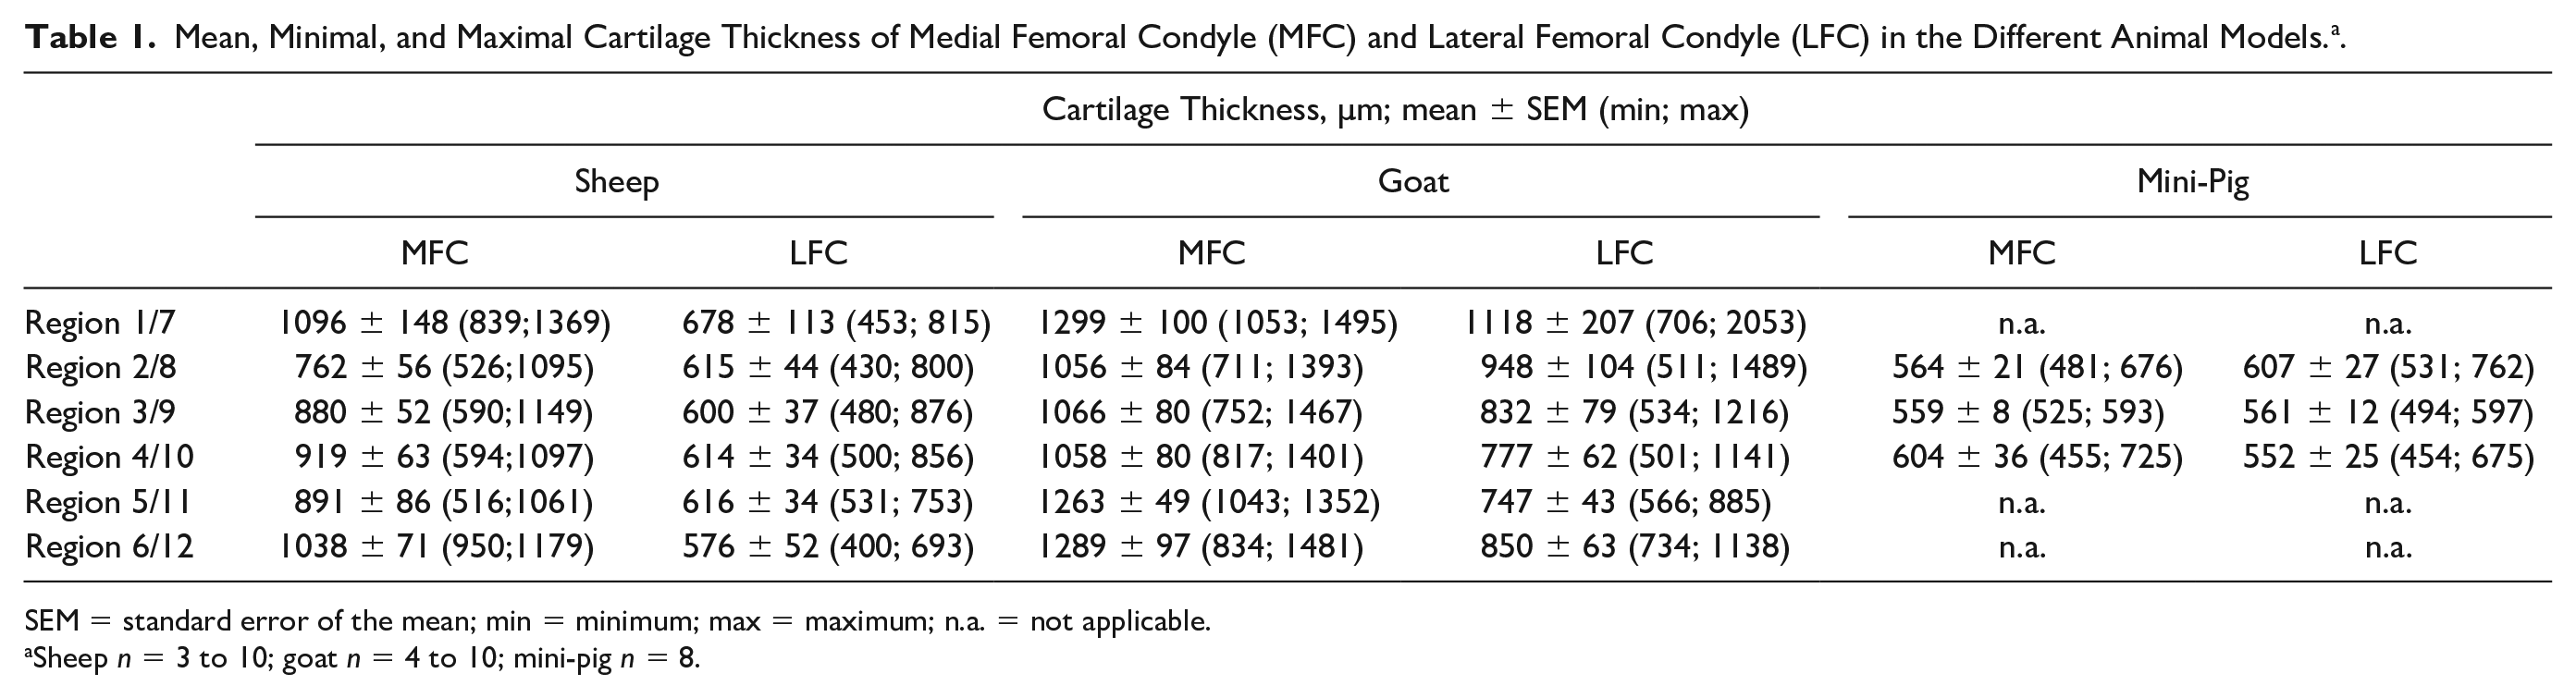
SEM = standard error of the mean; min = minimum; max = maximum; n.a. = not applicable.
Sheep n = 3 to 10; goat n = 4 to 10; mini-pig n = 8.
For quality management, the reproducibility of the thickness measurements was analyzed (10-fold repeat measurements of the same section for each of the 10 transversal measuring points of region 2 on the sheep MFC; see 3 examplary scales with corners; Fig. 2A ). The standard deviation (SD) of the repeat measurements was very low and ranged from 2.0 to 4.1 µm (0.2%-0.7% of the mean).
Determination of Articular Cartilage Thickness
Articular cartilage was analyzed using an Axiophot microscope and a 1.25× EC Plan-Neofluar objective (both Carl Zeiss, Jena, Germany). Quantitative measurements of the articular cartilage thickness were carried out applying the Axiovision 4.2. software (Carl Zeiss Vision GmbH, Jena, Germany).
Statistical Analysis and Heat Map Representation of the Cartilage Thickness
Articular cartilage thickness was expressed as means ± SEM for each region; the area under the curve (AUC) was then calculated for each region of MFC, LFC, and trochlea and the data for each species were again expressed as means ± SEM. Statistical analyses of differences among the AUC for each longitudinal region of the MFC and LFC within 1 species, between matching longitudinal regions of MFC and LFC within 1 species, and between matching longitudinal regions of the MFC and LFC in the 3 different species were performed with the IBM SPSS 26.0 program.
The significance of differences among the different cartilage regions in 1 species was exploratively assessed using the Wilcoxon U test (P ≤ 0.05), differences among the 3 species using the Mann-Whitney U test (P ≤ 0.05). In the latter case, corrections for multiple comparisons according to the modified Holm-Bonferroni procedure were applied by first performing a multigroup Kruskall-Wallis test (P ≤ 0.05) and then performing the direct group-group comparison by Mann-Whitney U test only for those regions showing significant differences in the Kruskall-Wallis test.
The cartilage thickness values for all transversal measuring points of the respective longitudinal regions on MFC, LFC, and trochlea (compare with Fig. 2 ) were illustrated by heat maps using a custom script in python (Python 3.7) with the seaborn package (Seaborn 0.10.0). A Gaussian image filter sigma 3 was then applied to the image using the scipy program (Scipy 1.4.1). The 2-dimensional maps were then overlaid onto the cartilage surface of MFC, LFC, and trochlea using displacement map in Photoshop (Photoshop CC 2019).
Results
Histological evaluation of the articular cartilage thickness showed notable differences among the experimental cartilage implantation sites MFC, LFC, and trochlea in 1 species and among the 3 different species for each of these sites.
Sheep
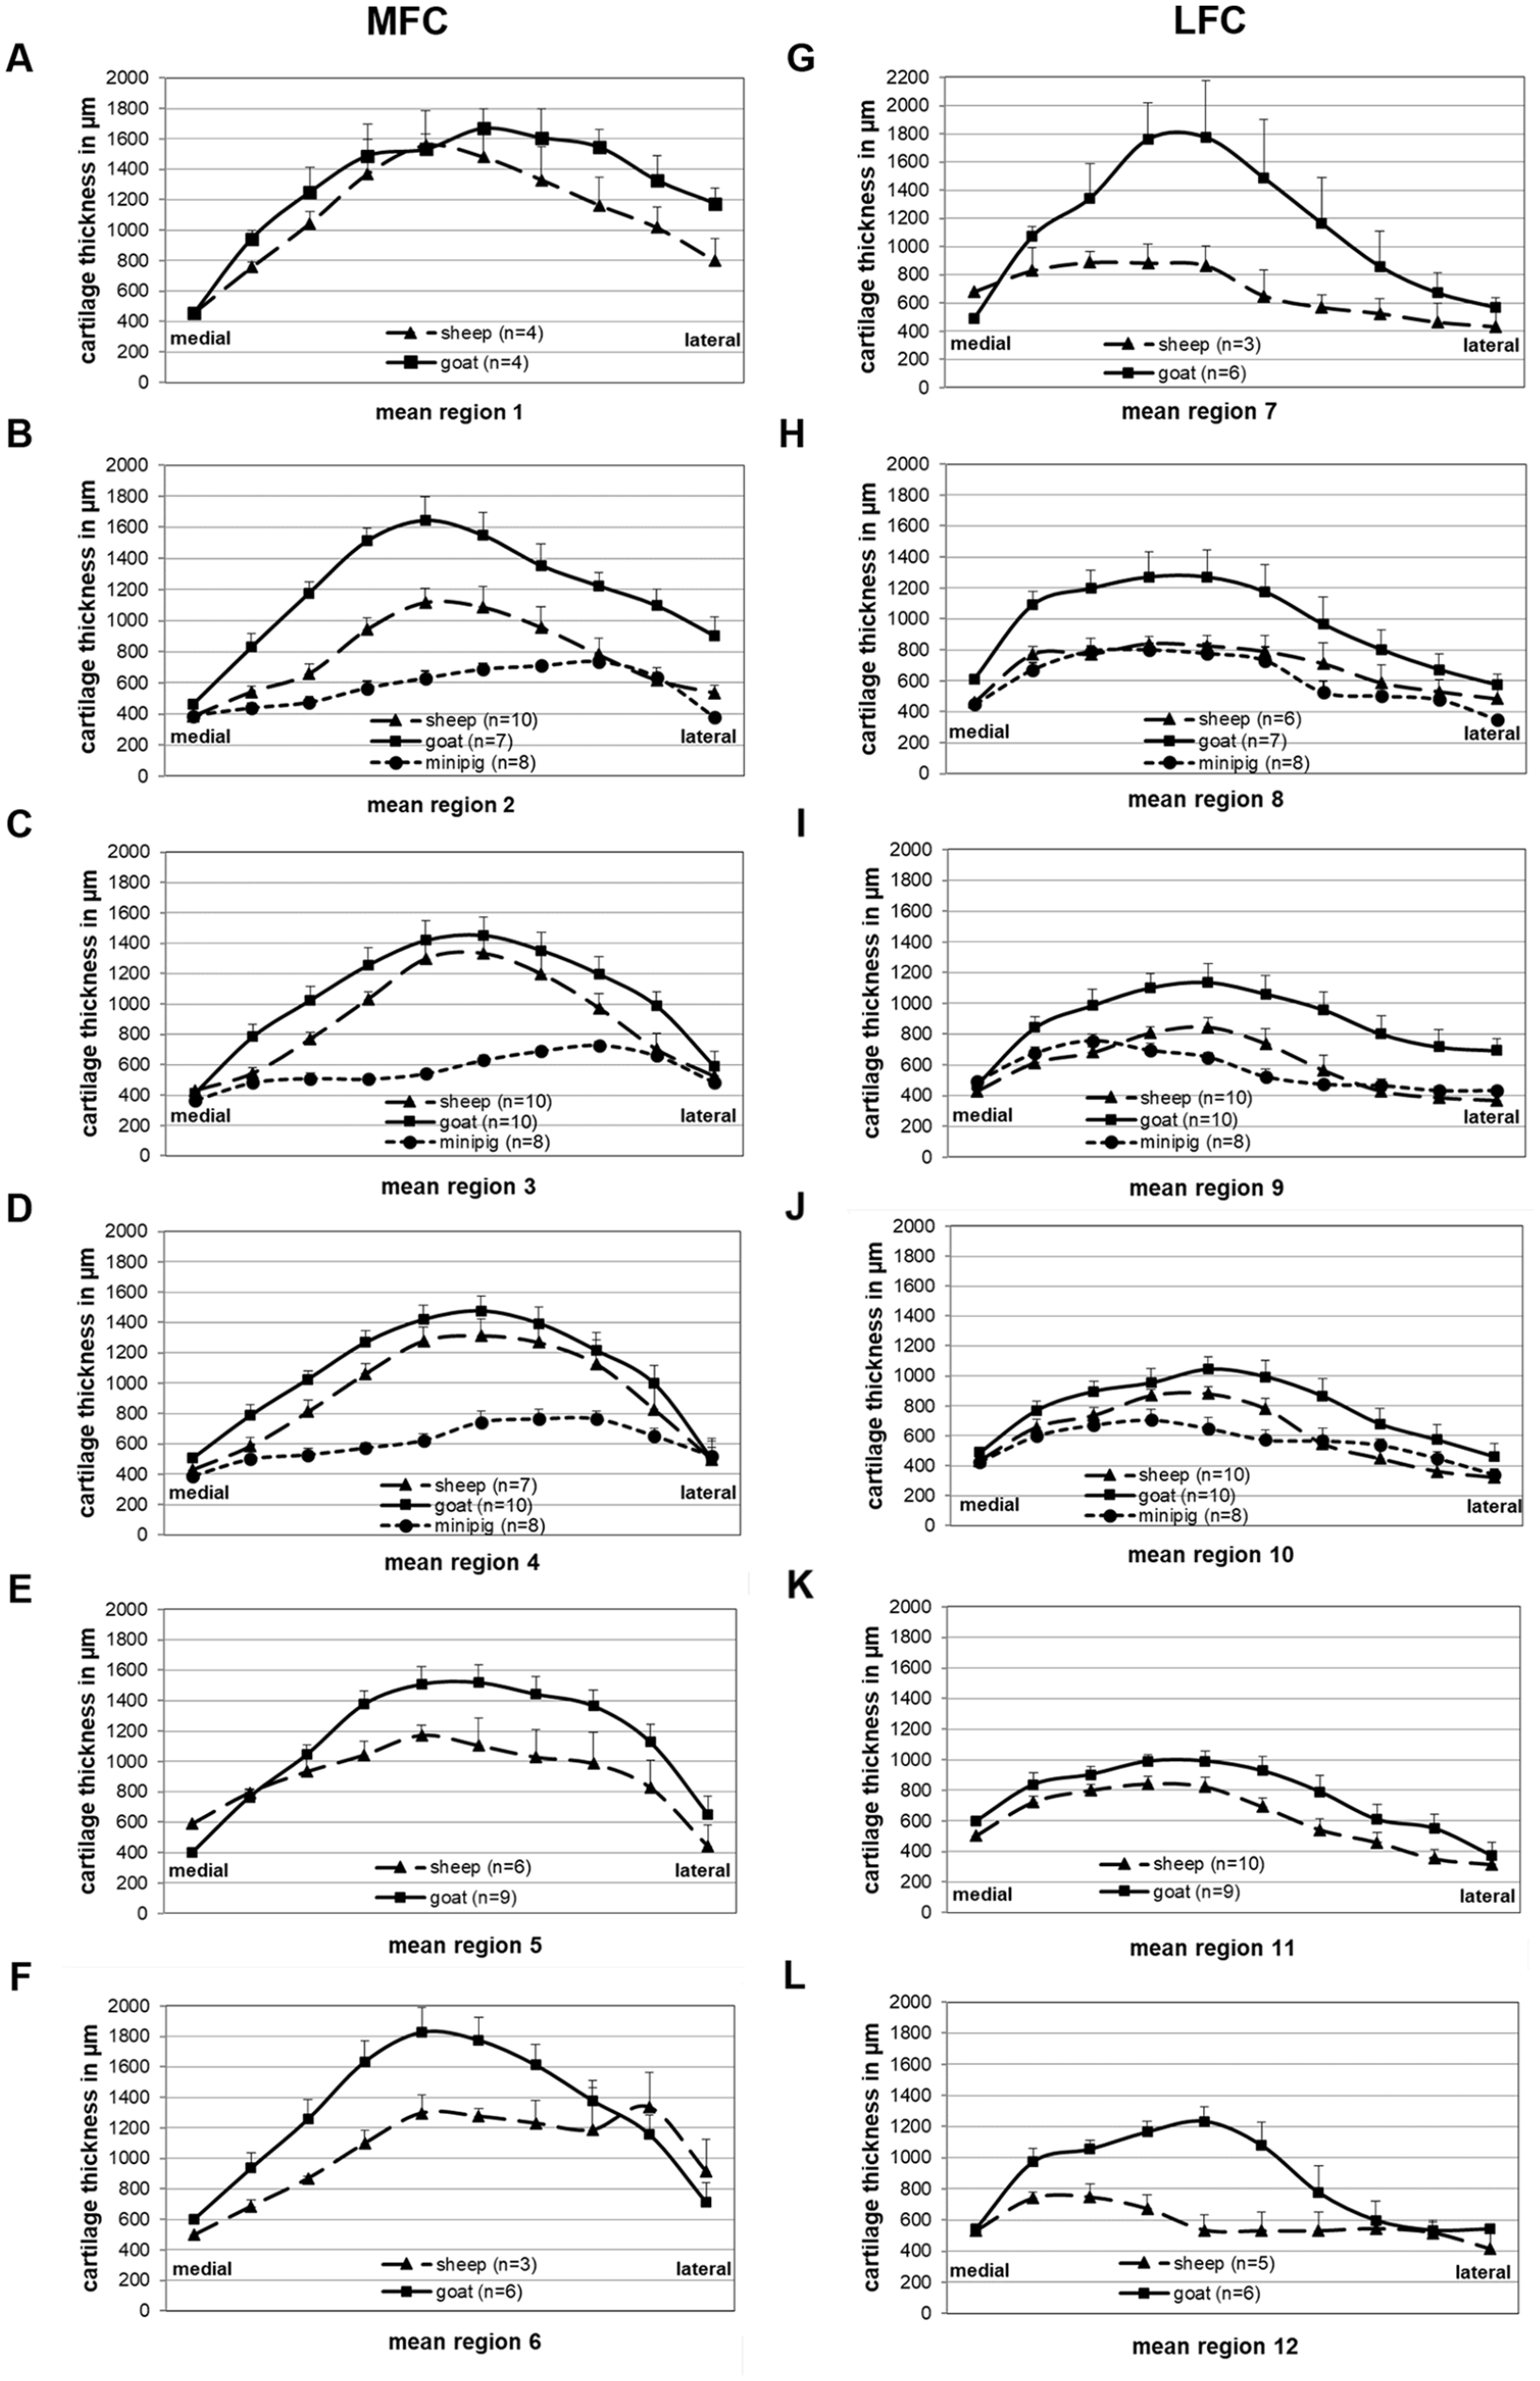
Concerning the longitudinal direction of the ovine MFC, the highest values for the mean cartilage thickness were observed in the most ventral region 1 and the most dorsal region 6 (1096 and 1038 µm, respectively; Table 1 ), with significant differences between the cartilage thickness AUC in region 2 versus regions 3 and 4 ( Fig. 3A ).
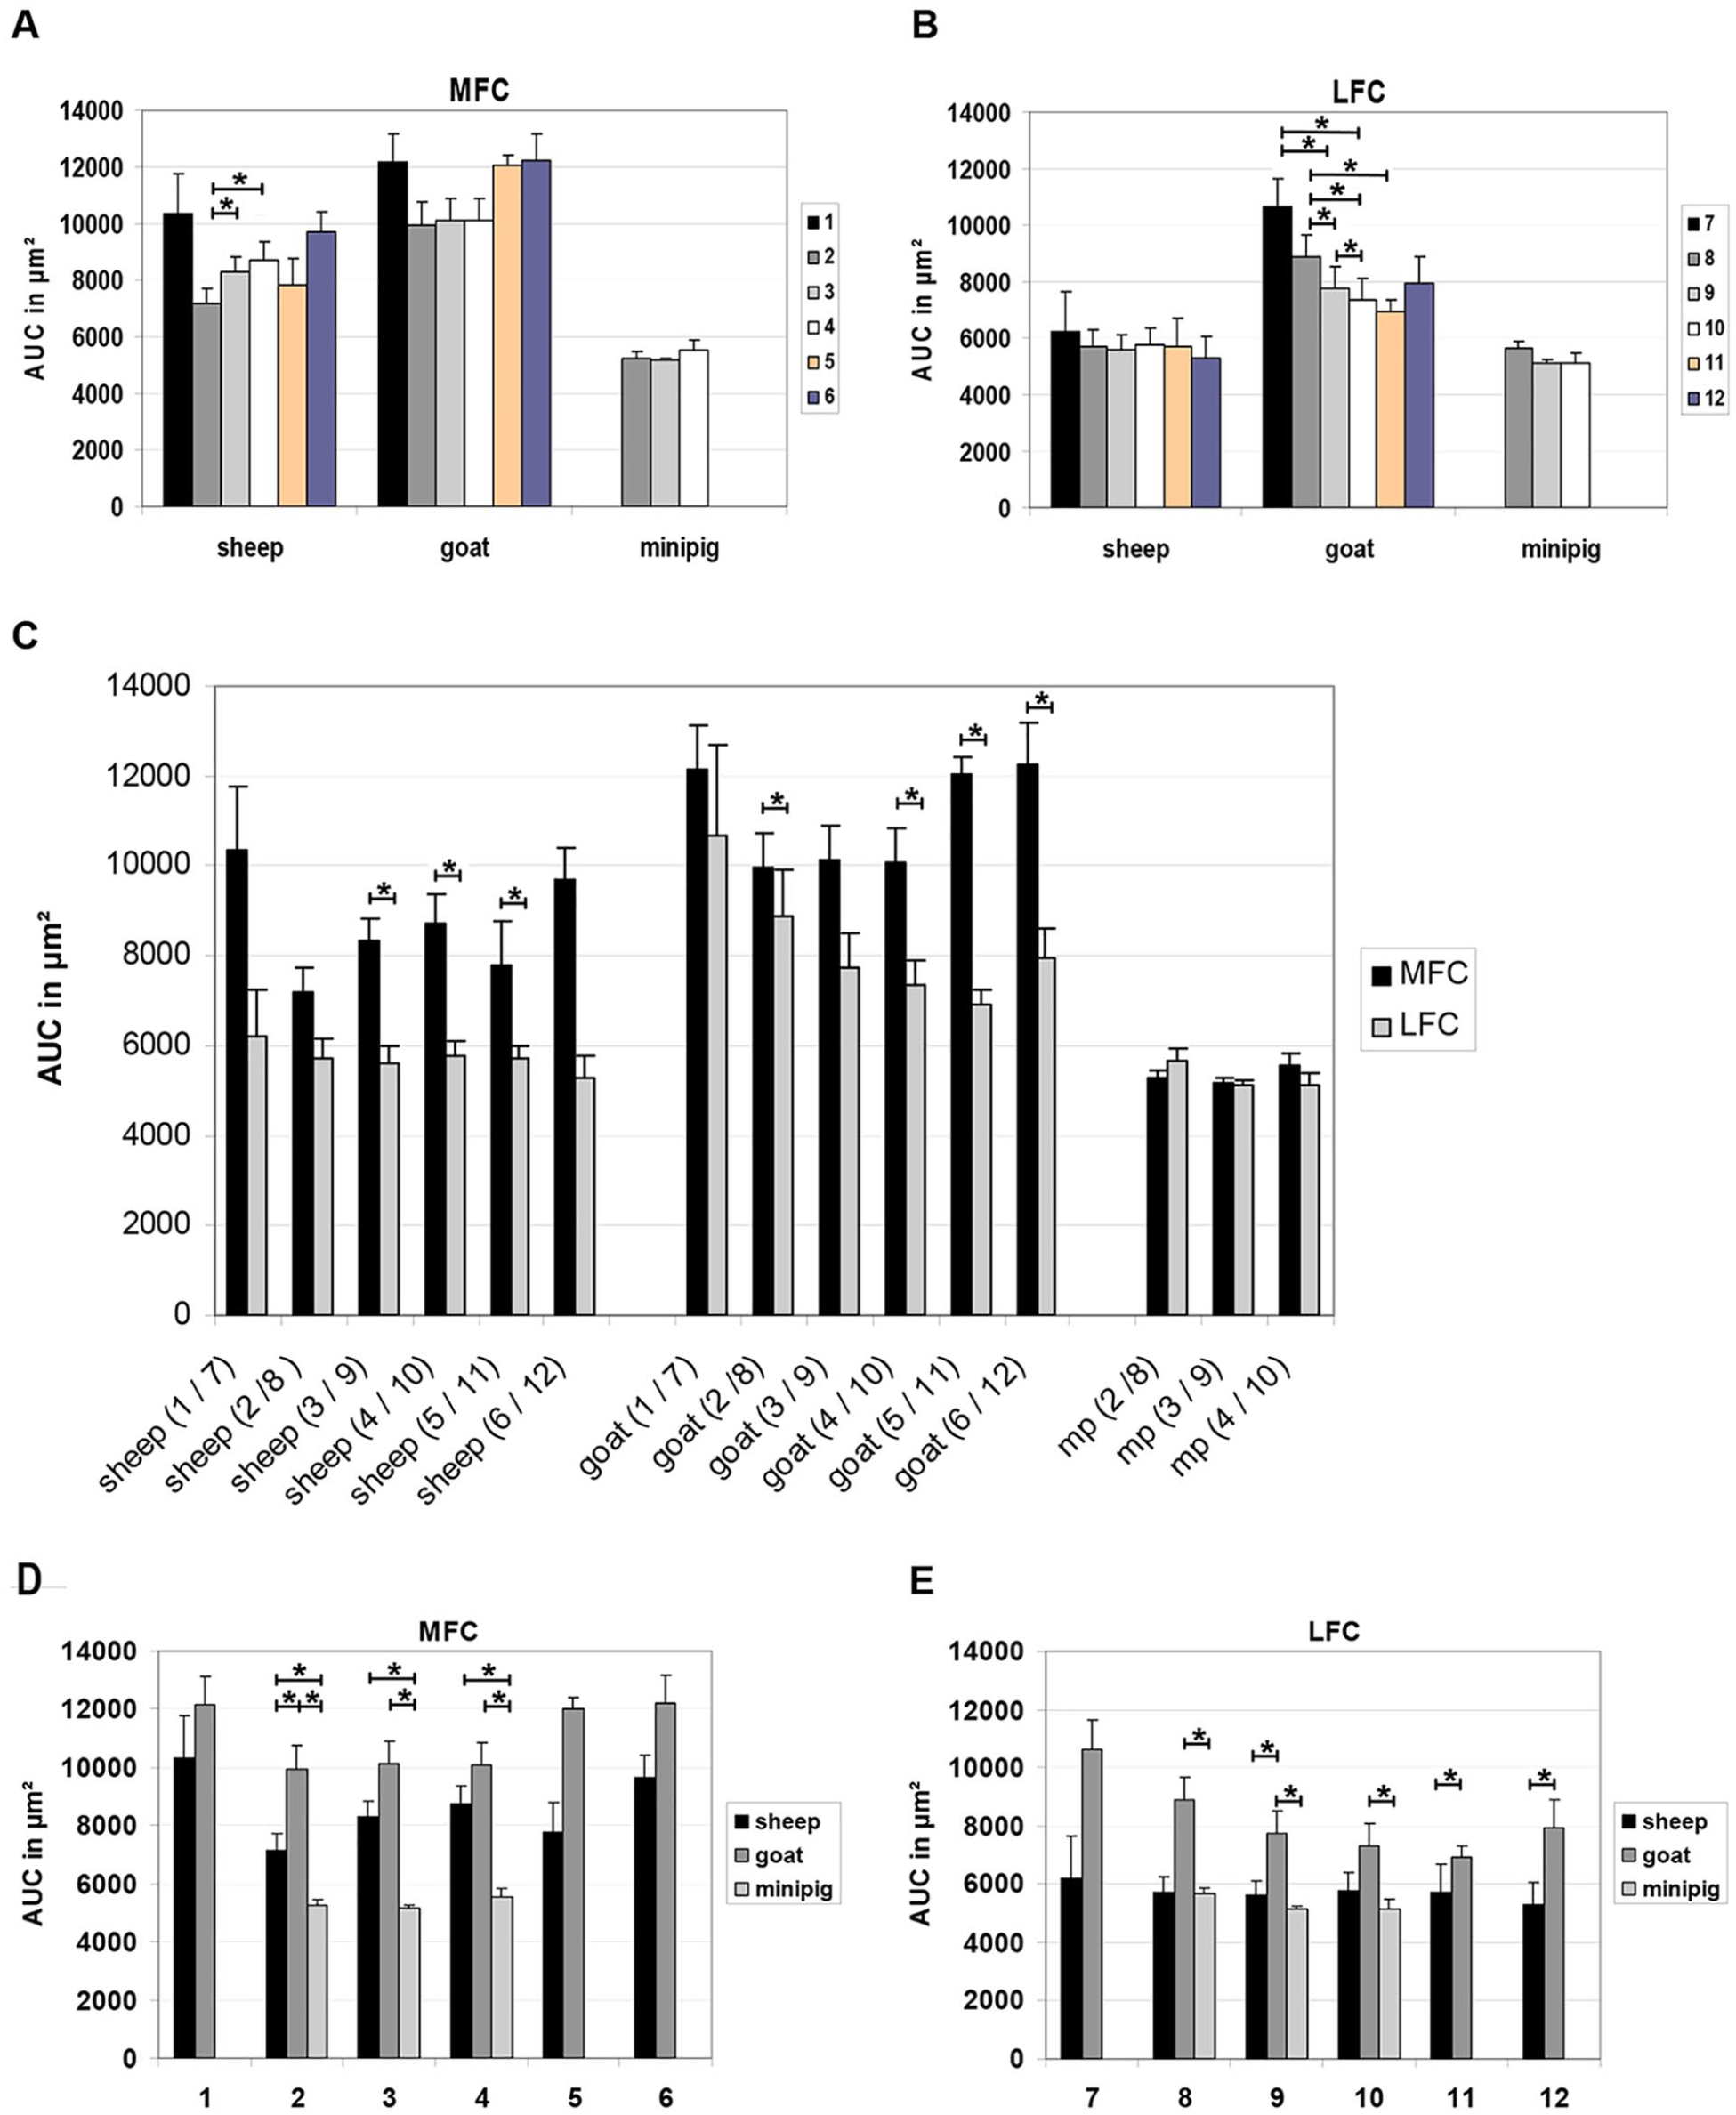
Longitudinal articular cartilage thickness data of medial femoral condyle (MFC) and lateral femoral condyle (LFC). The area under the curve (AUC) for each longitudinal region of the MFC and LFC was compared within 1 species (
In the transversal direction, the highest cartilage thickness of the ovine MFC was situated in the center of the condyle between measuring points 4 and 7 ( Fig. 4A-F ).
Transversal articular cartilage thickness of medial femoral condyle (MFC;
As for the MFC, the highest longitudinal mean cartilage thickness on the ovine LFC occurred in the ventral region 7 (678 µm), but regions 8 to 12 showed comparably high values ( Table 1 ), in this case without significant differences among the different regions ( Fig. 3B ).
In contrast to the MFC, however, the highest transversal cartilage thickness on the LFC was localized somewhat more medially between measuring points 3 and 6 ( Fig. 4 G-L ).
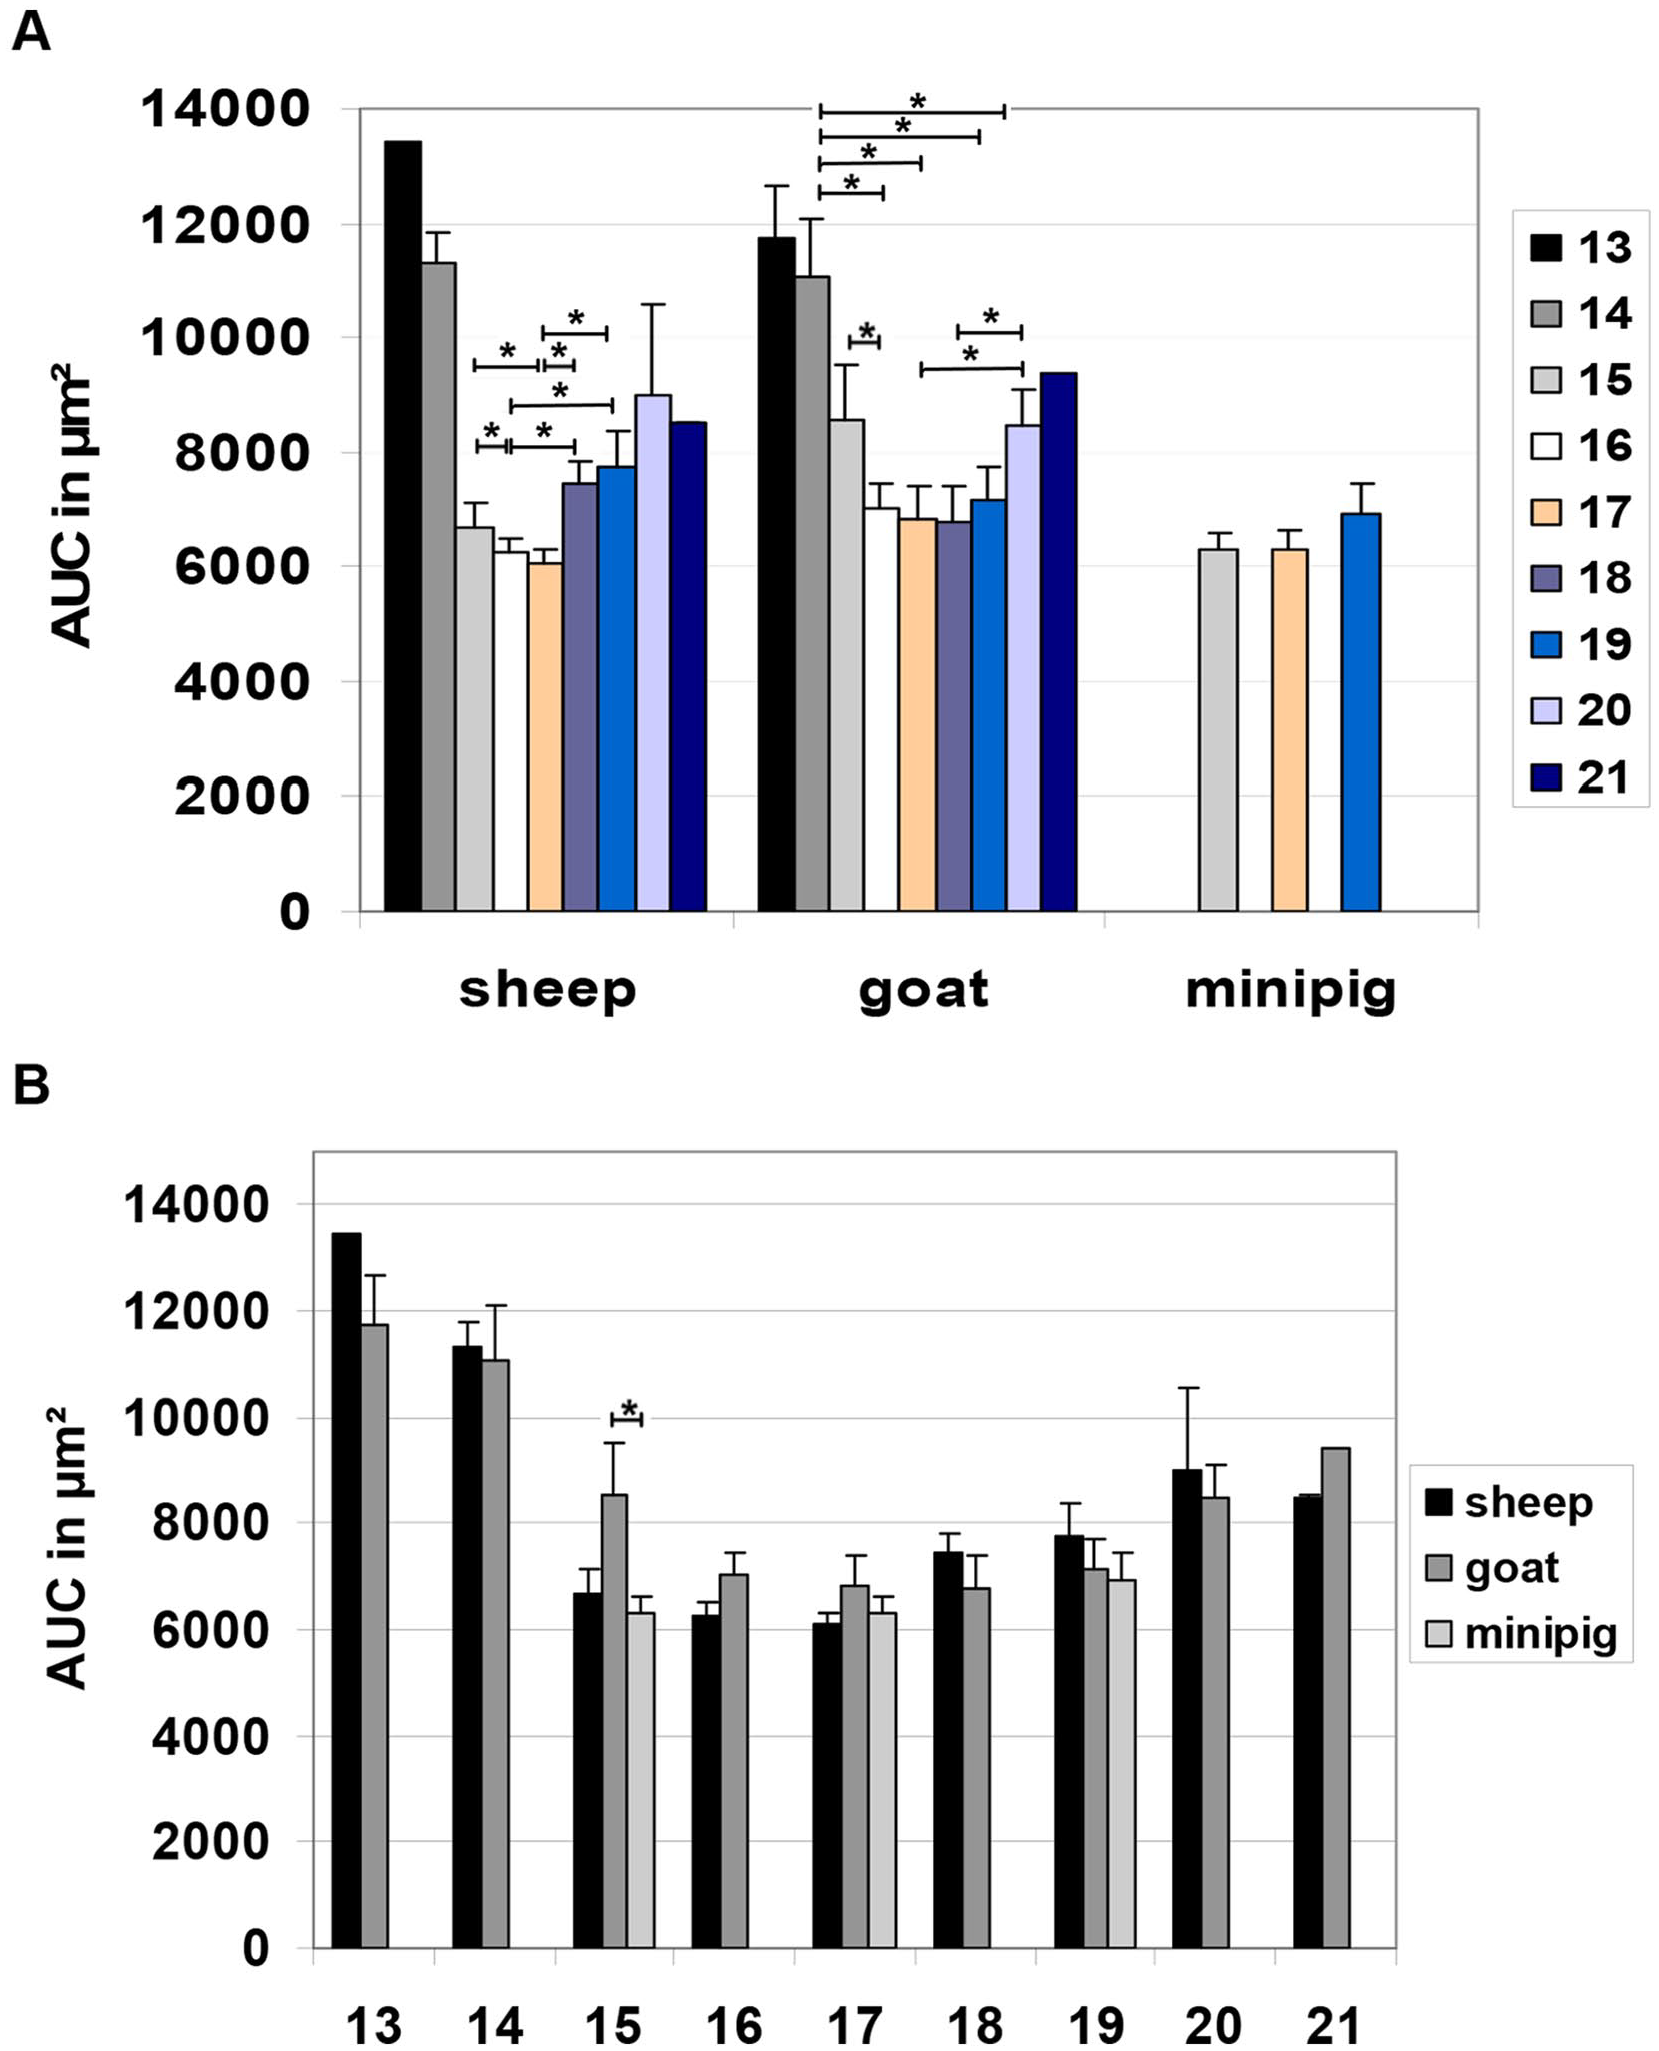
In the longitudinal direction of the ovine trochlea, the proximal regions 13 (911 µm) and 14 (792 µm) showed the highest mean cartilage thickness ( Table 2 ). Regions 16 and 17 showed the lowest cartilage thickness AUC (both P ≤ 0.05 vs. regions 15, 18, and 19; Fig. 5A ).
Mean, Minimal, and Maximal Cartilage Thickness of the Trochlea in the Different Animal Models. a .
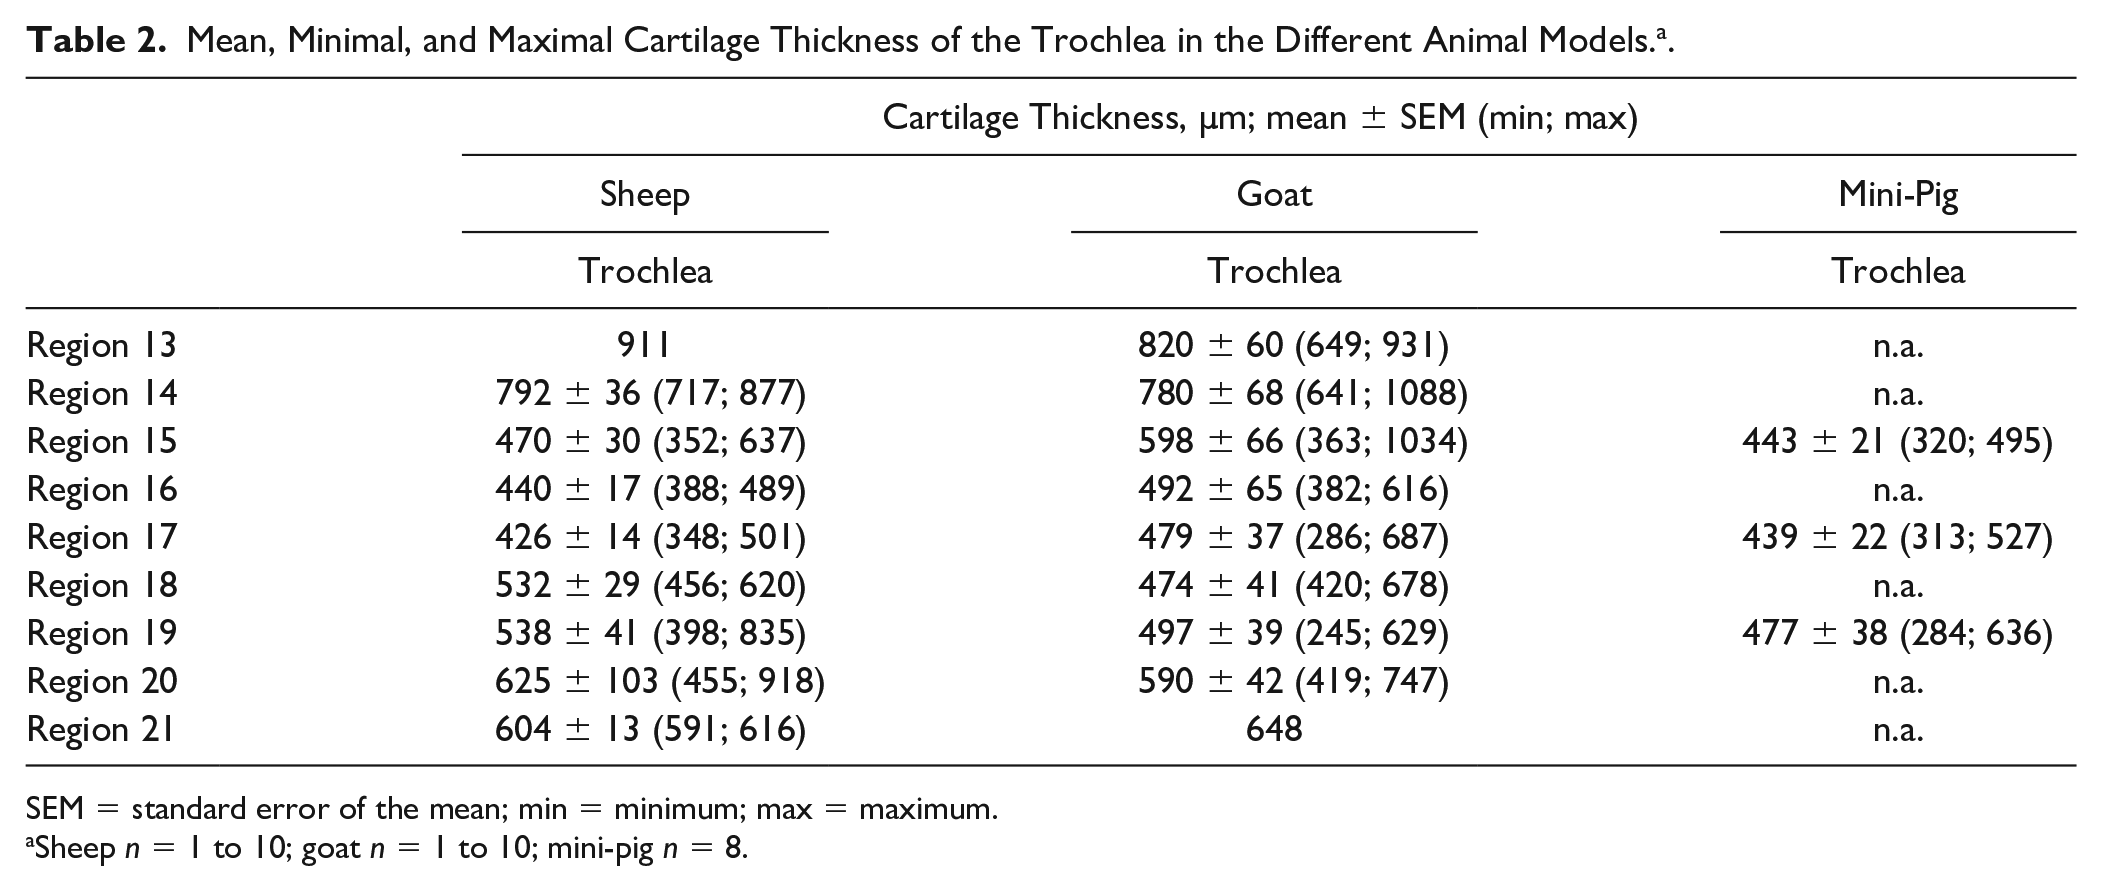
SEM = standard error of the mean; min = minimum; max = maximum.
Sheep n = 1 to 10; goat n = 1 to 10; mini-pig n = 8.
Longitudinal articular cartilage thickness data of the trochlea. The area under the curve (AUC) for each longitudinal region of the trochlea was compared within 1 species (
In the transversal direction, the thickness profile often showed 3 peaks at the measuring points 2, 7 to 9, and 14 ( Fig. 6A , and E-I ), associated with anatomical structures of the trochlea, that is, medial trochlear ridge, deepest point of the trochlear groove, and lateral trochlear ridge ( Figs. 1B , D , and G and 2B ).
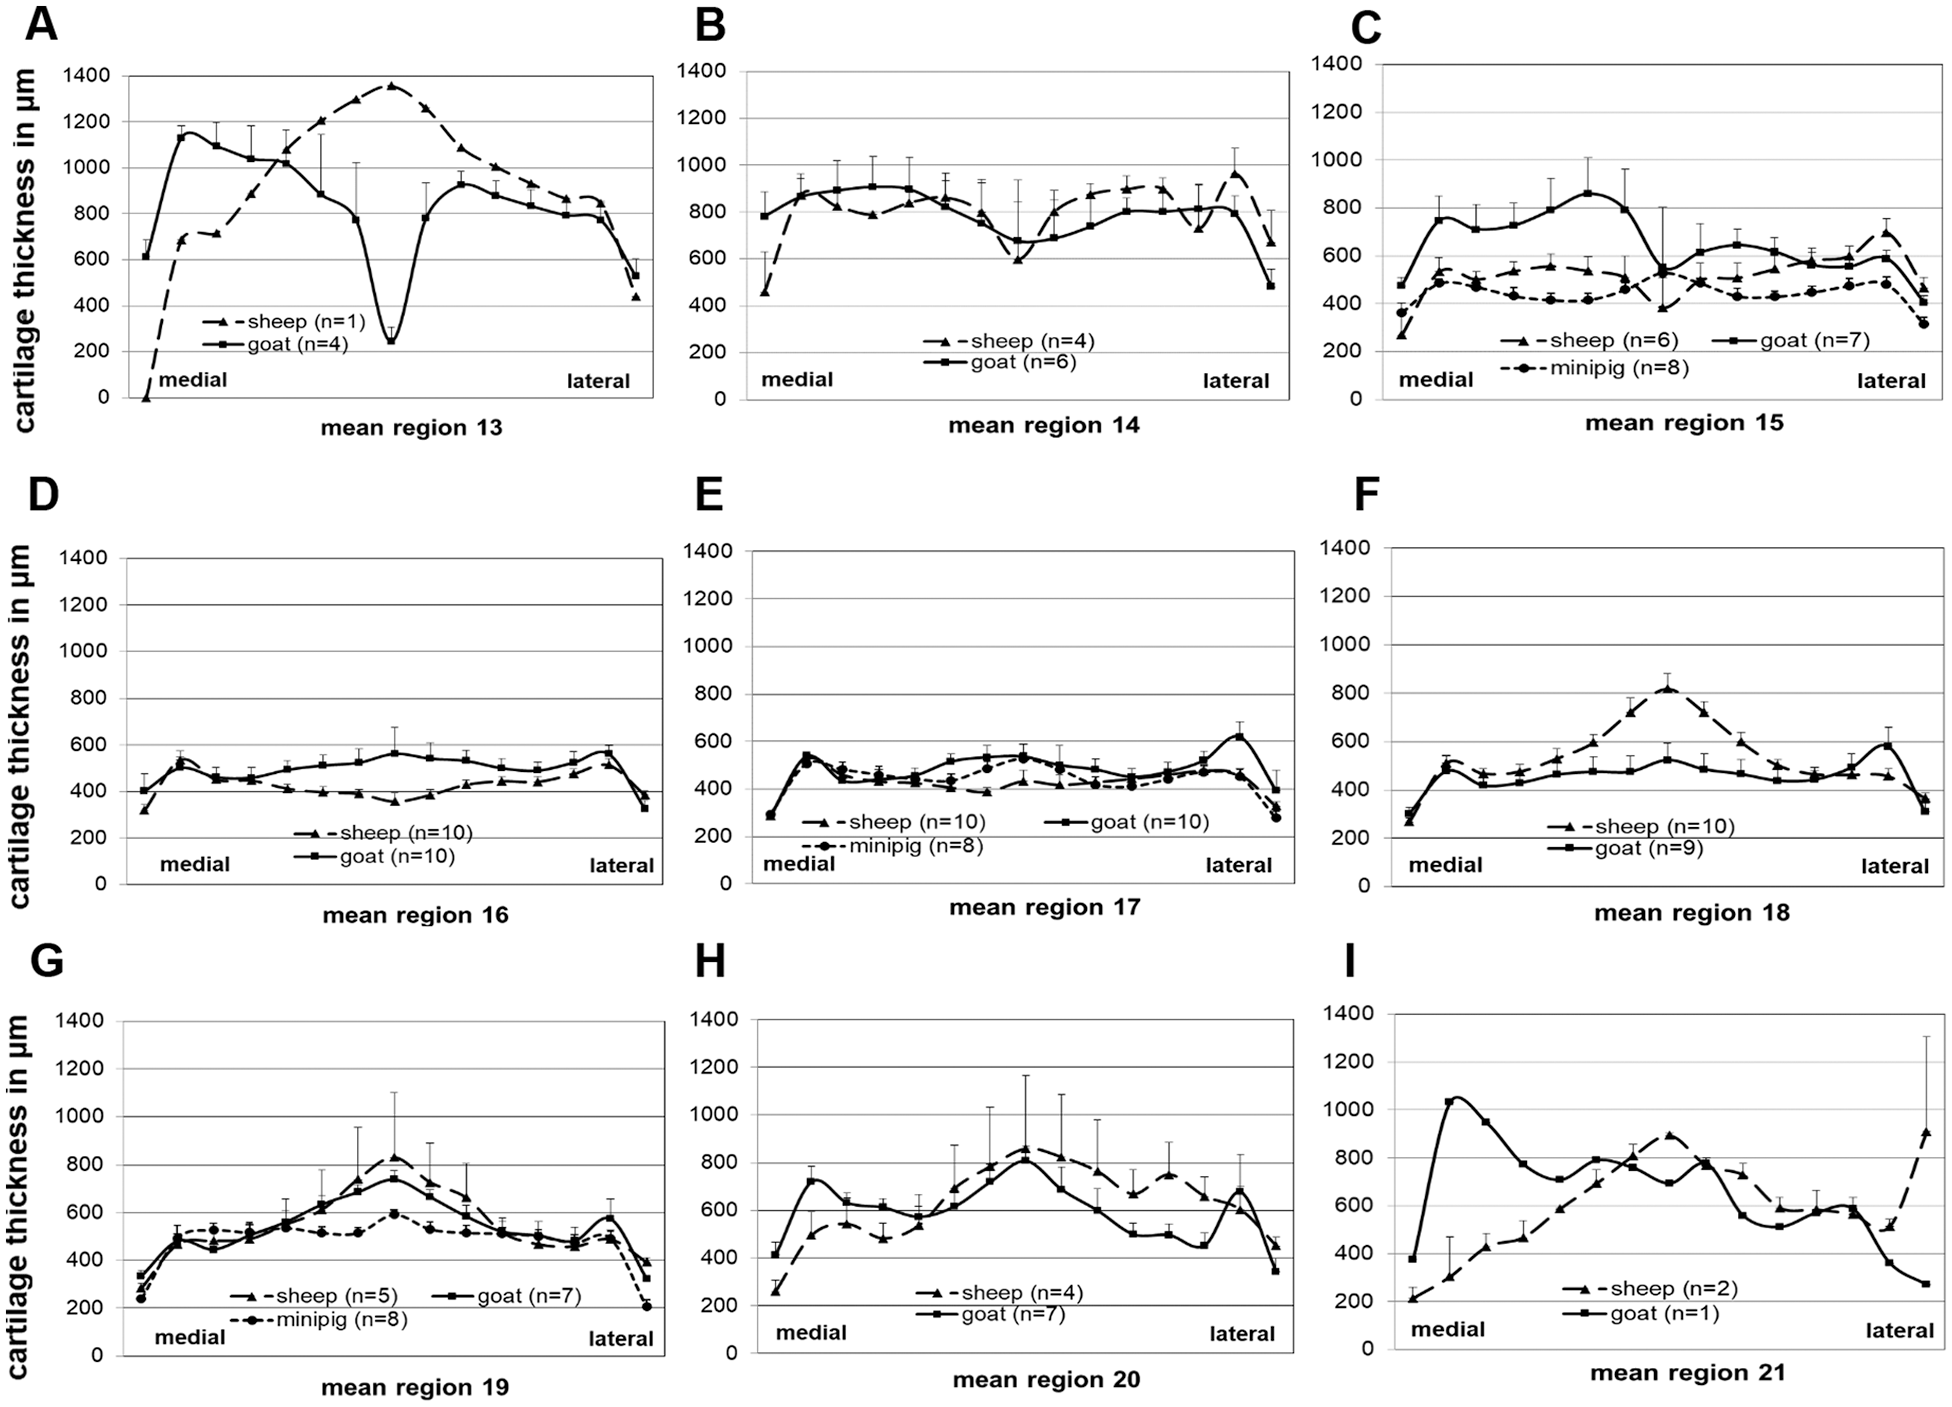
Transversal articular cartilage thickness of the trochlea (longitudinal regions 13-21) in the different animals. Fifteen transversal measuring points at equal distance were chosen to determine the articular cartilage thickness in every region of the trochlea.
Goat
In the longitudinal direction, the caprine MFC showed the highest mean cartilage thickness in the ventral region 1 and the dorsal regions 5 and 6 (1299, 1263, and 1289 µm, respectively; Table 1 ), without significant differences among the different regions ( Fig. 3A ).
Similar to the ovine MFC, the highest cartilage thickness in the transversal direction of the caprine MFC was found in the condyle center between points 4 and 7 ( Fig. 4A-F ).
As for the ovine LFC, the highest longitudinal mean cartilage thickness on the caprine LFC was reached in the ventral regions 7 and 8 (1118 and 948 µm, respectively; Table 1 ), in this case with significantly higher values for the cartilage thickness AUC in region 7 versus regions 9 and 10; region 8 versus regions 9, 10, and 11; and region 9 versus region 10 ( Fig. 3B ).
Similar to the ovine LFC, the highest transversal cartilage thickness on the caprine LFC was localized somewhat more medially between measuring points 3 and 6 ( Fig. 4G-L ).
The highest mean cartilage thickness in the longitudinal direction of the caprine trochlea was noticed in the most proximal regions 13 (820 µm) and 14 (780 µm; Table 2 ). The highest cartilage thickness AUC of the trochlea was observed in regions 13 and 14 (P ≤ 0.05 vs. regions 16, 17, 19, and 20), as well as region 15 (P ≤ 0.05 vs. region 16) and region 20 (P ≤ 0.05 vs. regions 17 and 18; Fig. 5A ).
In the transversal direction, the thickness profile again often showed three peaks at the measuring points 2, 7 – 9, and 14 ( Fig. 6A and E-I ), in association with the defined anatomical structures of the trochlea ( Figs. 1B , D , and G and 2B ).
Mini-Pig
The 3 analyzed longitudinal regions of the porcine MFC showed only slight differences in cartilage thickness values (between 564 and 604 µm; Table 1 ), without any significant differences among the cartilage thickness AUC in the different regions ( Fig. 3A ).
In the transversal direction, interestingly, the highest cartilage thickness of the porcine MFC was situated in the lateral condyle between measuring points 6 and 8 ( Fig. 4B-D ).
Similar to the MFC, the cartilage thickness of the longitudinal regions on the LFC was very similar, and the different regions did not significantly differ ( Fig. 3B ).
In strong contrast to the MFC, however, the highest transversal cartilage thickness on the LFC was localized much more medially between measuring points 2 and 4 ( Fig. 4H-J ).
Also, the cartilage thickness of the longitudinal regions on the porcine trochlea was very similar (between 439 and 477 µm; Table 2 ), again without any significant differences among the cartilage thickness AUC in the different regions ( Fig. 5A ).
Similar to the ovine and caprine trochlea, the thickness profile in the transversal direction of the porcine trochlea again showed 3 peaks at the measuring points 2, 7 to 9, and 14 ( Fig. 6C , E , and G ) in parallel to the anatomical trochlea structures ( Figs. 1B , D , and G and 2B ).
Comparison of the Different Species
Cartilage Sites MFC and LFC
Remarkable differences in articular cartilage thickness were noted between the different cartilage sites (illustrated in Fig. 7 for sheep) and/or different species by histological analysis.
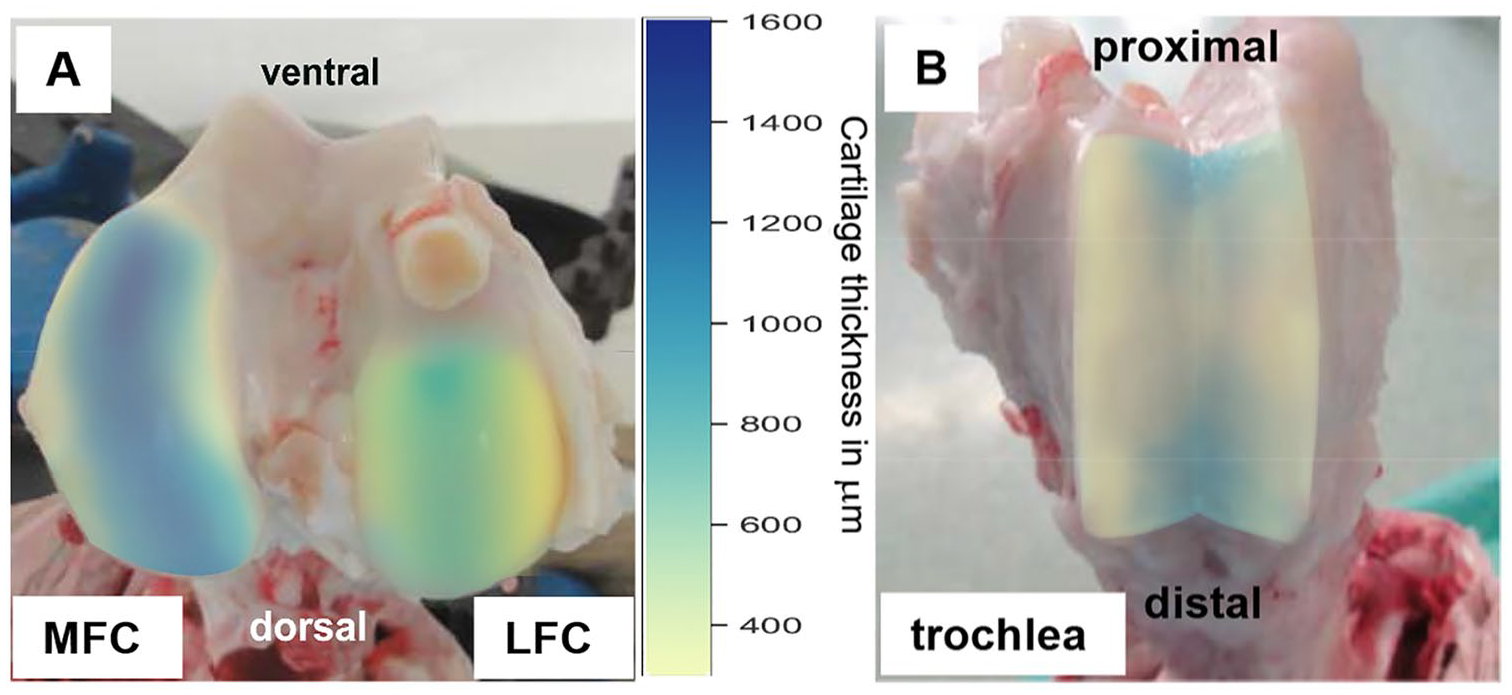
Illustration of the articular cartilage thickness on sheep medial femoral condyle (MFC;
Concerning the comparison between MFC and LFC, the cartilage thickness AUC was consistently higher in the MFC of sheep and goat (P ≤ 0.05 for regions 3 to 5 vs. regions 9 to 11, respectively in sheep; P ≤ 0.05 for regions 2, 4, 5, and 6 in goat; Fig. 3C ), but very similar in the mini-pig ( Fig. 3C ).
Comparing the 3 different species, MFC and LFC of the species goat consistently achieved the highest values for all transversal measuring points of all longitudinal regions ( Fig. 4A-L ) and for the cartilage thickness AUC in the different regions ( Fig. 3D and E ; MFC: P ≤ 0.05 for goat vs. sheep and/or mini-pig in regions 2-4; LFC: P ≤ 0.05 for goat vs. mini-pig in regions 8-10 and vs. sheep in regions 9, 11, and 12). In all regions on the MFC, the species goat was followed by the species sheep and the species mini-pig in a descending order, with significantly higher cartilage thickness AUC in sheep versus mini-pig in regions 2 to 4 ( Figs. 4 A-F and 3D ). In the LFC, in contrast, the cartilage thickness in sheep and mini-pig was comparable ( Figs. 4G-L and 3E ).
In addition, the 3 species showed differences in the cartilage thickness along the transversal measuring points. While the highest cartilage thickness on the MFC in goat and sheep was situated in the center of the condyle (points 5-7), the LFC in these species showed the maximum cartilage thickness on the medial side of the condyle (points 3-6; Fig. 4 ). In the mini-pig, in contrast, the highest cartilage thickness on the MFC was situated on the lateral side of the condyle (points 6-8) and the LFC achieved the highest cartilage thickness values more medially (points 2-4; Fig. 4 ).
Cartilage Site Trochlea
In contrast to the MFC and LFC, the longitudinal cartilage thickness AUC on the trochlea showed no major, consistent differences among the 3 different species ( Fig. 5B ), with the highest thickness values for goat and sheep in the most proximal regions 13 and 14 (≥780 µm; Table 2 ). In contrast, the cartilage thickness in the three regions analyzed in the mini-pig trochlea did not exceed 500 µm ( Table 2 ).
Interestingly, the transversal trochlea thickness profile in all species showed 3 peaks at the measuring points 2, 7 to 9, and 14 ( Fig. 6E-I ), which are associated with anatomical structures of the trochlea, that is, medial trochlear ridge, deepest point of the trochlear groove, and lateral trochlear ridge ( Figs. 1B , D , and G and 2B ).
Discussion
Cartilage thickness on the potential defect sites MFC, LFC, and trochlea in the stifle joint was systematically mapped in sheep, goat, and mini-pig to assess their anatomical suitability as preclinical large animal models for cartilage repair and regeneration studies. Histological analyses of paraffin sections showed remarkable differences in cartilage thickness among the different experimental sites and across species.
While the present values in sheep stifle joints were within the range of those reported in previous studies for the MFC (range 600-1680 µm), LFC (550-800 µm), and trochlea (667-800 µm12,15,16,19-22), the present study provides the first systematic, detailed 3-dimensional mapping of the cartilage thickness in these potential implant sites for experimental surgery. Also, the present study for the first time provides a systematic evaluation of cartilage thickness on the LFC, since the thus-far published reviews mostly focus on the MFC.10-12
Experimental Cartilage Site MFC
The goat was identified as the animal model with the thickest articular cartilage on the MFC (maximal mean cartilage thickness: 1299 µm), closely followed by the sheep (1096 µm) and, with a larger difference, the mini-pig (604 µm). This was observed in all longitudinal regions, with the highest values in the most ventral region 1 and the most dorsal region 6 of the caprine and ovine MFC. Based on high cartilage thickness and easy surgical access, the MFC in these species appears to be the most attractive site to place cartilage defects.
The majority of the in vivo studies in sheep24-27 and goats28-31 have used the MFC on the basis of its well-developed articular cartilage, either alone or in combination with other implantation sites. 10 The finding that the caprine MFC carries thicker cartilage than the ovine MFC agrees with reports on a thickness of 0.8 to 2.0 mm in goats and a thickness of 0.4 to 1.0 mm in sheep.10,12,32,33 However, in the human knee joint the cartilage thickness of the MFC ranges from 2.2-2.5 mm 12 to 3.5 mm. 18 As a consequence, particular fixation methods for cartilage implants (e.g., fibrinogen glue or resorbable sutures and resorbable pins) may be difficult or impossible to use in sheep or goats and methods such as transosseous fixation may be required (unpublished data). This emphasizes the importance of adequate cartilage thickness for optimal implant fixation in chondral or osteochondral defects.34-36
Individual studies have reported a cartilage thickness ≥2.0 mm on the porcine MFC, however, with concerns regarding the young age of the animals (3-6 months) and the possible immaturity of the epiphyseal growth plate.37,38 To the best of our knowledge, the current study demonstrates for the first time that the mini-pig MFC shows consistently lower thickness values than goat or sheep MFC, which may be at least partially based on the known relationship between body weight and cartilage thickness. 16
In general, the relatively thick cartilage of the MFC in the large animals sheep and goat is regarded as a major advantage in comparison with small animal models, rendering these 2 large animal species (in addition to well-established horse models; see below) more representative of humans. In addition, large animals are closer to humans in body weight (sheep, 60-95 kg; goats, 40-75 kg; mini-pigs, 40-50 kg; human, average of 62 kg), show a joint anatomy very similar to humans, and provide the opportunity to perform a second-look arthroscopy. Of the 3 species investigated in the present study, the sheep appears preferable, since homogeneous sheep herds are easily available and sheep housing is uncomplicated and inexpensive, whereas the availability of homogeneous goat herds is limited (at least in Europe 10 ). Also, mini-pigs are more difficult to handle and have complex housing requirements, thus they are used less frequently as animal models for cartilage repair research.11,13,38,39 Finally, sheep (and goats) have an acquisition cost of 150 to 220 euro per animal and are thus less expensive than mini-pigs, which cost 1600 euro per animal (information kindly provided by the Institute of Laboratory Animal Sciences and Welfare, Jena University Hospital).
This is also in agreement with the EMA guidelines for preclinical cartilage regeneration studies, which suggest large animal models such as sheep, goat, (mini)-pig or horse. The horse is the largest in vivo model used in preclinical studies.40-42 Similar to humans, horses show a cartilage thickness on their MFC ranging from 1.5 mm to more than 3.0 mm.12,18 Moreover, the large joint anatomy and well-developed surgical techniques for cartilage injuries in the equine model provide the closest approximation to human, but horses also require comprehensive facilities for housing and surgery and pose more complex ethical issues.10,43,44
Concerning the most suitable experimental regions of the MFC in goat and sheep, maximal cartilage thickness was observed in the most ventral and most dorsal longitudinal regions 1 and 6 (compare with the heat map in Fig. 7 ). In the transversal direction, maximal cartilage thickness was localized in the center of the MFC (points 5-7), suggesting that the central ridge of the MFC in its maximally accessible longitudinal extension during minimally invasive surgery may be the best location for intraoperatively created experimental cartilage defects. 14
Experimental Cartilage Site LFC
The
Experimental Cartilage Site Trochlea
Notably, there were no clear and consistent differences among the three animal species concerning the regional cartilage thickness of the trochlea, indicating that sheep, goat, and mini-pig may be equivalent for this experimental defect site. Similar to the defect sites MFC and LFC, the highest cartilage thickness on the trochlea was measured in the most proximal regions 13 and 14 (≥780 µm for goat and sheep; ≤500 µm for regions 15, 17, and 19 in the mini-pig). On the other hand, in all species the cartilage thickness was considerably lower than that on the MFC and LFC.
Despite this fact, the femoral trochlea has been frequently applied for cartilage defect studies in sheep, goat, and mini-pig.13,39,49-52 In the present study, maximum cartilage thickness was observed in the center groove and the medial and lateral trochlear ridge of the trochlea, which, due to their anatomical characteristics, are not suitable for cartilage defect studies. Instead, cartilage defects are usually created in the area between the trochlear groove and the ridges. One advantage of the trochlea compared with the condyles is its large surface area, which allows the generation of multiple chondral or osteochondral defects or different implant fixation techniques.13,39,53 Based on the present thickness data, the proximal part of the trochlea may be the preferred site for experimental chondral or osteochondral defects.
In addition to the parameter cartilage thickness, the choice of an animal model for cartilage repair studies should also consider differences of the mechanical properties of the articular cartilage.17,37,54 For example, Taylor et al. 54 comparatively characterized the mechanical properties of human, porcine, bovine, and ovine articular cartilage from the femoral head applying creep indentation and a biphasic finite element model. They showed that the elastic modulus and permeability of the ovine cartilage were most similar to those of human, emphasizing the importance of such variations for the choice of the animal and possibly providing yet another argument in favor of the high suitability of the sheep model.
Limitations of the Study
In contrast to a previous study, 12 which histologically mapped articular cartilage thickness in human, equine, rabbit, dog, sheep, and goat, the present study only comparatively analyzed sheep, goat, and, for the first time, mini-pig, but lacked a direct comparison with horse (considered the “gold standard” model for articular cartilage repair studies), or humans. However, the systematic mapping (and its software-based visualization) and the good comparability of the current sheep and goat data with previous reports indicate the high suitability of the present models.
As an additional limitation, systematic underestimation of the cartilage thickness by histology cannot totally be excluded, since paraformaldehyde fixation, decalcification, and, in particular, alcohol dehydration as an inherent step of the preparation technique for paraffin sections may result in lower thickness values. However, the current thickness values in sheep for MFC and LFC (931 µm and 617 µm; mean of the regions 1-6 and 7-12, respectively) were close to those obtained by the “gold standard” method needle indentation (1140 µm and 780 µm), 19 and thus the present analysis of defect sites and their experimental suitability appears reliable. In addition, a very comprehensive study comparing needle penetration, micro-computed tomography (micro-CT), and cryosection histology for the assessment of cartilage thickness in the porcine temporomandibular joint considered histology the gold standard, since needle penetration may overestimate thickness by penetrating the first, less-mineralized layer of subchondral bone. 55 Finally, technically easy and inexpensive histology may be more practicable and broadly applicable for diagnostic purposes than more specialized techniques such as needle indentation, underscoring the usefulness of the present data.
Conclusion
The choice of a suitable animal model is pivotal for preclinical cartilage repair studies, including the aspect of an adequate cartilage thickness for optimal implant fixation in chondral or osteochondral defects. In the present study, the central ridge of the ovine and caprine MFC in its maximal ventral-dorsal extension accessible during minimally invasive surgery was identified as the site with the thickest cartilage and thus the best experimental suitability for defect studies.
Based on their low cost, uncomplicated housing requirements, and a higher similarity of their cartilage thickness with humans, sheep and goat seem to represent well-suited large animal models. However, ethical issues and the specific focus of each individual study must also be taken into consideration.
Footnotes
Acknowledgments and Funding
The author(s) received no financial support for the research, authorship, and/or publication of this article.
Declaration of Conflicting Interests
The author(s) declared no potential conflicts of interest with respect to the research, authorship, and/or publication of this article.
Animal Welfare
The present study followed international, national, and/or institutional guidelines for humane animal treatment and complied with relevant legislation.