
Abstract
Objective
The aim of this study was to investigate the roles of SMURF1 and SMURF2 in progenitor cells from the human knee in late-stage osteoarthritis (OA).
Design
We applied immunohistochemistry, immunocytochemistry, RNAi, lentiviral transfection, and Western blot analysis. We obtained chondrogenic progenitor cells (CPCs) from the articular cartilage and meniscus progenitor cells (MPCs) from the nonvascularized part of the meniscus.
Results
SMURF1 and SMURF2 appeared in both osteoarthritic tissues. CPCs and MPCs exhibited comparable amounts of these proteins, which influence the balance between RUNX2 and SOX9. The overexpression of SMURF1 reduced the levels of RUNX2, SOX9, and TGFBR1. The overexpression of SMURF2 also reduced the levels of RUNX2 and TGFBR1, while SOX9 levels were not affected. The knockdown of SMURF1 had no effect on RUNX2, SOX9, or TGFBR1. The knockdown of SMURF2 enhanced RUNX2 and SOX9 levels in CPCs. The respective protein levels in MPCs were not affected.
Conclusions
This study shows that SMURF1 and SMURF2 are regulatory players for the expression of the major regulator transcription factors RUNX2 and SOX9 in CPCs and MPCs. Our novel findings may help elucidate new treatment strategies for cartilage regeneration.
Introduction
Osteoarthritis (OA) is the most common musculoskeletal disease. 1 It is estimated that 78.4 million adults in the United States will suffer from OA by the year 2040. 2 During skeletal movement of the knee, articular cartilage and menisci are responsible for the smooth transmission of forces within the joint. 3 Healthy cartilage is a connective tissue with chondrocytes embedded in a framework of collagens. 4 Proteoglycans 5 and glycoproteins 6 are associated with collagen fibrils and work to stabilize the extracellular matrix. This unique structural organization is responsible for the biomechanical properties of cartilage, including tensile strength, and resistance to compression and shear stress. 7 Chondrocytes in healthy cartilage rely on cell-matrix interactions. 8 The meniscus reveals differences compared with articular cartilage. It is best described as a fibrocartilage 9 comprising vascularized and nonvascularized regions. 10 Disturbed cell-matrix interactions play an important role during the initiation of OA, leading to the loss of the superficial cartilage zone. Eventually, deep surface fissures, extracellular matrix degradation, collagen fiber fibrillation, and a shift in the collagen composition occur. 11 Furthermore, chondrocyte clusters are observed during late stages of OA. 12 The imbalance between cartilage degradation and matrix synthesis ultimately results in a complete loss of joint function. 3
Treatment options for articular cartilage in early stages of OA, such as Pridie drilling and microfracturing to open the bone marrow underneath the cartilage defect, can sometimes encourage the formation of fibrocartilaginous tissue repair.13,14 The meniscus is especially the focus of surgical interventions. There are several meniscus repair techniques via arthroscopy.15,16 However, there is still a deficit in robust meniscal repair in adults with or without surgical intervention, which has led to the development of allografts and bioengineered meniscal substitutes. 17 Unfortunately, clinical, radiological, and magnetic resonance imaging evaluations show no protection against the development of OA. 18 Almost all patients eventually require joint replacement. 15
The capacity of articular cartilage or meniscal tissue to regenerate spontaneously is limited, and extracellular matrix degradation overrides the attempts of resident chondrocytes to repair the matrix. We have already shown that chondrogenic progenitor cells (CPCs) 19 in articular cartilage and meniscus progenitor cells (MPCs) 20 in meniscal tissue drive endogenous regenerative processes in late-stage OA. These progenitor cells can be guided toward chondrogenesis via different ways, for example, by influencing the balance between RUNX2 and SOX9. SMURF1 is known to block intracellular bone morphogenetic protein (BMP) signals by specifically targeting SMAD1 and SMAD5 for ubiquitination and proteasomal degradation. 21 There is evidence that SMURF1 supports SMAD6 function in murine cartilage in vivo. 22 SMURF2 interacts with SMAD2 and the complex targets SNON for degradation. 23 Experiments with SMURF2 knockout mice indicate that SMURF2 is involved in the pathogenesis of OA. 24 Here, we investigate the roles of SMURF1 and SMURF2 in CPCs and MPCs.
Materials and Methods
Tissue Sources
Adult articular cartilage and meniscus were obtained from the knee joints of patients suffering from late-stage OA after total knee replacement. Articular cartilage samples were classified histopathologically by Osteoarthritis Research Society International standards25,26 and prepared as described elsewhere. 19 From 3 patients (2 male, 1 female, mean age 69.3 years), we included samples from the lateral condyle of the knee joint collected from regions directly adjacent to the main defect with grade 4.0 to 4.525,26 for the present investigation. Meniscus samples were classified according to a score previously published by our work group based on existing grading systems. 20 The presence (1 point) or absence (2 points) of the superficial zone and the intensity of Alcian blue staining (high = 1 point or low = 2 points) were used for evaluations. The presence of fatty degeneration and/or cell clusters (2 points) or the presence of calcifications (3 points) was also included. The score ranges from a minimum of 2 points to a maximum of 9 points. The threshold for inclusion was set to 4 points. We included samples from 3 patients (1 male, 2 female, mean age 65.0 years) into our study. The patients gave their written informed consent consistent with the relevant ethical regulations of our institution.
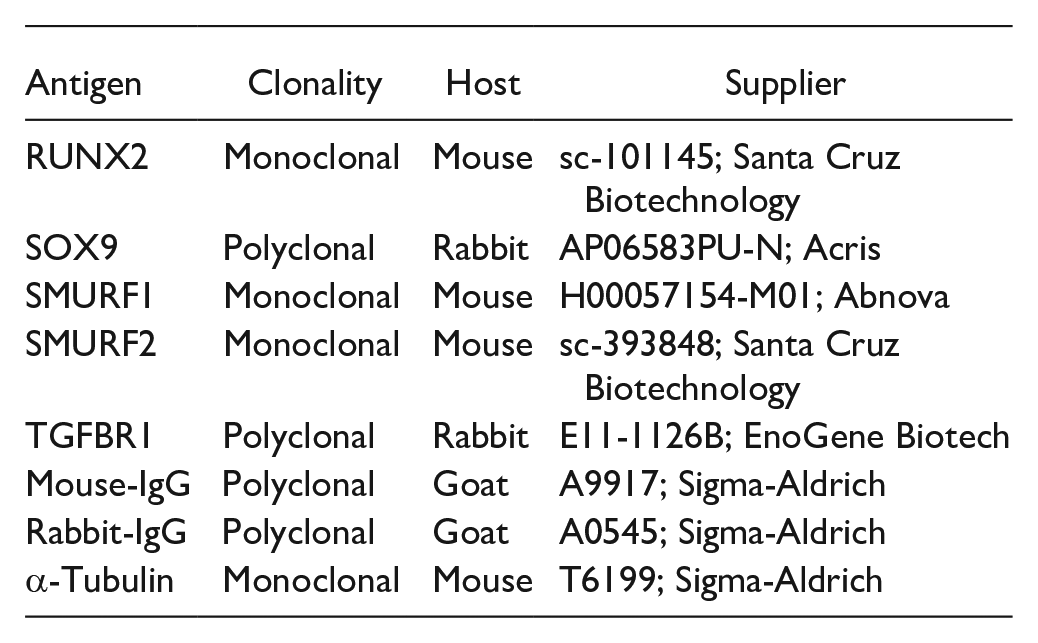
Antibodies
Antibody immunoreactions were performed without primary antibodies as negative controls, and all experimental data are representative of 3 individual experiments. The following antibodies were used:
Tissue Preparation
For light microscopy, 15 mm × 15 mm samples were fixed in formalin according to Lillie and Henderson 27 for 6 hours at 4 °C followed by washing for 15 minutes in running water. Briefly, decalcification was performed with 20% buffered EDTA (ethylenediaminetetraacetic acid) for 3 weeks. Dehydration and embedding in paraffin were performed with a Tissue Processor (165621-46; Shandon Duplex) according to the manufacturer’s instructions. Six-micrometer sections were cut using a Biocut Microtome (2035; Leica Instruments). Samples were fixed on microscope slides (AAAA000001##12E; Thermo Scientific).
Immunohistochemistry
After each of the following reactions, 3 washing steps for 10 minutes each in Tris-buffered saline (TBS) were performed. Tissue slides were deparaffinized, rehydrated, and rinsed for 10 minutes in TBS. Endogenous phosphatase was blocked by a 30-minute treatment with Universal Block (71-00-61; Seracare). Epitope retrieval of the sections was achieved with ProTaqs (401603499; Quartett) for 20 minutes at 60 °C. The slides were treated for 5 minutes with 10 μg/mL protease XXIV (P8038; Sigma-Aldrich). Blocking was performed with 1% bovine serum albumin (BSA) in TBS for 10 minutes. Primary antibodies were applied at a dilution of 1:100 in TBS for 12 hours at room temperature. Visualization of antigens was performed with HiDef Detection Alk Phos Polymer System (962D-30; CellMarque) according to the manufacturer’s instructions. Two types of negative controls were performed. One control was achieved by using secondary antibodies only. In the other control, the primary antibodies were replaced by the respective iso-immunoglobulins.
Cell Isolation and Culture
Standard explant cultures were performed as described previously for CPCs
19
and MPCs.
20
Briefly, the specimens were washed carefully 3 times for 1 minute with phosphate-buffered saline (PBS). After the washing process, each tissue sample was added to a cell culture dish with Dulbecco’s modified Eagle’s medium (DMEM; 21885-025; Invitrogen) with 10% fetal bovine serum (10270; Invitrogen) supplemented with 50 µg/mL gentamycin and 10 mM
Immortalization of CPCs and MPCs
Immortalization was performed as previously described. 28
Virus Production
A total of 5 × 10⁵ 293T-cells (ACC635, DSMZ) were seeded into a dish (diameter = 10 cm) and grown to 80% confluence. 10 μg of the hTERT lentiviral plasmid (Amsbio) and 10 μg of the packaging plasmid mixture (LV053, ABM) were mixed with 1 mL of DMEM. Eighty microliters of lentifectin (G074, ABM) were mixed with 1 mL of DMEM. Both solutions were incubated at room temperature for 5 minutes, and then mixed to allow the transfection complex to form. After 20 minutes, 4.5 mL of DMEM were added to the transfection complex, which was pipetted onto the cells and 0.65 mL of heat-inactivated fetal calf serum (FCS) was added after 6 hours. On the next day, the medium was removed and 10 mL of DMEM was added. After 48 hours, the supernatant with the produced virus was harvested, centrifuged, and filtered (SLHA033SB, Merck Millipore).
Transfection
A total of 1.8 × 10⁵ trypsinized CPCs or MPCs were resuspended in 3 mL of the virus supernatant and 30 μL of protamine sulfate (P3369, Sigma-Aldrich). Three wells of a 24-well plate were filled with 1 mL of that solution. After 6 hours, 1 mL of medium was added to each well. On the next day, medium and dead cells were removed, and adherent cells received another treatment with 1 mL of the virus supernatant and 10 μL of protamine sulfate per well overnight.
Selection
Infected cells were transferred to a 75 cm2 flask and selected by culture with up to 10 μg/mL blasticidin.
Immunocytochemistry
After each of the following reactions, 2 wash steps for 10 minutes each in PBS were performed. Cells at passage 4 were fixed with 2% paraformaldehyde in PBS for 15 minutes. Cells were permeabilized with the help of 0.25% Triton-X100 (X100-5ML; Sigma-Aldrich) in PBS for 10 minutes. Blocking was achieved with 1% BSA in PBS for 15 minutes. Primary antibodies were diluted according to recommendations of the supplier in 1% BSA in PBS for 1 hour at 37 °C. Secondary antibodies coupled with fluorochromes were applied at 1:500 dilution together with DAPI (71-03-01; Seracare) at 1:1000 dilution in 1% BSA in PBS for 30 minutes at 37 °C. Observation was performed via fluorescence microscope (BZ-X700; Keyence).
siRNA Transfection
For transfection of CPCs and MPCs, we used Human-MSC Nucleofactor Kit (VPE-1001; Lonza). siRNA was obtained commercially for SMURF1 (SR311389BL; OriGene) and SMURF2 (SI00134295; Qiagen). We harvested 5 × 10⁵ CPCs and MPCs at passage 4 and resuspended the cells in 100 µL of human chondrocyte nucleofector solution (VPF-1001; Lonza) with 10 µL siRNA of SMURF1 or SMURF2 at 0.2 nmol. We used pMAX-GFP (VPF-1001; Lonza) as a positive control for transfection and scrambled siRNA as a negative control. The U23-program on a Nucleofector 2b Device (AAB-1001; Lonza) was applied, and samples were mixed with 500 µL DMEM and immediately transferred to 6 preincubated wells containing 1 mL of DMEM. The culture medium was replaced the next day to remove dead cells. The cells were harvested 48 hours after transfection.
Overexpression
SMURF1 (RC222902; Amsbio) and SMURF2 (RC10866; Amsbio) plasmids with kanamycin-resistance were purchased. Enrichment of the plasmids was achieved by transformation into Escherichia coli DH5α (959758026600; Biolabs) according to the manufacturer’s instructions. Plasmid preparation was performed with help of an EndoFree Plasmid Maxi Kit (12362; Qiagen). As a control, plasmids were digested with BamH1 (10220612001; Sigma-Aldrich). Gels were prepared by dissolving 1.5 % agarose in 50 ml of Tris-EDTA buffer by boiling. After brief cooling, 3.5 μL Roti-GelStain (3865.2; Roth) was added to visualize DNA. We used 1 µg of the DNA and mixed it with loading buffer. Product size was determined using a GeneRuler 100-bp DNA Ladder (SM0241; Thermo Scientific). Sequencing was performed by Seqlab Sequence Laboratories in Göttingen. A total of 5 × 10⁵ CPCs and MPCs at passage 4 were grown to 80% confluence. A mixture of 300 µL DMEM, 4 ng plasmid DNA of SMURF1 or SMURF2, and 25 µL PolyFect Transfection Reagent (301107; Qiagen) was prepared. After 10 minutes of incubation, 1 mL DMEM was added to the solution. CPCs and MPCs were washed twice with PBS, then incubated with the prepared transfection solution for 48 hours. Successfully transfected cells were selected using kanamycin.
Immunoblotting
In total, 1.5 × 10⁵ cells were dissolved in 30 µL of 3 × SDS with 10 % β-mercaptoethanol and heated for 5 minutes at 95 °C. SDS-PAGE (sodium dodecyl sulfate–polyacrylamide gel electrophoresis) was performed with 6% acrylamide in the stacking gel and 8% acrylamide in the separation gel. After SDS-PAGE, the separated proteins were blotted onto an Immobilon-P Transfer Membrane (PVH07850; Merck Millipore). General detection of the proteins was performed with Coomassie blue staining. After destaining, the membranes were blocked with 5% milk powder in TBS-T for 1 hour followed by 5 washing steps with TBS-T. Then, primary antibodies were dissolved in 5% milk powder in TBS-T according to the dilution instructions of the manufacturer and incubated for 12 hours at 4 °C. Again, 5 washing steps were performed. Then, secondary antibodies were incubated for 2 hours at room temperature, followed by 5 washing steps. Visualization of the proteins was achieved by applying WesternBright Sirius HRP substrate (K-12043-D10; Advansta). Exposed X-ray films were scanned for digitalization and densitometry was performed for quantification of immunoblot lanes using ImageJ (open source software, National Institutes of Health). α-Tubulin was used for normalization. Membranes were stained consecutively for different antibodies with different molecular weights. This procedure may lead to unspecific binding in regions where formerly used antibodies were bound. 29 Using a protein ladder, we only quantified the respective band identifying the correct protein.
Statistical Analysis
We report representative data from at least 3 independent experiments performed on 3 biological replicates of CPCs and MPCs. The immunoblotting results are reported as the mean values and standard deviations; numbers indicate fold change. After testing for normal distribution, we performed Student t tests. Pearson correlation coefficients were calculated. A P value ≤0.05 was considered statistically significant.
Results
SMURF1 and SMURF2 In Vivo
SMURF1 and SMURF2 were identified via immunohistochemistry in human chondrocytes of the articular cartilage and the meniscus obtained from patients with late-stage OA. In all zones of the meniscus and in superficial zones of the articular cartilage, chondrocytes showed SMURF1 and SMURF2 expression (
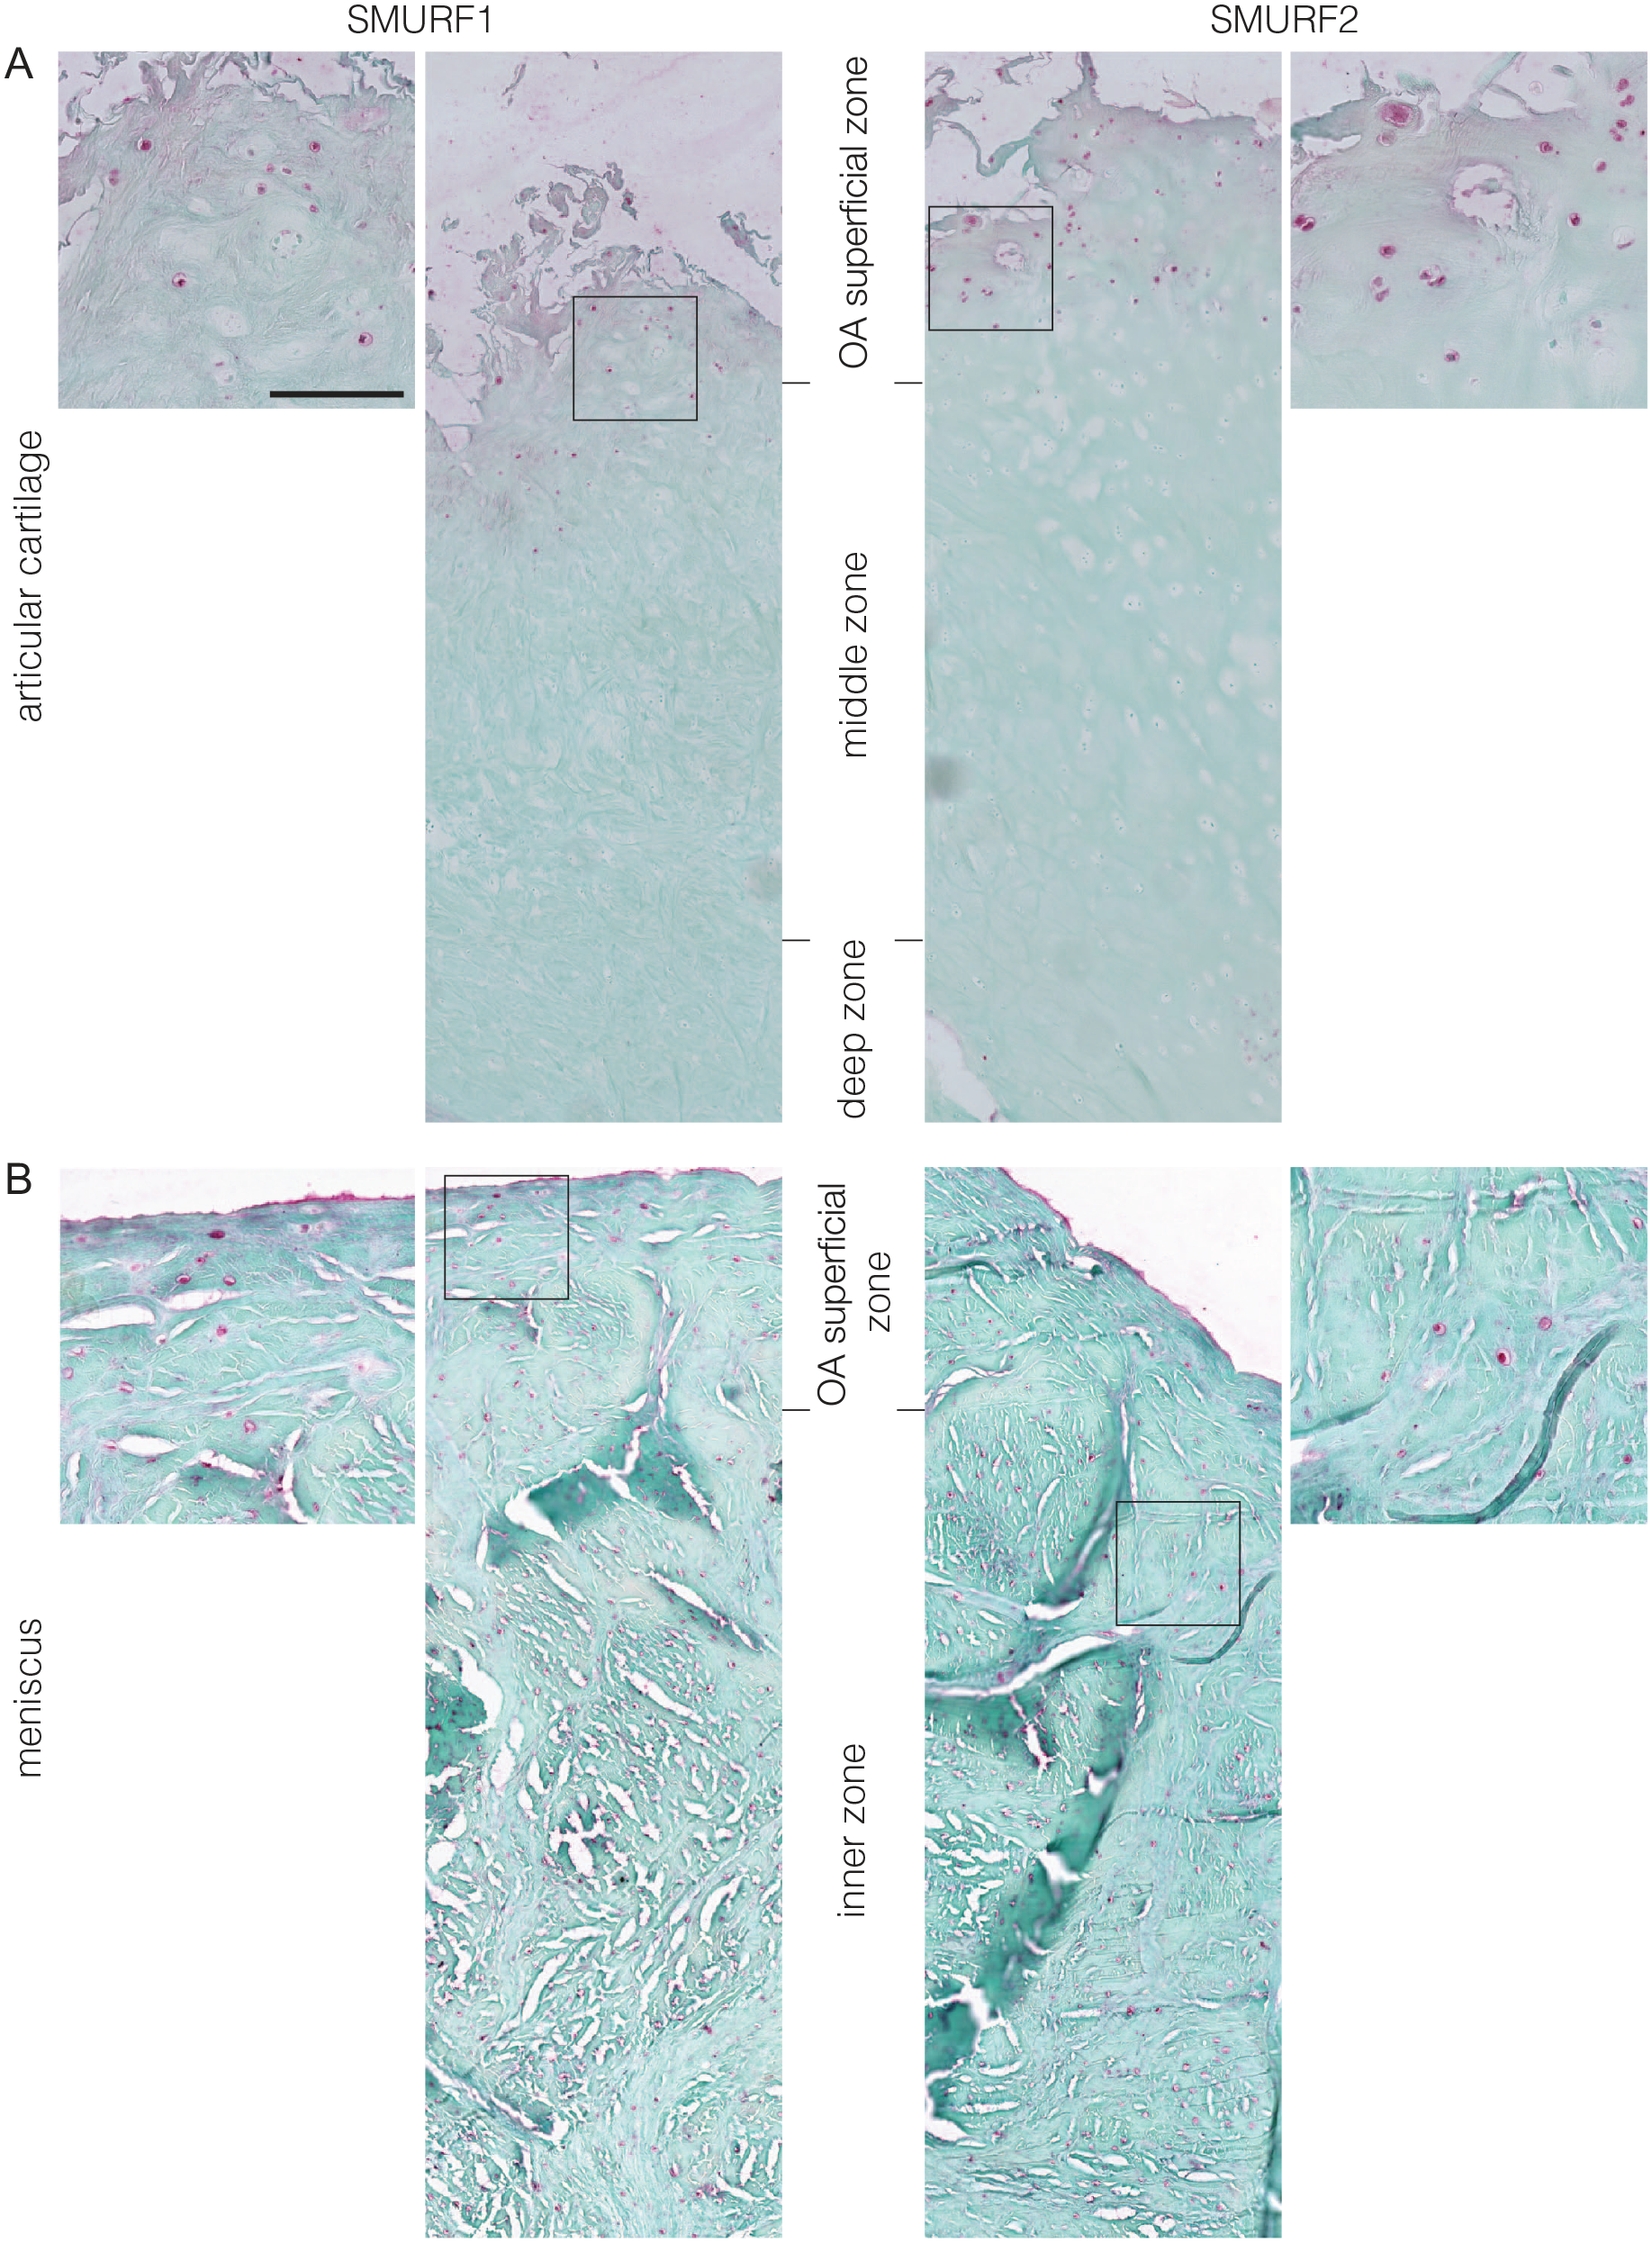
Immunohistochemistry of SMURF1 and SMURF2 in human specimens of osteoarthritis (OA) tissues from late-stage OA. The middle panels show overviews of the respective tissue, the outer panels show details; scale bars equal 100 µm in the overviews and 25 µm in the details. (
SMURF1 and SMURF2 In Vitro
Using immunocytochemistry, the isolated CPCs from the articular cartilage and MPCs from the meniscus showed staining for SMURF1 and SMURF2 in the cytoplasm and in the nucleus (
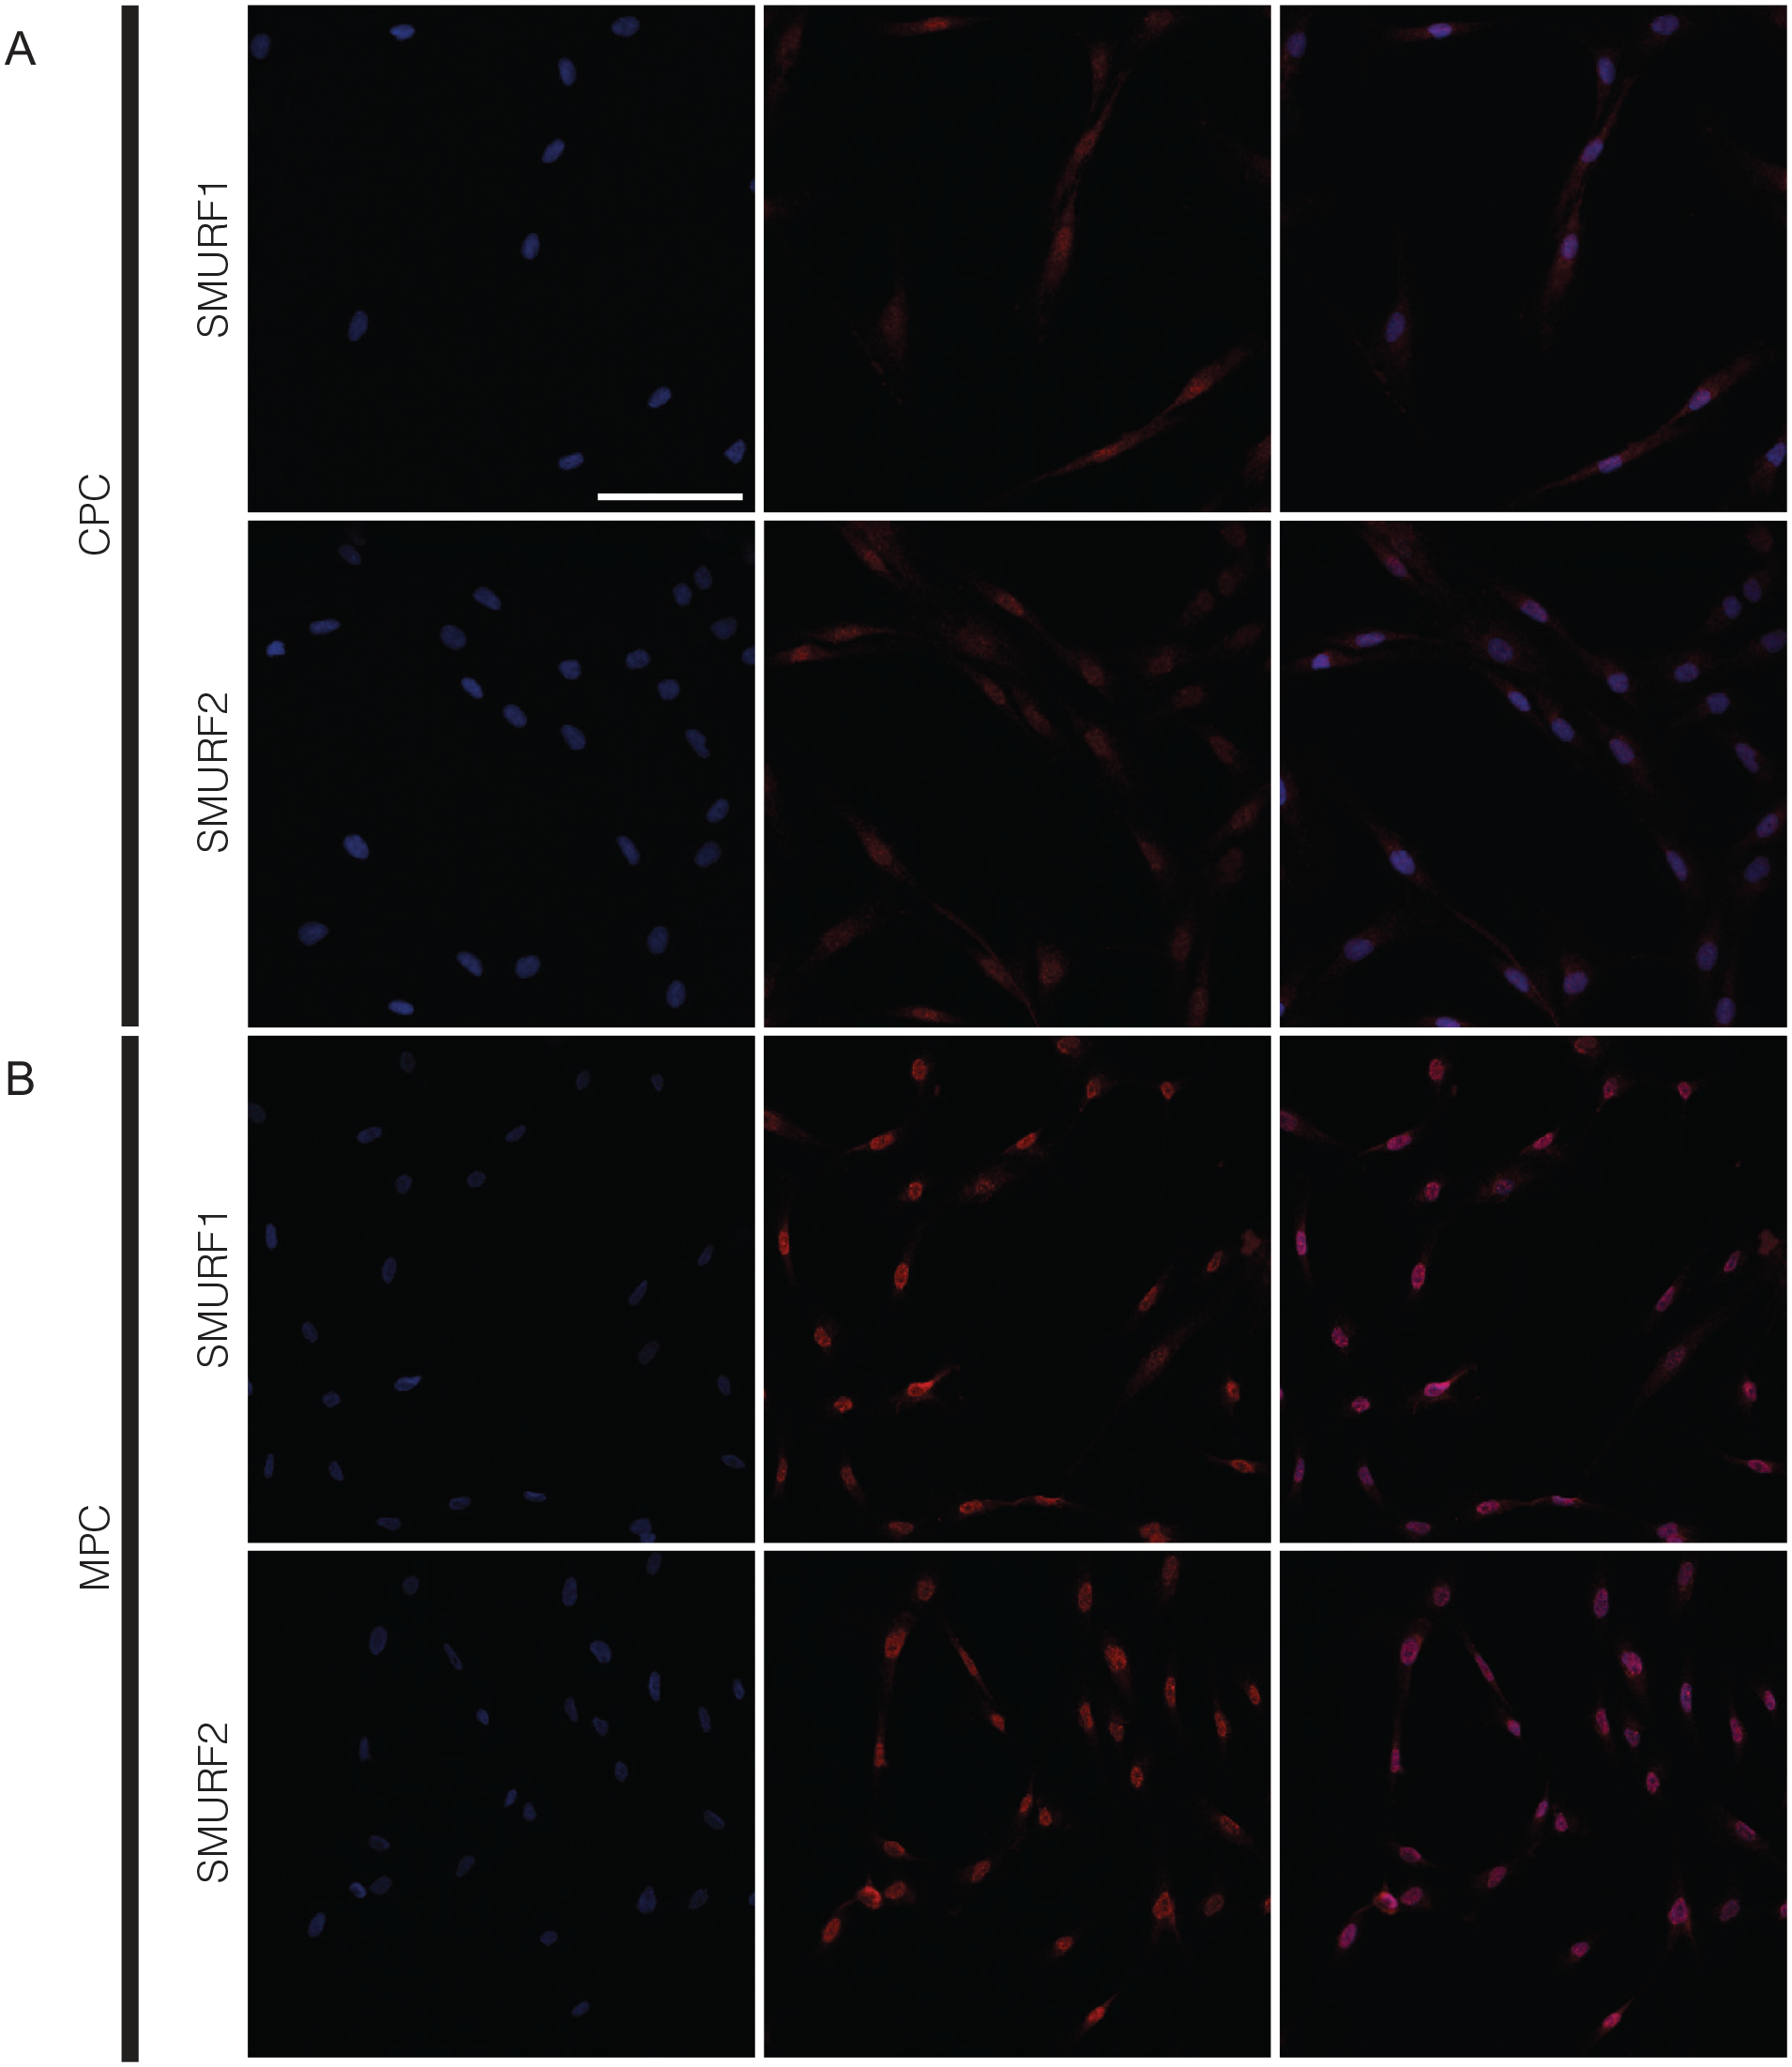
Immunocytochemistry for SMURF1 and SMURF2 in chondrogenic progenitor cells (CPCs) and meniscus progenitor cells (MPCs) in vitro. In (
Overexpression of SMURF1
We overexpressed SMURF1 in CPCs and in MPCs; the successful overexpression of SMURF1 was shown using immunoblotting. As a result, RUNX2 expression was significantly decreased in CPCs and MPCs. A slight, but not significant reduction of SOX9 occurred in CPCs, a significant reduction occurred in MPCs. The receptor TGFBR1 was significantly reduced in CPCs and in MPCs (
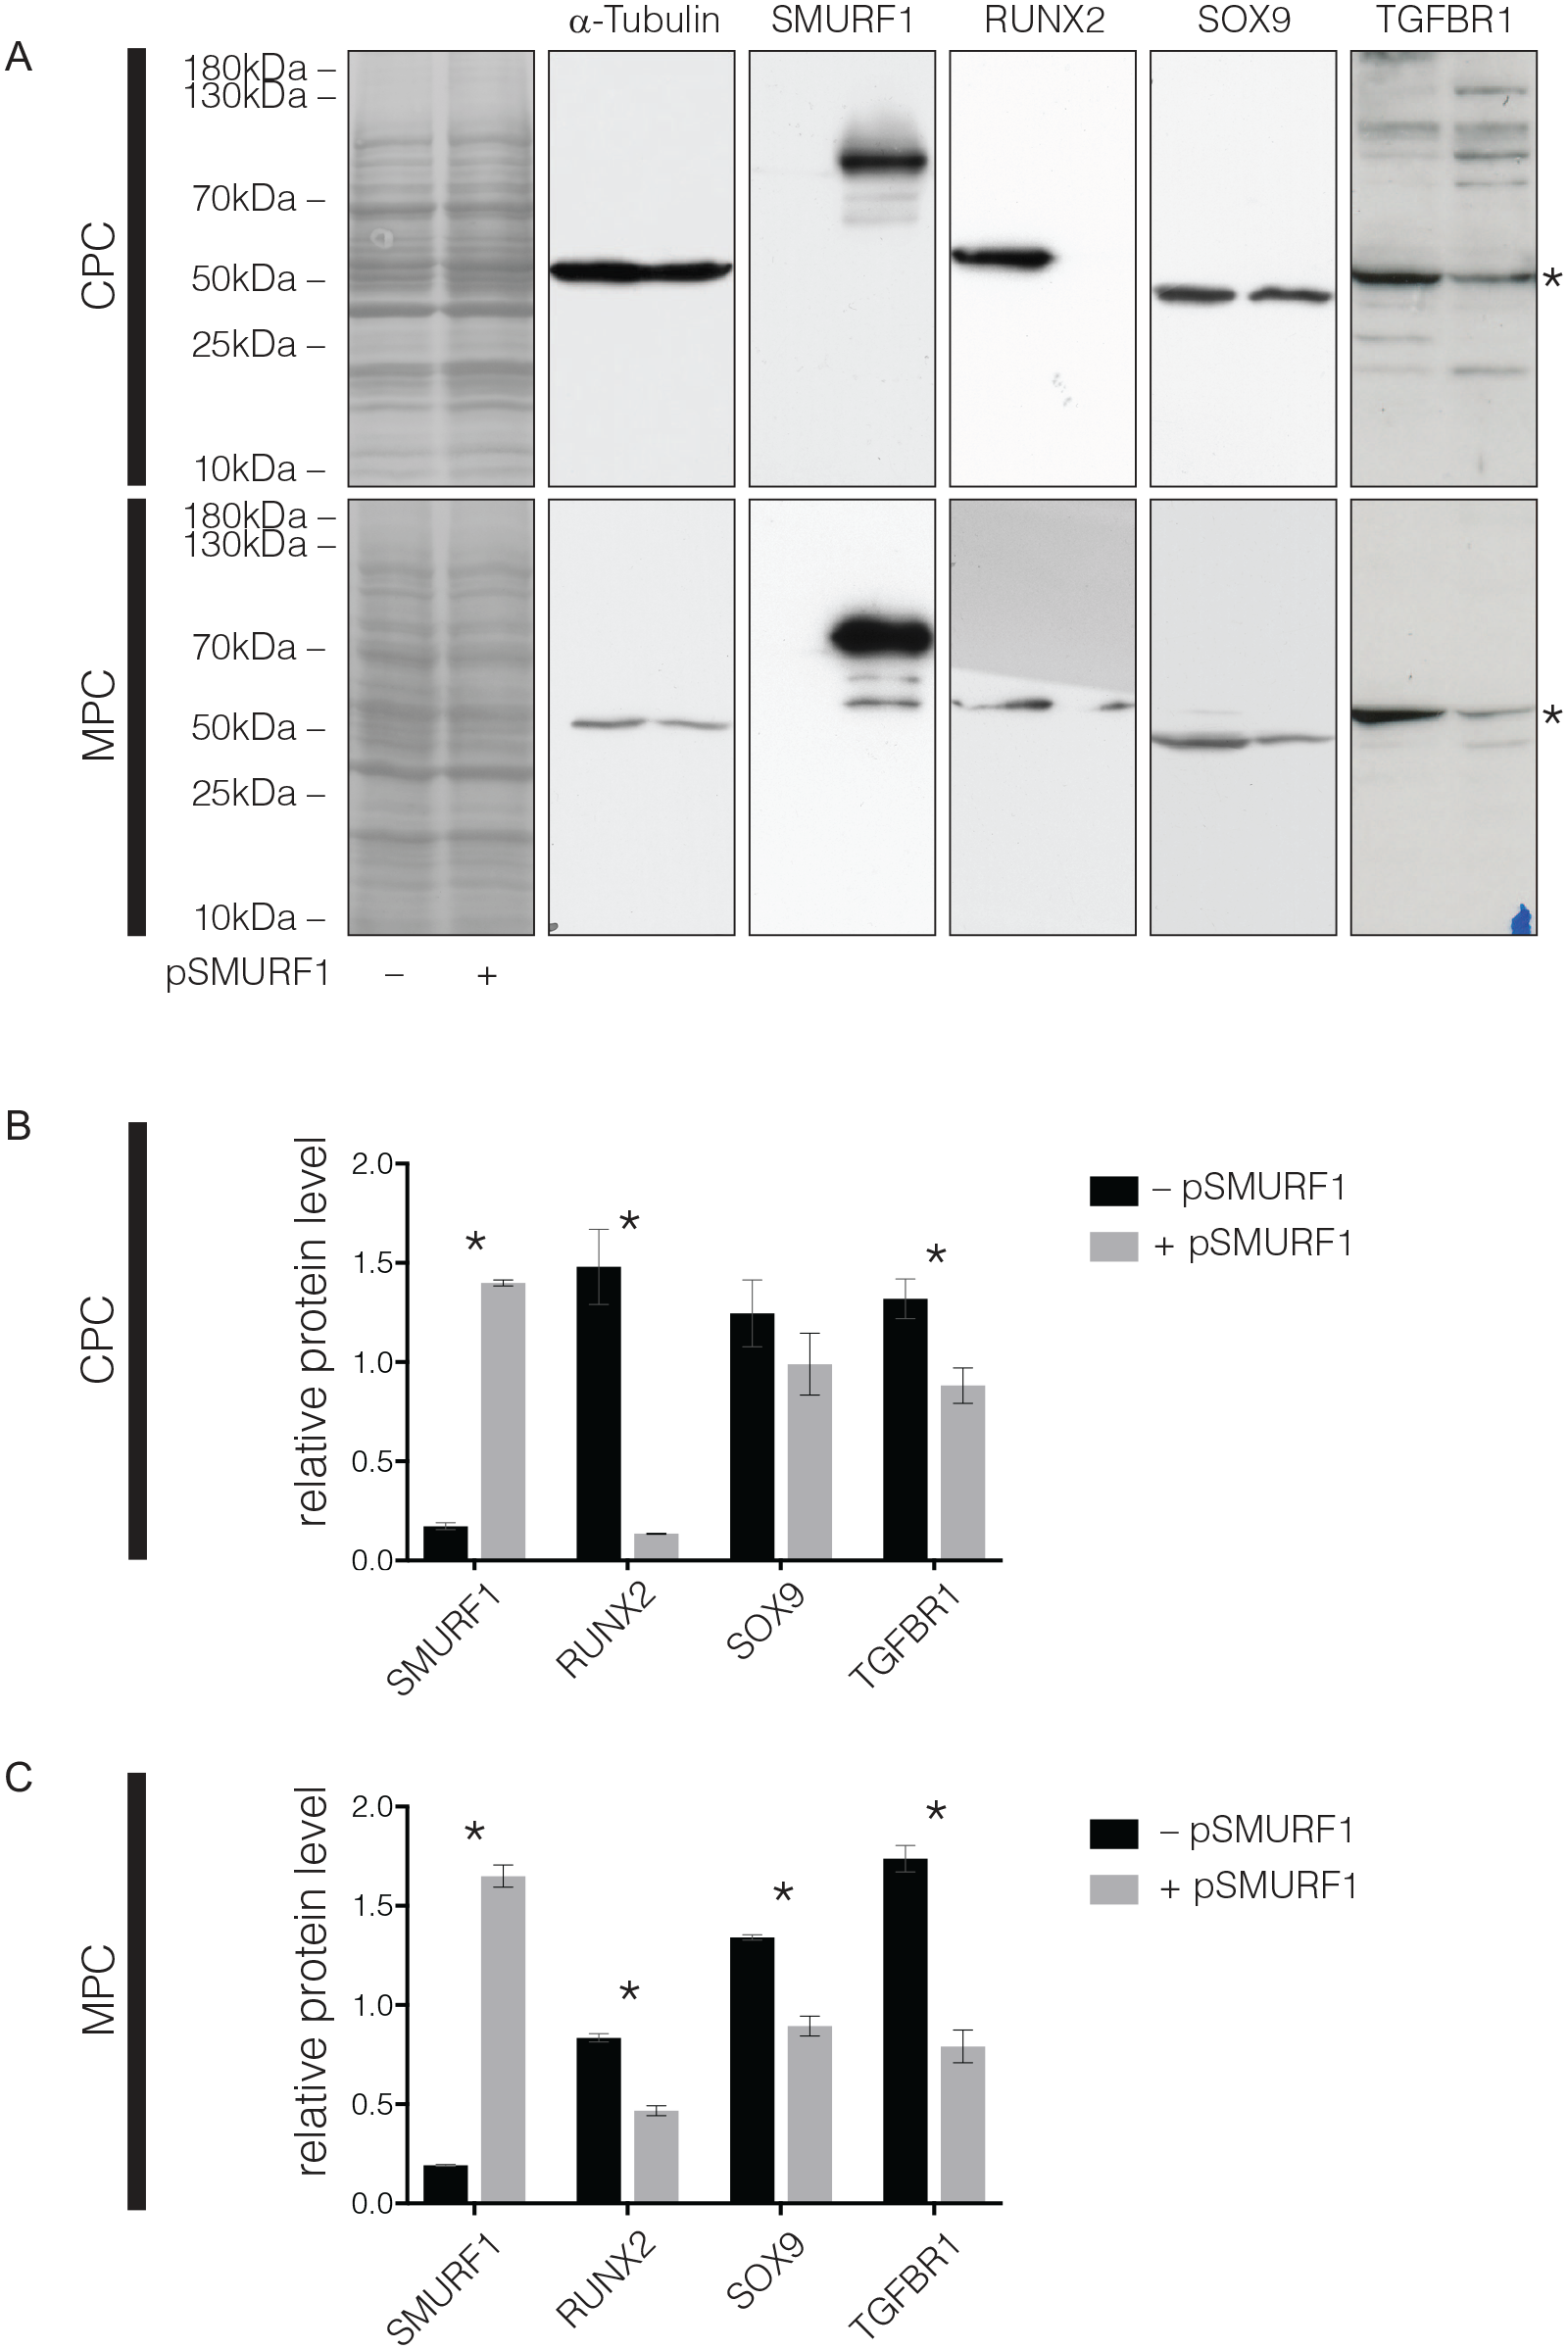
Immunoblotting results for the overexpression of SMURF1 in chondrogenic progenitor cells (CPCs) and meniscus progenitor cells (MPCs). (
Overexpression of SMURF2
Immunoblotting showed that SMURF2 overexpression resulted in a significantly decreased expression of RUNX2 in CPCs and MPCs, while SOX9 levels were not affected. As for SMURF1, TGFBR1 levels were reduced in CPCs and MPCs via the overexpression of SMURF2 (
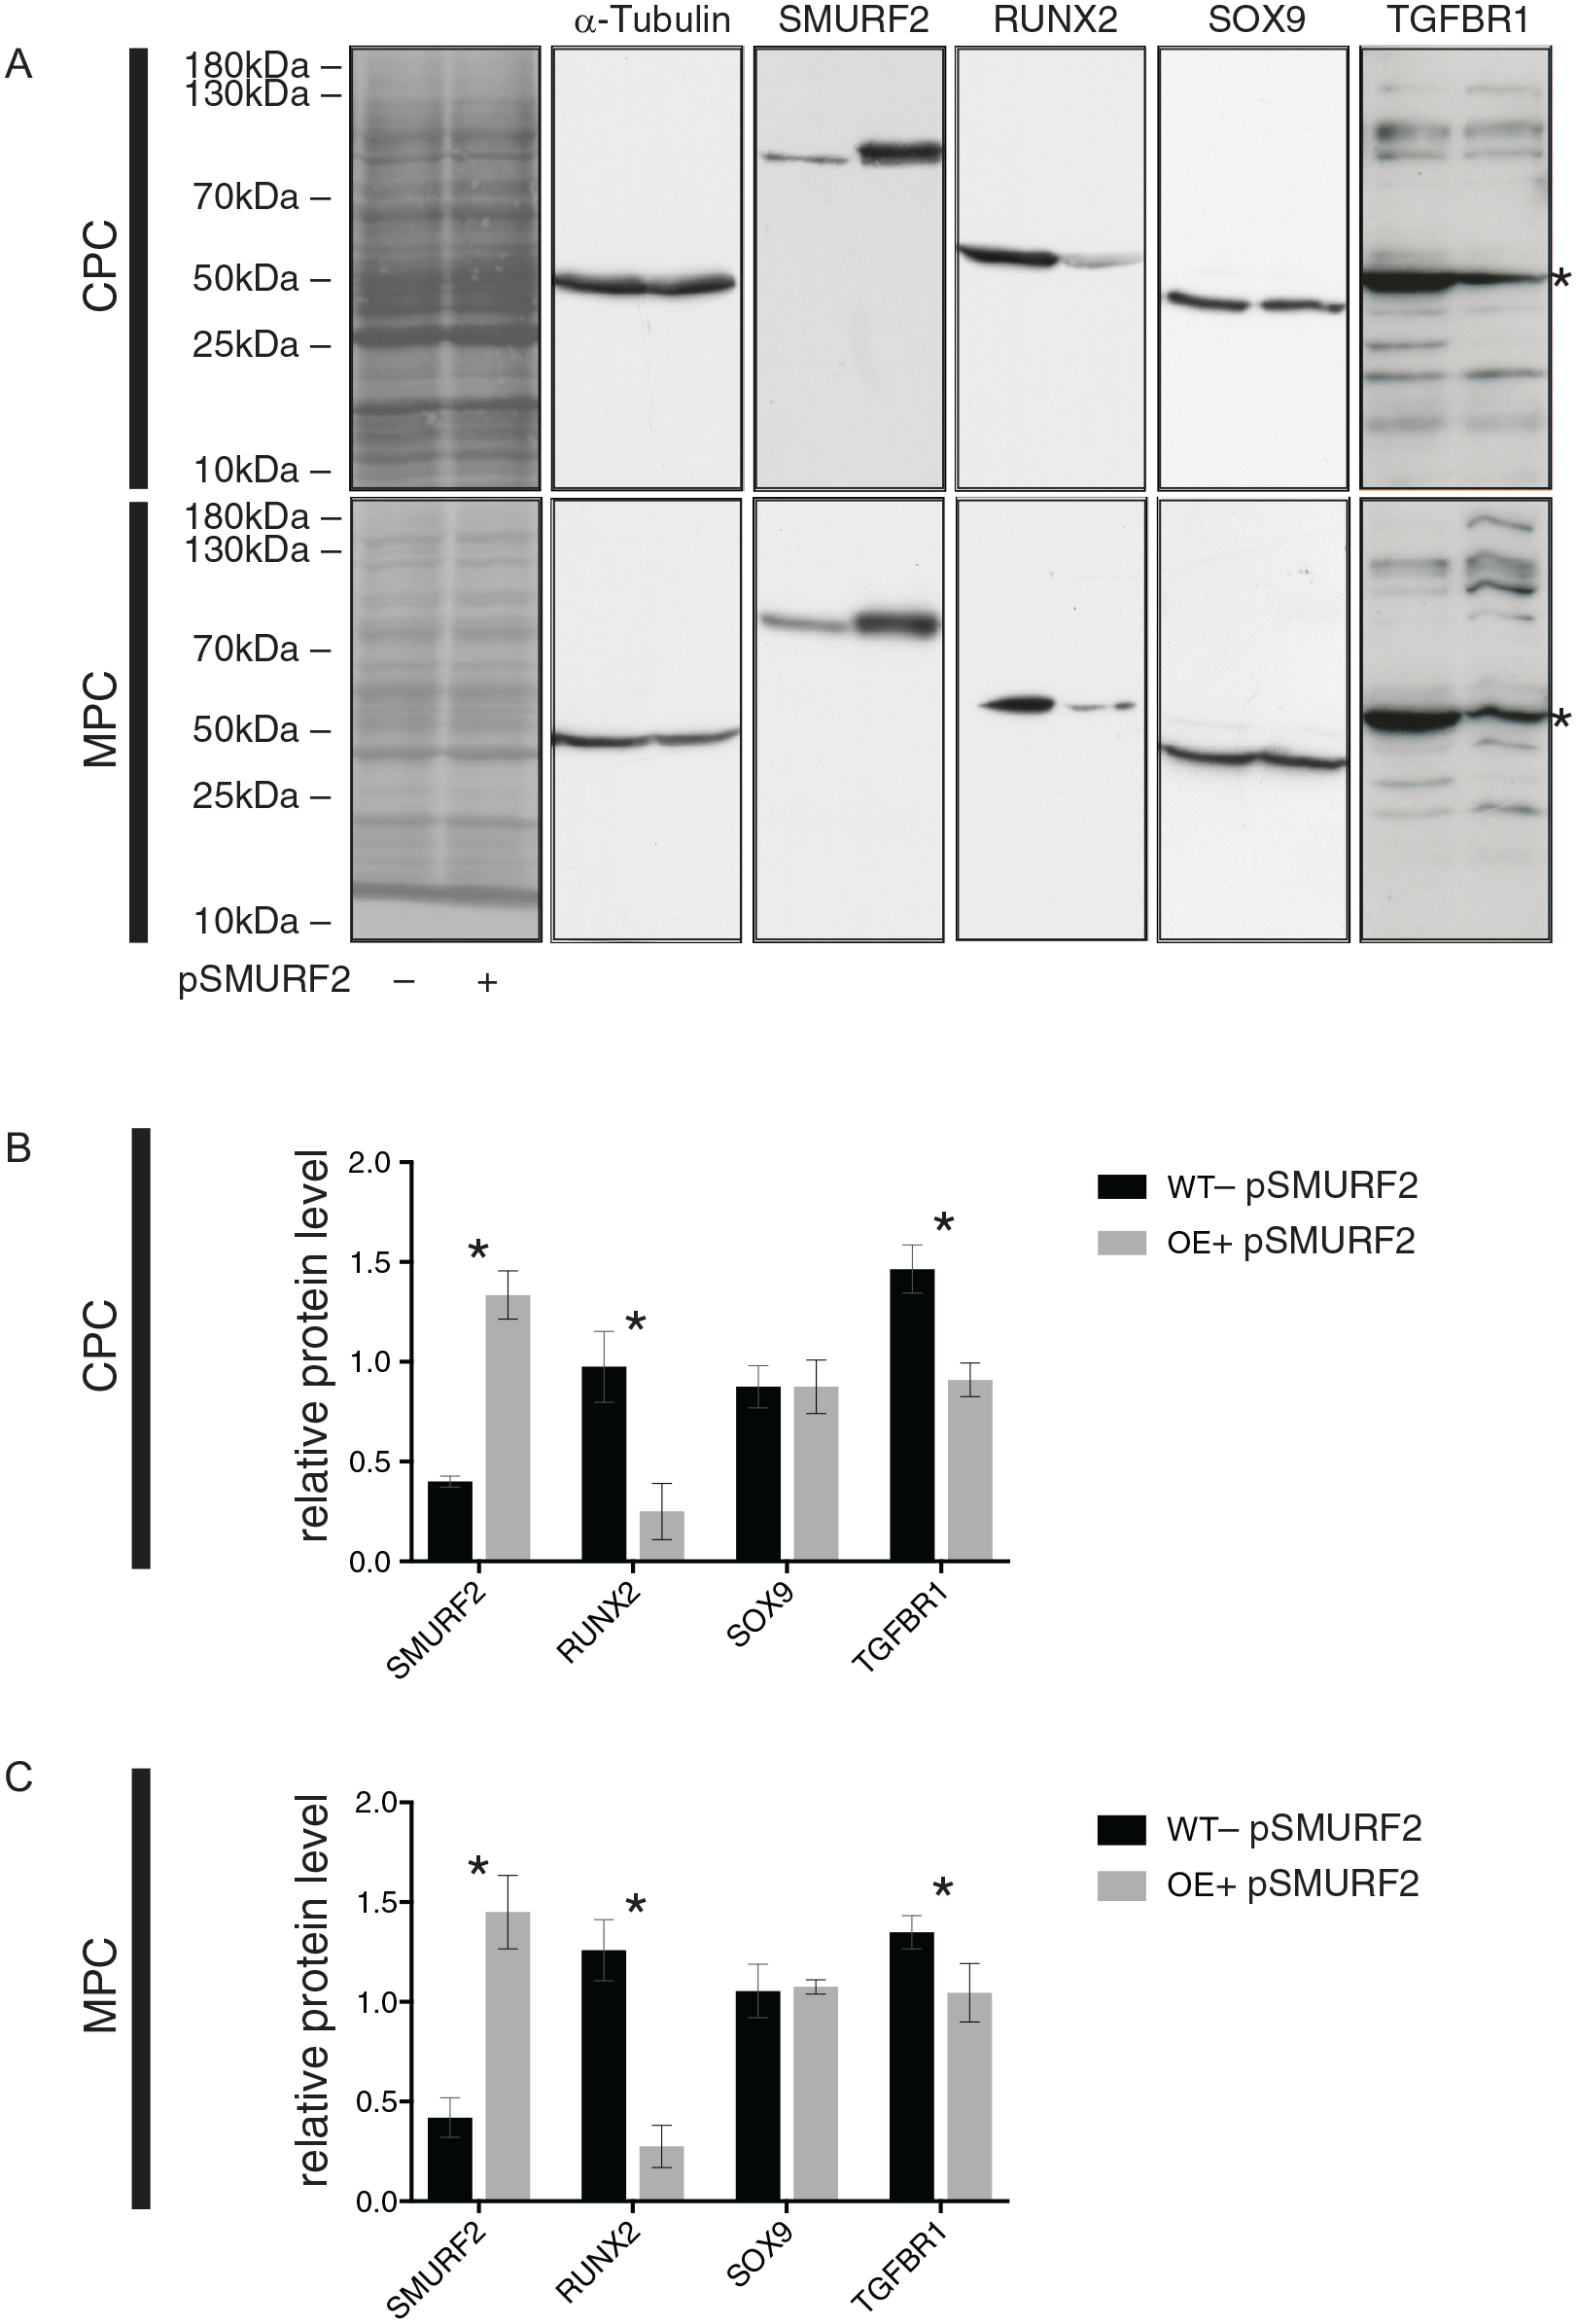
Immunoblotting results for the overexpression of SMURF2 in chondrogenic progenitor cells (CPCs) and meniscus progenitor cells (MPCs). (
RNAi Knockdown of SMURF1
The SMURF1 knockdown had no significant effect on the protein levels of RUNX2, SOX9, or TGFBR1 in CPCs and MPCs (
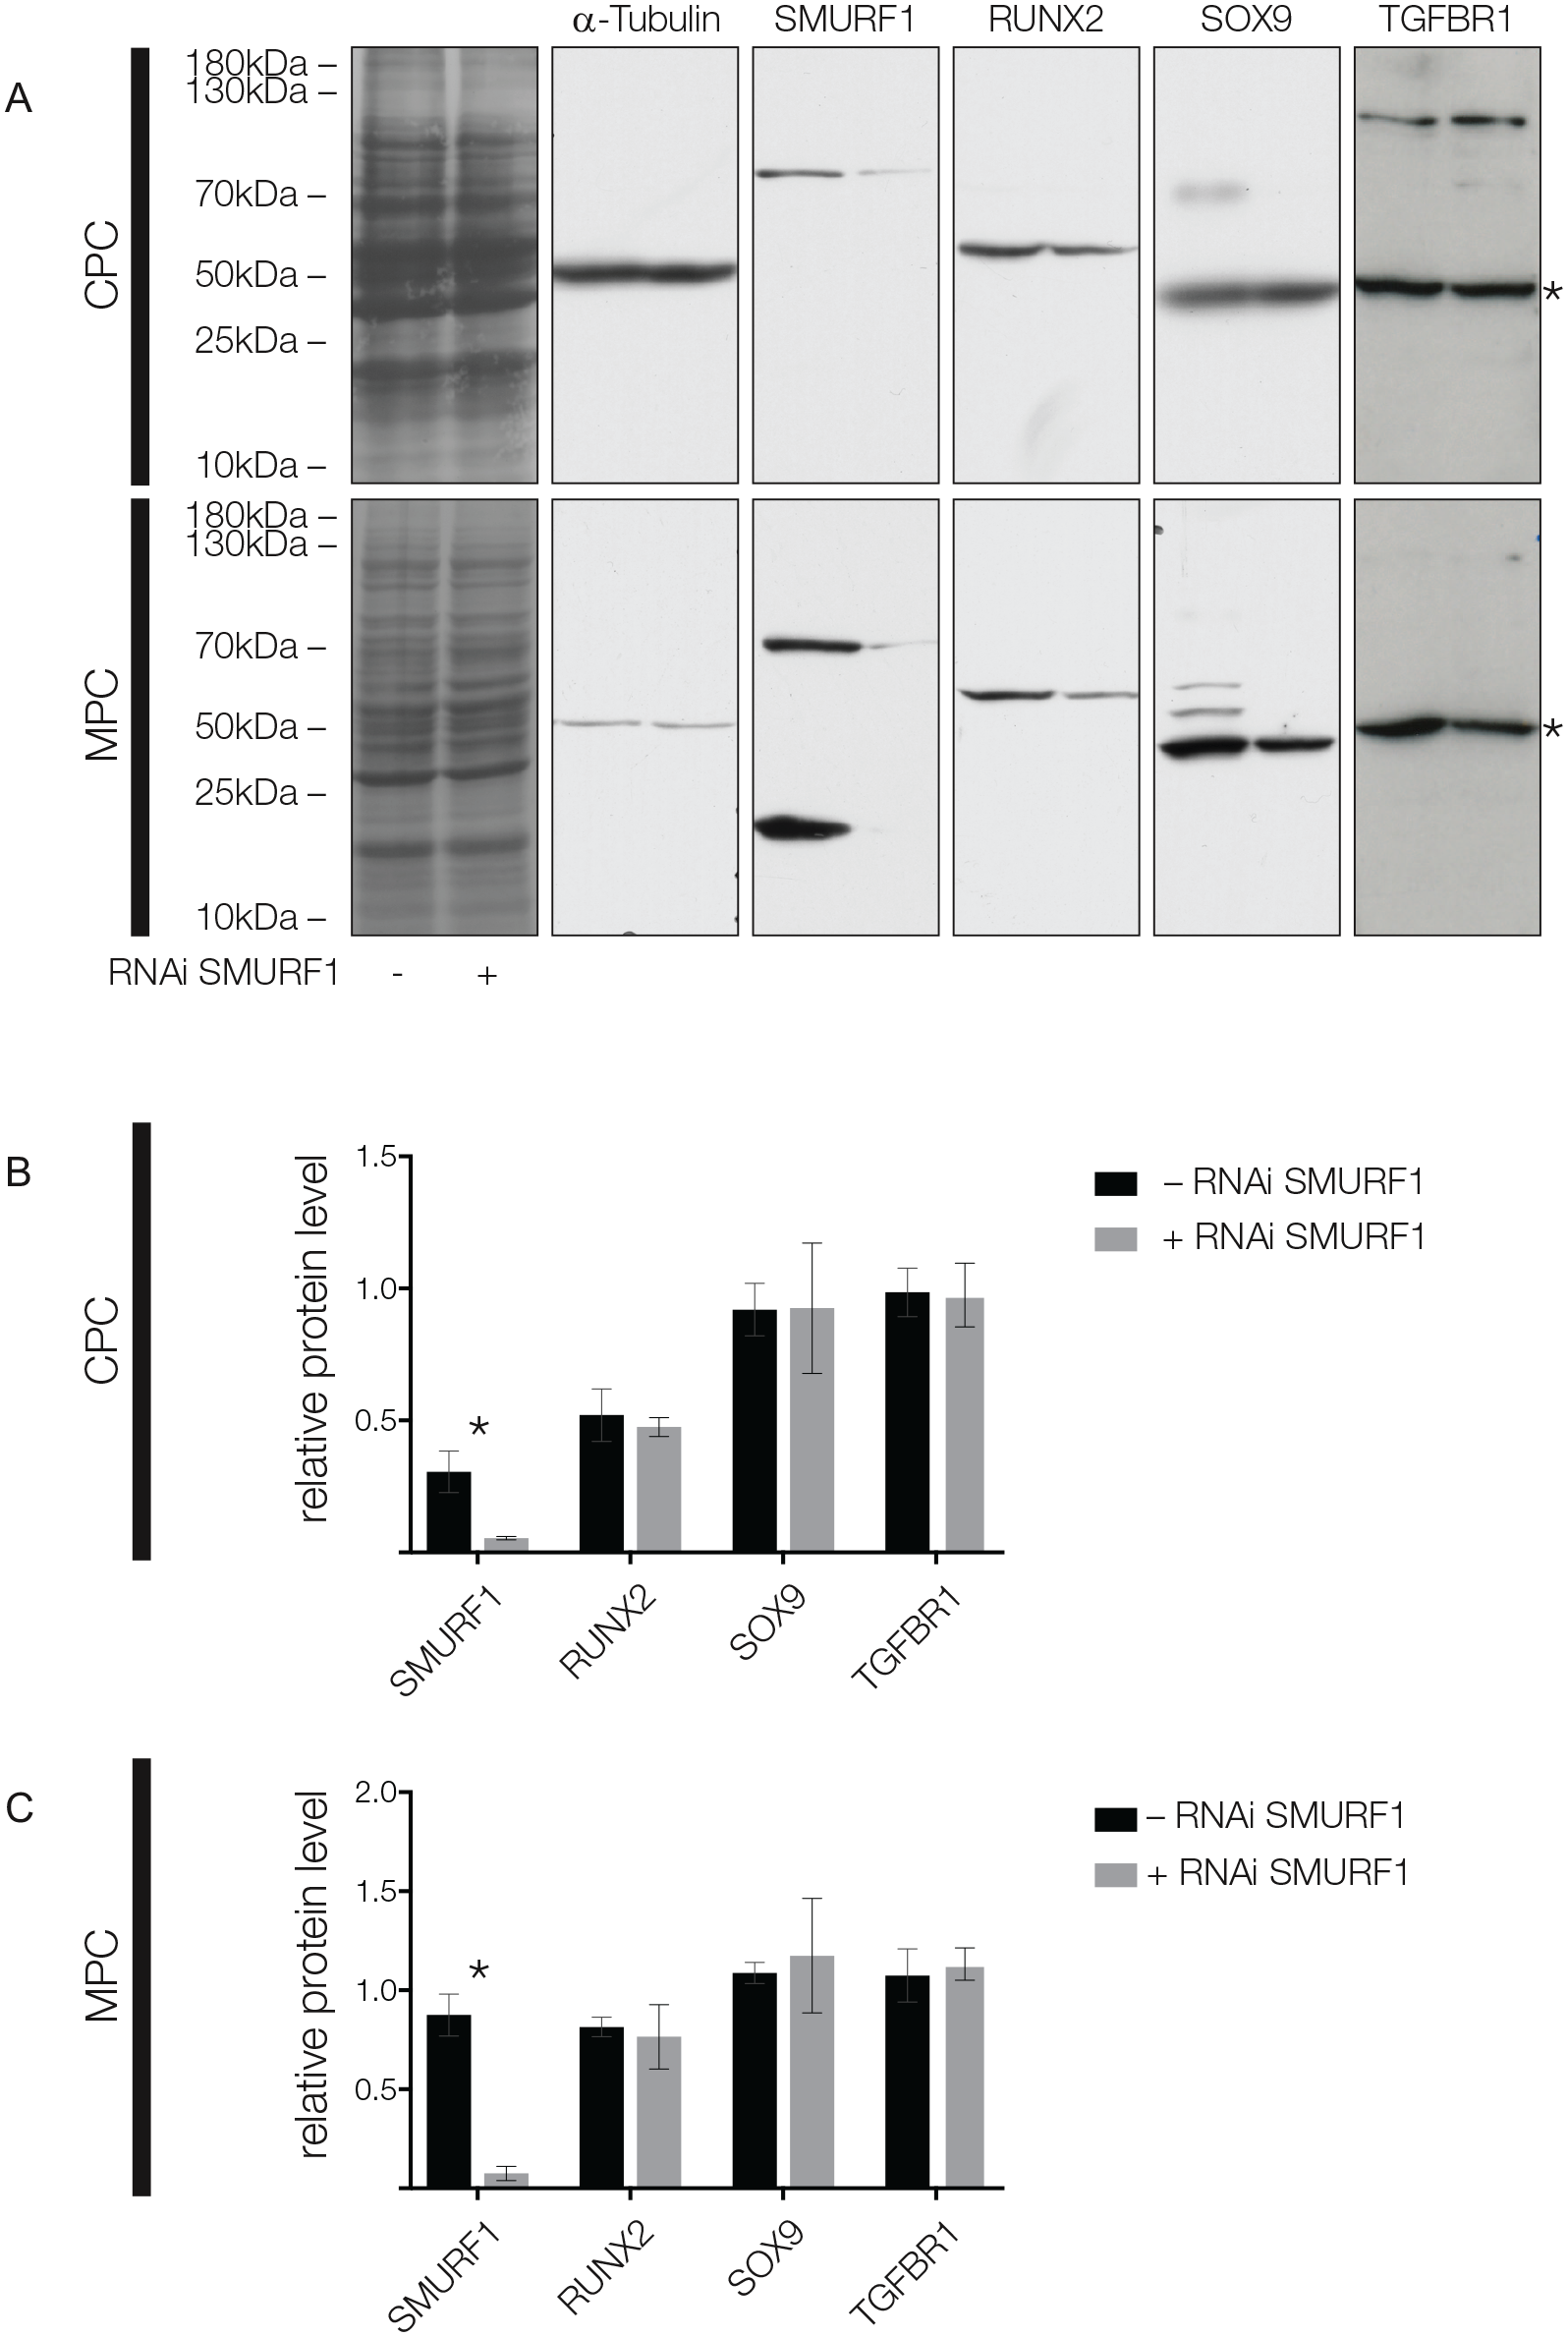
Immunoblotting results for the knockdown of SMURF1 via RNAi in chondrogenic progenitor cells (CPCs) and meniscus progenitor cells (MPCs). Coomassie staining shows proper separation of the proteins, α-tubulin expression shows equal loading of the gels. In CPCs and MPCs, knockdown of SMURF1 leads to unaltered protein levels of RUNX2, SOX9 and TGFBR1. *Indicates TGFBR1. Quantification of Western blot results is shown for (
RNAi Knockdown of SMURF2
In contrast to SMURF1, we found alterations in the protein expression after SMURF2 RNAi knockdown in CPCs and MPCs. The knockdown led to a significant increase in RUNX2 and SOX9 expression in CPCs, while in MPCs, RUNX2 and SOX9 protein expression remained constant. TGFBR1 expression was not affected in CPCs or MPCs (
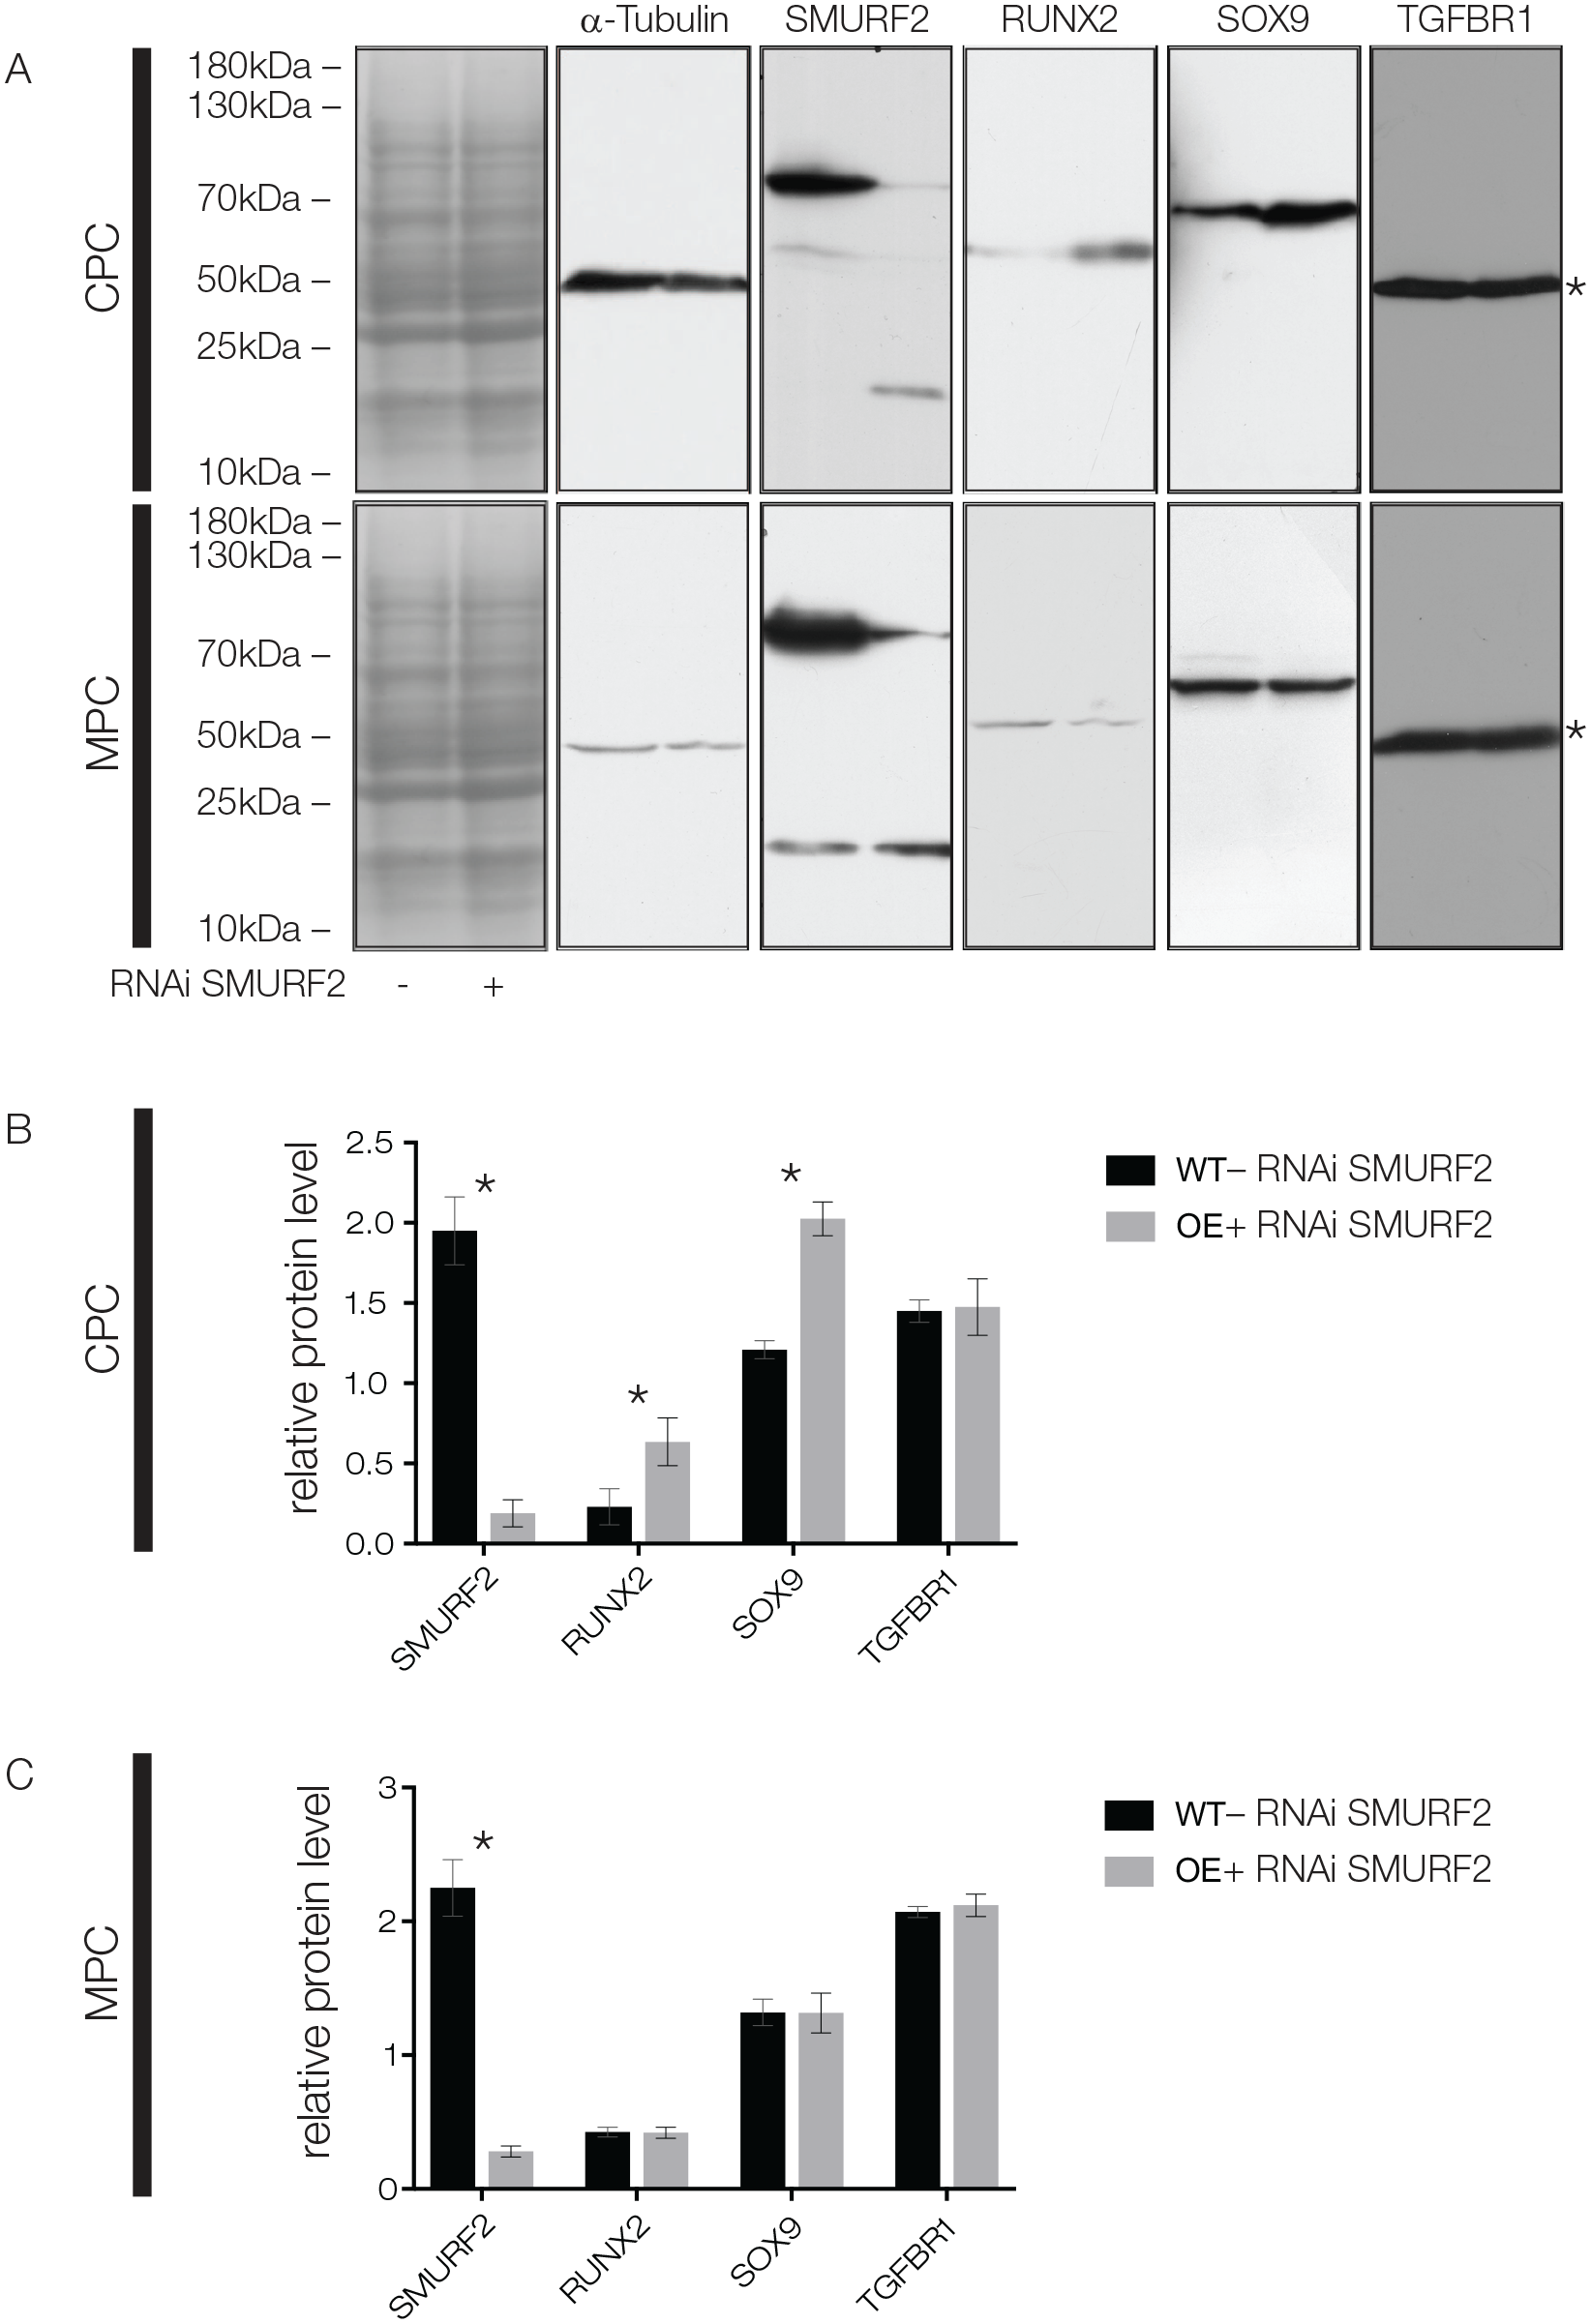
Immunoblotting results for the knockdown of SMURF2 via RNAi in chondrogenic progenitor cells (CPCs) and meniscus progenitor cells (MPCs). Coomassie staining shows proper separation of the proteins, α-tubulin expression shows equal loading of the gels. In CPCs, knockdown of SMURF2 leads to significantly increased protein levels of RUNX2 and SOX9, while TGFBR1 is not affected. In MPCs, knockdown of SMURF2 leads to unaltered levels of RUNX2, SOX9, and TGFBR1. *Indicates TGFBR1. Quantification of Western blot results is shown for (
Discussion
We investigated the ubiquitination enzymes SMURF1 and SMURF2, 2 players downstream of the SMADs within the transforming growth factor-β (TGFβ) pathway.21,30 SMURF1 and SMURF2 were localized in the cells of human OA cartilage and OA meniscus tissue in vivo and in CPCs derived from osteoarthritic cartilage tissue and MPCs derived from diseased meniscus in vitro. SMURF2 is present in human OA tissue, and enhanced protein levels correlate with more advanced disease stages. 31 Previously, we demonstrated the involvement of TGFβ signaling for chondrogenic differentiation in human progenitor cells from knee cartilage and meniscus tissues. For both cell types, we showed that a shift toward SOX9 within the fine-tuned balance of RUNX2/SOX9 resulted in an enhancement of their chondrogenic potential in vitro.19,20
Overexpression of SMURF1 resulted in a significant down-regulation in RUNX2 in CPCs and MPCs. The converse relationship has been shown before for a RUNX2 knockdown resulting in SMURF1 upregulation in bone cells in a transgene mouse model 32 and in 2T3 cells. 33 The demonstrated binding of SMAD6 to RUNX2 results in increased SMURF1 expression. 34 Here, we show that enhanced expression of SMURF1 reduced RUNX2. However, the upregulation of SOX9 after a RUNX2 knockdown that is seen in native CPCs 19 was not seen here in the CPCs or MPCs overexpressing SMURF1. This might be explained in part by the downregulation of TGFBR1 resulting from the overexpression of SMURF1 in these cells. This observation is backed by the fact that overexpression of SMURF2 resulted in an attenuated downregulation of TGFBR1 levels, resulting in no changes in SOX9 levels and indicating that TGFβ/BMP signaling overrides manipulations of downstream players such as SMURFs, at least in chondrogenic progenitor cells.
In osteoblastic cells, the degradation of RUNX2 via SMURF1 knockdown has been described, 35 while C2C12 cells showed the opposite effect. 36 Here, in contrast, the knockdown of SMURF1 in CPCs and MPCs left RUNX2, SOX9 and TGFBR1 unaltered and therefore had no effect on either of their chondrogenic potentials. In HEK cells, RUNX2 seems to facilitate SOX9 ubiquitination 37 ; however, knockdown of SMURF1 did not alter SOX9 protein expression in the present study. In a transgenic mouse model, it was stated that a SMURF2 knockdown enhanced RUNX2 expression in bone cells. 32 This relation is also present in osteoblasts. 38 In the CPCs investigated here, the knockdown of SMURF2 resulted in an enhanced expression of RUNX2; however, the enhancement of SOX9 was much more pronounced. In contrast, SMURF2 knockdown in MPCs did not show any effect on the proteins investigated here. Considering the known balance between SOX9 and RUNX2, this indicates that the knockdown of SMURF2 enhances the chondrogenic potential of OA cartilage-derived progenitor cells, tipping the balance toward SOX9. However, this was not true for the progenitor cells from a diseased meniscus. In both cases, TGFBR1 expression was not affected, indicating that a reduction in SMURF1 or SMURF2 is not linked to TGFBR1 expression. However, overexpression of both proteins reduced the TGFBR1 receptor expression in CPCs and in MPCs, as discussed above.
We demonstrated that overexpression of SMAD2 results in a reduction of RUNX2 to enhance the chondrogenic potential of MPCs. 20 As SMURF2 fosters the proteasomal degradation of SMAD2, 39 it might be possible that the knockdown of SMURF2 enhances SMAD2, which in turn leads to a reduction in RUNX2.
In general, the overexpression of SMURF1 and SMURF2 reduced the protein level of RUNX2, thereby enhancing the chondrogenic potential of osteo-chondro-progenitor cells, that is, CPCs and MPCs investigated here. In sharp contrast, the knockdown of both SMURF1 and SMURF2 had much less effect, and only the knockdown of SMURF2 in CPCs enhanced RUNX2 expression. The indicated proteasomal degradation of RUNX2 via SMURF1 or SMURF2 might be an essential factor for the enhancement of the chondrogenic potential of osteo-chondro-progenitor cells and needs validation by functional assays. SMURF1 and SMURF2 might be interesting targets for future clinical applications in the treatment of OA that need further investigation.
Supplemental Material
fig7_sup – Supplemental material for SMURF1 and SMURF2 in Progenitor Cells from Articular Cartilage and Meniscus during Late-Stage Osteoarthritis
Supplemental material, fig7_sup for SMURF1 and SMURF2 in Progenitor Cells from Articular Cartilage and Meniscus during Late-Stage Osteoarthritis by Boris Schminke, Philipp Kauffmann, Andrea Schubert, Manuel Altherr, Thomas Gelis and Nicolai Miosge in CARTILAGE
Footnotes
Supplemental Material
Acknowledgments and Funding
The author(s) disclosed receipt of the following financial support for the research, authorship, and/or publication of this article: This work was supported by the German Research Foundation (application number Mi 573/10-2).
Declaration of Conflicting Interests
The author(s) declared no potential conflicts of interest with respect to the research, authorship, and/or publication of this article.
Ethical Approval
Ethical approval for this study was obtained from Ethics Committee of the Medical School of the University Goettingen (25/12/10).
Informed Consent
All patients provided written informed consent consistent with the relevant ethical regulations of our institution.
Trial Registration
Not applicable.
References
Supplementary Material
Please find the following supplemental material available below.
For Open Access articles published under a Creative Commons License, all supplemental material carries the same license as the article it is associated with.
For non-Open Access articles published, all supplemental material carries a non-exclusive license, and permission requests for re-use of supplemental material or any part of supplemental material shall be sent directly to the copyright owner as specified in the copyright notice associated with the article.