
Abstract
Objective
The aim of this study was to determine the effects of activity and cam morphology on cartilage composition during adolescence and investigate the development of cartilage composition with age.
Design
Cross-sectional observational cohort study of individuals from football club academies and an age-matched control population, aged 9 to 18 years. Assessments included questionnaires and T2-mapping of hips. Primary imaging outcome measures were T2 relaxation time of acetabular and femoral cartilage, average alpha angle, and lateral epiphyseal extension.
Results
The cohort consisted of 109 elite male footballers, 49 male controls, and 51 female controls. Elite male footballers had an acetabular cartilage T2 value 4.85 ms greater than male controls (P < 0.001). A significant positive correlation existed between Physical Activity Questionnaire Score and acetabular cartilage T2 value (coefficient 1.07, P < 0.001) and femoral cartilage T2 value (coefficient 0.66, P = 0.032). Individuals with a closed physis had an acetabular cartilage T2 value 7.86 ms less than individuals with an open physis. Acetabular cartilage T2 values decreased with age in elite footballers. No correlation existed between alpha angle and anterosuperior acetabular cartilage T2 value and no difference in T2 value existed between individuals with and without cam morphology.
Conclusions
This study demonstrates that high activity levels may significantly affect acetabular cartilage composition during adolescence, but cam morphology may not detrimentally affect cartilage composition until after adolescence.
Introduction
The effect of exercise on cartilage in weightbearing joints is poorly understood. Healthy cartilage requires compressive loading from physical activity to develop normally and maintain form and function. 1 However, excessive loading resulting from high-intensity or long-duration exercise can lead to cartilage damage. 2 Morphological magnetic resonance imaging (MRI) studies in adults have found no difference in cartilage thickness between athletes and controls.3,4 However, the nature and extent of changes to cartilage composition induced by exercise, and whether these are protective or predispose to osteoarthritis (OA), remains unclear.
Hyaline articular cartilage consists of chondrocytes embedded in an extracellular matrix that is composed mainly of collagen in the form of a rigid meshwork of triple-helical fibrils, proteoglycans with chains of glycosaminoglycans (GAGs), cations, and water molecules.5,6 Animal studies have suggested that physical exercise increases the GAG content in weightbearing cartilage.7-10 In vitro, cyclic compression of cartilage simulating walking markedly stimulates GAG synthesis. 11 It has been shown that enzymatic GAG depletion of cartilage decreases its indentation stiffness, 12 suggesting increased GAG levels are a functional means to withstand higher mechanical demands.
Compositional MRI techniques are reliable noninvasive surrogate markers of cartilage composition. 13 Compositional MRI is used clinically to identify early OA 14 and in professional sport to identify athletes at risk of injury and in postinjury scenarios.15,16 T2-mapping is one of the most widely used compositional sequences and is thought to be sensitive to the water and GAG content of cartilage and the integrity of the collagen network.17-19 Some compositional studies in adults have suggested that increases in activity levels result in increased GAG levels, represented by low cartilage T2 values.20,21 However, other studies in older healthy adults have suggested that raised activity levels result in disorientation of collagen fibers and low GAG levels, represented by high cartilage T2 values. 22
The effect of exercise on developing cartilage composition in skeletally immature individuals is unknown. During growth chondrocytes are believed to develop different phenotypes by adapting to local functional requirements within the joint to produce GAG-rich areas.23,24 This would suggest that exercise during skeletal maturation might determine the cartilage composition of weightbearing joints.
Cam morphology develops during adolescence, likely due to high activity levels, 25 and results in reduced GAG in the acetabular cartilage of asymptomatic adult patients who go on to develop radiographic osteoarthritis. 26 It is unknown when these pathological cartilage changes first occur. Cam morphology on MRI is evident from 13 years of age, 25 but cartilage volume loss visible on radiographs may not be present for a number of decades. 27 The length of time prior to radiographic changes that cam morphology starts to cause compositional change remains uncertain.
The aims for this study were to
Investigate the effect of activity and cam morphology on cartilage composition during adolescence
Investigate the changes in cartilage composition with age in the growing hips of adolescents
Methods
The study was approved by our institution’s Inter-Divisional Research Ethics Committee (MSDIDREC- C2-2013-11).
Study Design
Cross-sectional observational cohort study.
Population
Individuals aged 9 to 18 years were recruited from Southampton Football Club (SFC) Academy, Oxford United Football Club (OUFC) Academy, and local schools (controls). 25 The control population consisted of males and females. Football club academies only had male elite cohorts available at the time of recruitment. All individuals underwent MRI scanning of both hips and completed questionnaires to determine activity levels.
Activity Levels
Activity was evaluated using 2 methods: (1) SFC and OUFC Academy (elite footballer cohort) versus general population controls (controls were recruited from local schools and therefore were not members of full-time sporting academies and by definition were not considered elite athletes) and (2) Physical Activity Questionnaire (PAQ) for older children (aged 9 to 13 years) and adolescents (aged 14 to 18 years). 28 The PAQ collects information on the type and amount of sport and exercise undertaken during an average week and provides a summary score of physical activity levels (a score of 1 indicates low physical activity, whereas a score of 5 indicates high physical activity). 29 The volume as opposed to type of activity primarily influences the score.
Imaging Protocol
Cartilage composition and hip morphology were assessed with MRI of both hips using a 3-tesla Philips Achieva platform and torso coil (Philips Healthcare).
T2-mapping was used to image hip cartilage composition. T2-mapping is one of the most widely used compositional sequences and has been shown to be highly reproducible and able to accurately identify changes in cartilage composition associated with early damage when compared with dGEMRIC (delayed gadolinium-enhanced MRI of cartilage) scanning. 13 T2-mapping sequences were acquired in true sagittal plane, with the first slice referenced off the medial border of the femoral head with the remaining slices extending laterally, at the end of scanning protocols to avoid the effects of cartilage loading. 13 Fast spin echo (FSE) pulse sequence, repetition time (TR) 3500 ms, first echo time (TE) 13.5 ms, echo spacing (ES) 13.5 ms, total number of echoes: 7 (13.5 ms, 27 ms, 30.5 ms, 44 ms, 57.5 ms, 71 ms, 94.5 ms), echo train length (ETL) 94.5 ms, flip angle 180°, field of view (FOV) 273 mm × 150 mm, bandwidth 191 Hz/pixel, slice thickness 3 mm, slice gap 0.8 mm, acquisition matrix 292 × 278, reconstructed pixel size 0.51 × 0.52 × 3 mm, NEX 1, SENSE factor: 2.0. Acquisition time 8 minutes.
Three-dimensional (3D) water selective fluid (WATSf): 3D WATSf sequence was used to image femoral head morphology. Radial images were acquired around the axis of the femoral neck at 30° intervals. The coronal axis (12 o’clock position) was positioned parallel to the axis of the proximal femur diaphysis. 25 Sequence variant = 3D gradient/fast field echo with binomial pulse (1:3:3:1); TR = 13.65 ms; TE = 6.9 ms; excitation flip angle = 30°; bandwidth = 145 Hz/pixel; interpolated voxel size 0.29 mm × 0.29 mm × 0.4 mm; averages = 2; acquired in true sagittal orientation.
Imaging Measures
T2-mapping values were quantified using manual segmentation performed with OsiriX Software (V.6.0.2, Pixmeo). Regions of interest (ROIs) were developed based on a clockface around the center of the femoral head at 30° intervals. 13 Regions were referenced from the 12 o’clock position that passes through the centre of the femoral head parallel to the axis of the proximal femur diaphysis. The 3 o’clock boundary was positioned perpendicular to this line and represented an anterior position for both hips. Femoral and acetabular cartilage were segmented separately and ROIs were not extended beyond where there was adjacent femoral and acetabular cartilage, hence did not include the chondrolabral junction. ROIs were denoted as anterior acetabular cartilage (Aa), anterosuperior acetabular cartilage (ASa), superoanterior acetabular cartilage (SAa), superoposterior acetabular cartilage (Spa), posterosuperior acetabular cartilage (PSa), posterior acetabular cartilage (Pa), anterior femoral cartilage (Af), anterosuperior femoral cartilage (ASf), superoanterior femoral cartilage (SAf), superoposterior femoral cartilage (SPf), posterosuperior femoral cartilage (PSf), and posterior femoral cartilage (Pf).
Each scan gave approximately 15 sagittal slices through the hip. The number of slices per hip from which articular cartilage was segmented varied between patients depending on hip size and image quality but was consistently between 4 and 6. Quantitative T2 (T2-mapping) maps were generated using custom code (MATLAB R2015a, MathWorks, Natick, MA, USA). Quantitative T2 maps were generated using a sum of squares algorithm on co-registered echo time images and fitting a mono-exponential T2 recovery curve using a nonlinear algorithm. The time to complete imaging analysis and subsequent processing for each individual ranged from 90 to 120 minutes.
To investigate differences in cartilage composition with age, and effect of activity, cartilage was analyzed as acetabular and femoral cartilage separately. To investigate the effect of cam morphology on cartilage composition the anterosuperior acetabular cartilage was used as this is the area of cartilage where GAG loss is first observed. 26 Anterosuperior acetabular cartilage comprised anterior acetabular cartilage (Aa), anterosuperior acetabular cartilage (ASa), and superoanterior acetabular cartilage (SAa) from slices throughout the whole joint.
Cam morphology was quantified using the alpha angle for cartilage on radial slices from 11 o’clock, 12 o’clock, 1 o’clock, 2 o’clock, and 3 o’clock. Alpha angle was calculated by drawing a line from the centre of a best-fit circle surrounding the femoral head to the midpoint of a line transecting the narrowest portion of the femoral neck. A further line was then drawn from the center of the best-fit circle to where the contour of the femoral head first exits this circle. The alpha angle is the angle between these 2 lines. Cartilage alpha angle was selected because in skeletally immature hips the ossified regions of the femoral head do not reflect the overall hip shape. The average alpha angle from 11 o’clock to 3 o’clock was taken as the primary measure of cam morphology in this study. Alpha angles greater than 60° were taken to define the presence of cam morphology in skeletally mature individuals. 30
Physeal morphology was quantified using epiphyseal extension 31 on radial slices from 11 o’clock, 12 o’clock, 1 o’clock, 2 o’clock, and 3 o’clock. Epiphyseal extension has been shown to precede the development of cam morphology. 25 Epiphyseal extension was quantified by measuring the distance from the medial femoral head to the most distal extent of the epiphysis along a line parallel to the axis of the femoral neck as was created when measuring the alpha angle. This distance was then divided by the diameter of the femoral head to produce a standardized ratio. The physis of each hip was scored as open, partially closed, or closed. A physis was deemed partially closed when there was contact between the epiphysis and metaphysis but the physis remained visible on the WATSf MRI sequence. When considering physeal closure as a binary variable, a partially closed physis was considered closed.
Statistical Analysis
Statistical calculations were performed using STATA V.14.1 (College Station, TX, USA). Sample size was calculated as previously reported. 25 Distribution of values was examined using histograms and kernel density plots. Inverse probability weighting with regression adjustment modeling 32 was adopted to assess variables that predict differences in cartilage composition to account for selection bias. Multivariate linear regression modeling was used to evaluate the relationship between variables. Variables included in multivariate analysis were cohort, age, gender, and activity level. Interactions were evaluated with linear regression of each combination of variables that predict average alpha angle and epiphyseal extension. None reached statistical significance; hence no interaction terms were included in the multivariate models. Statistical significance was set at P < 0.05.
Reproducibility was studied for each of the imaging outcome measures adopted in this study. Measurements were repeated by the principal investigator a minimum of 1 month after the initial measurements (intraobserver reproducibility), and also by a clinical research fellow with experience of musculoskeletal imaging research (interobserver reproducibility). Ten hips were selected at random from the cohort for reproducibility measures. Reproducibility was assessed using intra- and interclass correlations (ICC), the smallest detectable difference (SDD), and the root mean square of the coefficient of variance (RMSCoV). SDD was calculated as the standard deviation of the mean difference between readings multiplied by 1.96 and RMSCoV was calculated as the root mean square of the change divided by the mean, multiplied by 100. 33
Results
Participant Demographics
A total of 228 individuals completed MRI scanning. MRI datasets were incomplete in 19 individuals due to movement artifact. The cohort of completed scans comprised 109 elite male footballers (mean age 150 months, SD = 31), 49 male controls (mean age 153 months, SD = 30), and 51 female controls (mean age 168 months, SD = 33) ( Table 1 ). No individual reported injury or symptoms affecting activity levels in the week prior to scanning. The PAQ score in elite footballers was 3.11 (SD = 0.71), in male controls was 2.86 (SD = 0.69), and in female controls was 2.42 (SD = 0.69). Adjusting for age, elite male footballers had a PAQ score 0.22 higher than male controls (P = 0.002), and 0.28 higher than female controls (P = 0.001).
Cohort Demographics.
Effect of Activity on Cartilage Composition in Adolescence
Elite level football players had significantly greater acetabular cartilage T2 values than controls. Adjusting for age, elite male footballers had acetabular cartilage T2 values 4.85 ms greater than male controls (P < 0.001) ( Fig. 1 , Table 2 ). No significant difference in femoral cartilage T2 values was seen between elite level footballers and male controls ( Table 3 ).
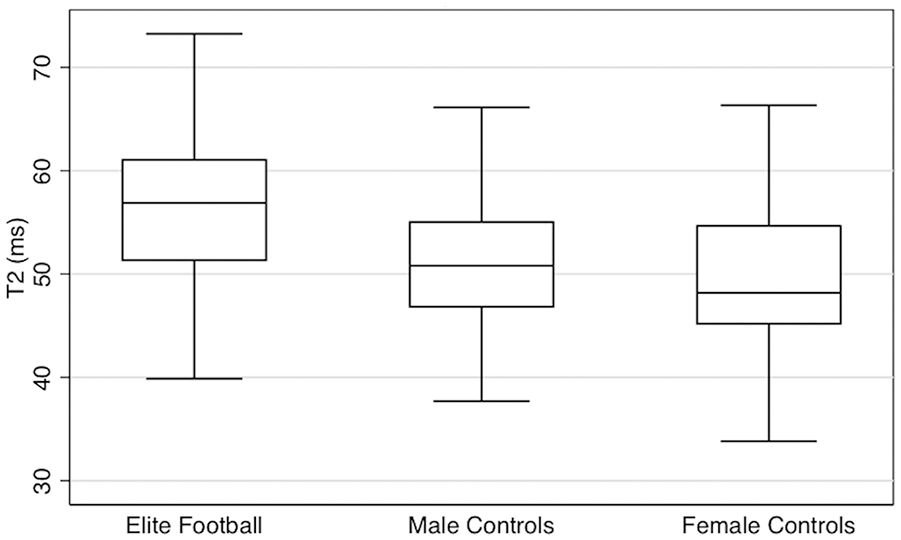
Acetabular cartilage T2 values by cohort: box and whisker plot.
Predictors of Acetabular Cartilage Values.
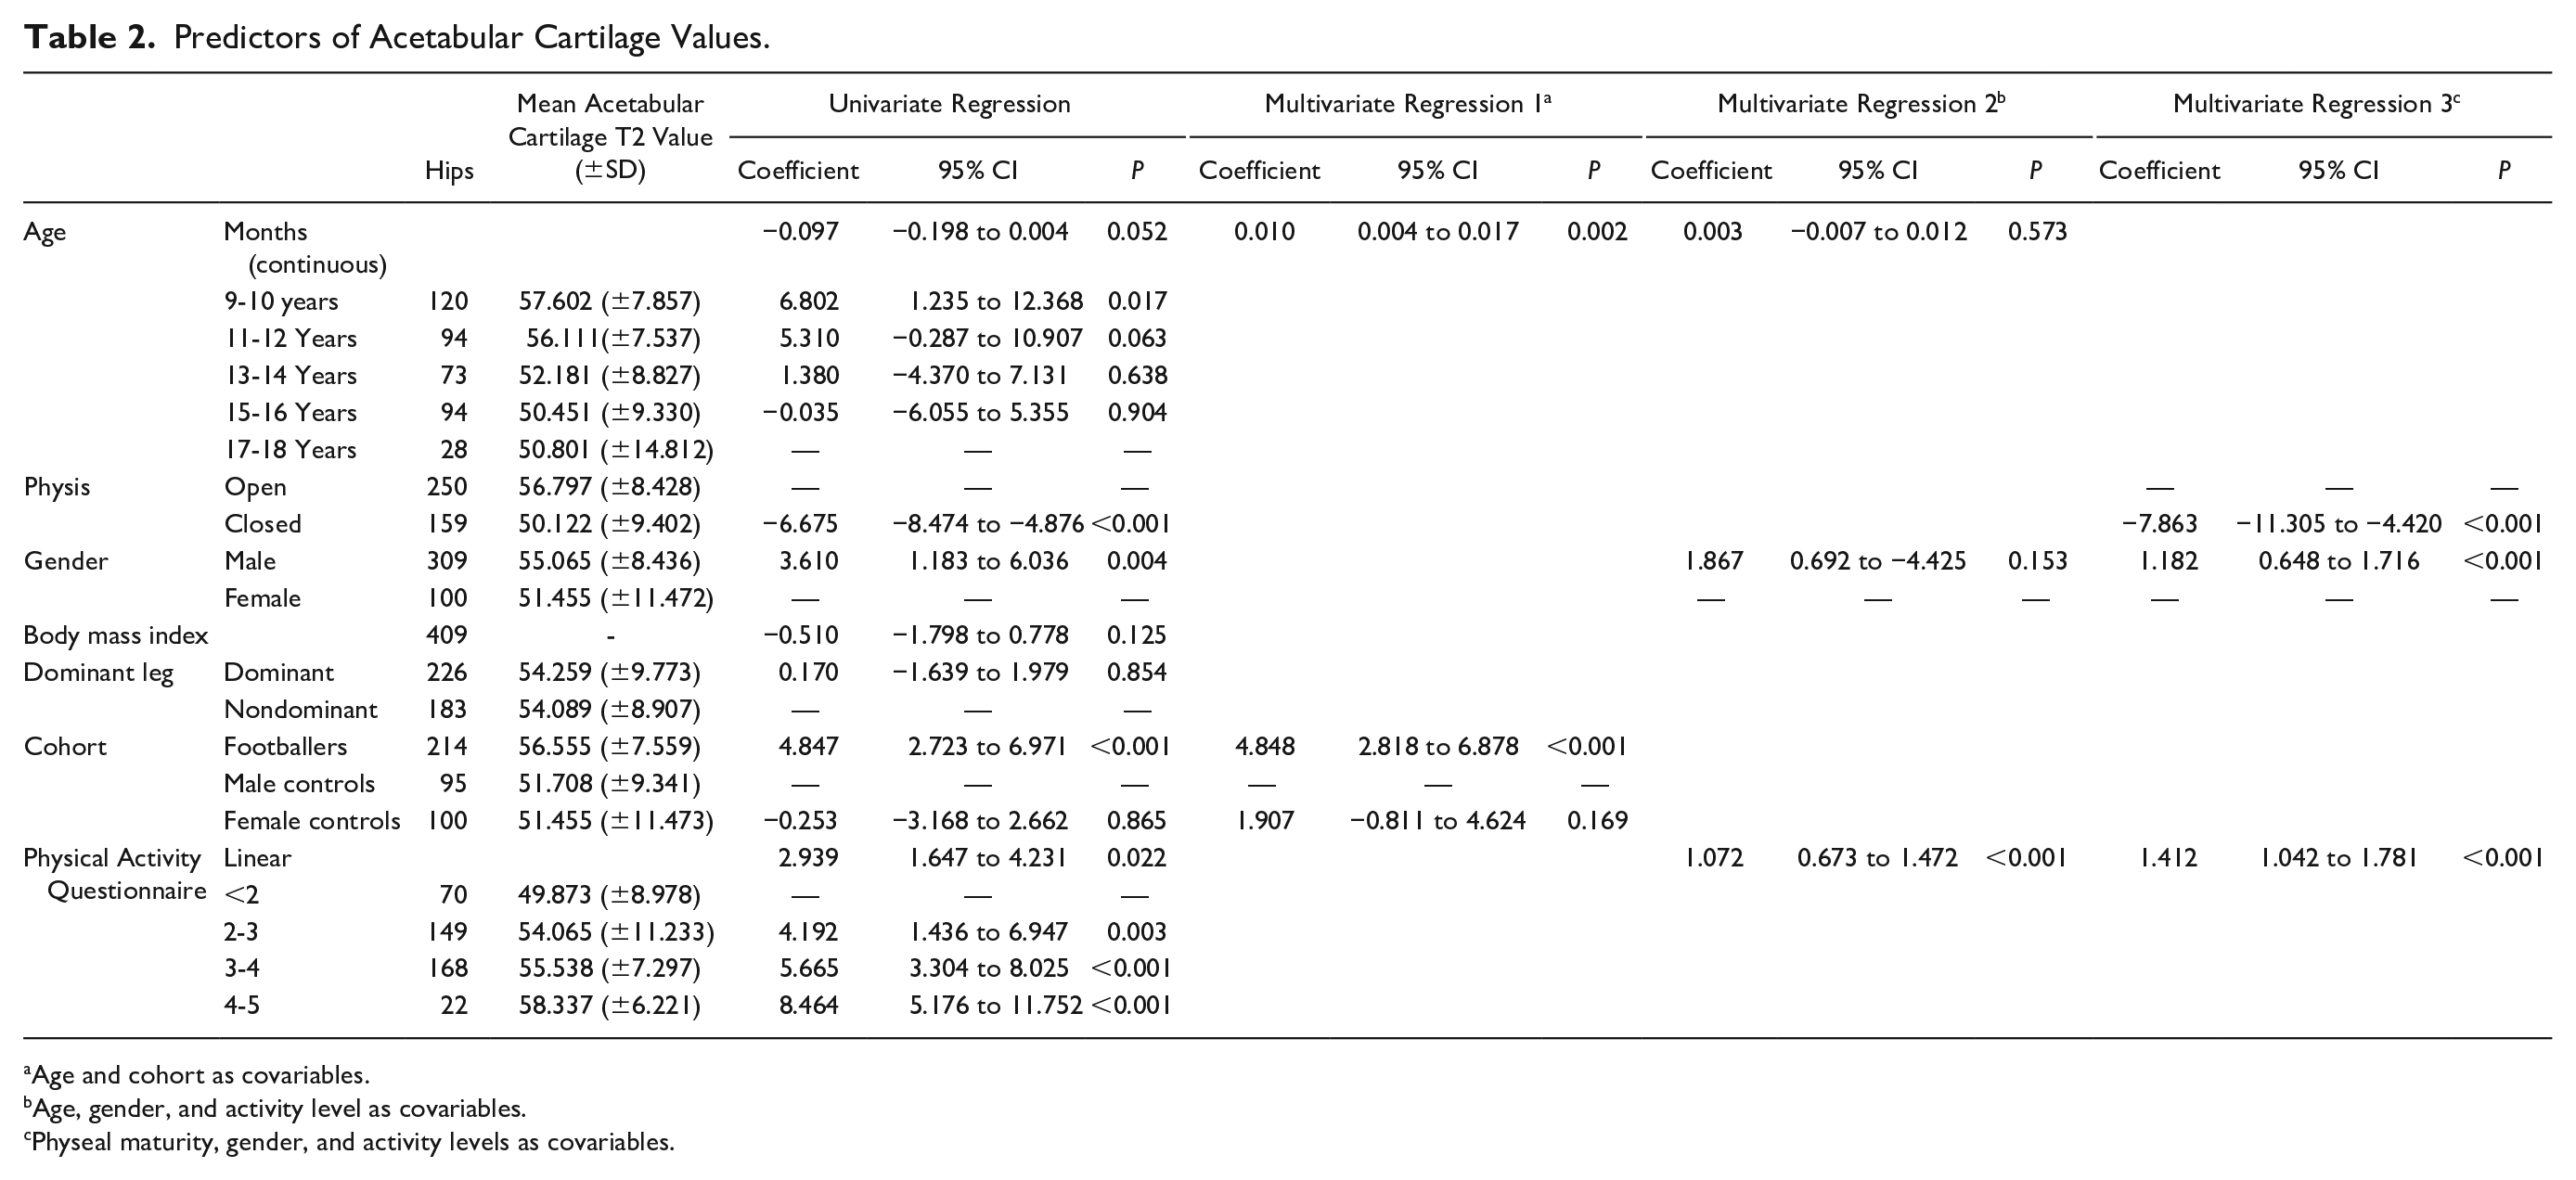
Age and cohort as covariables.
Age, gender, and activity level as covariables.
Physeal maturity, gender, and activity levels as covariables.
Predictors of Femoral Cartilage Values.
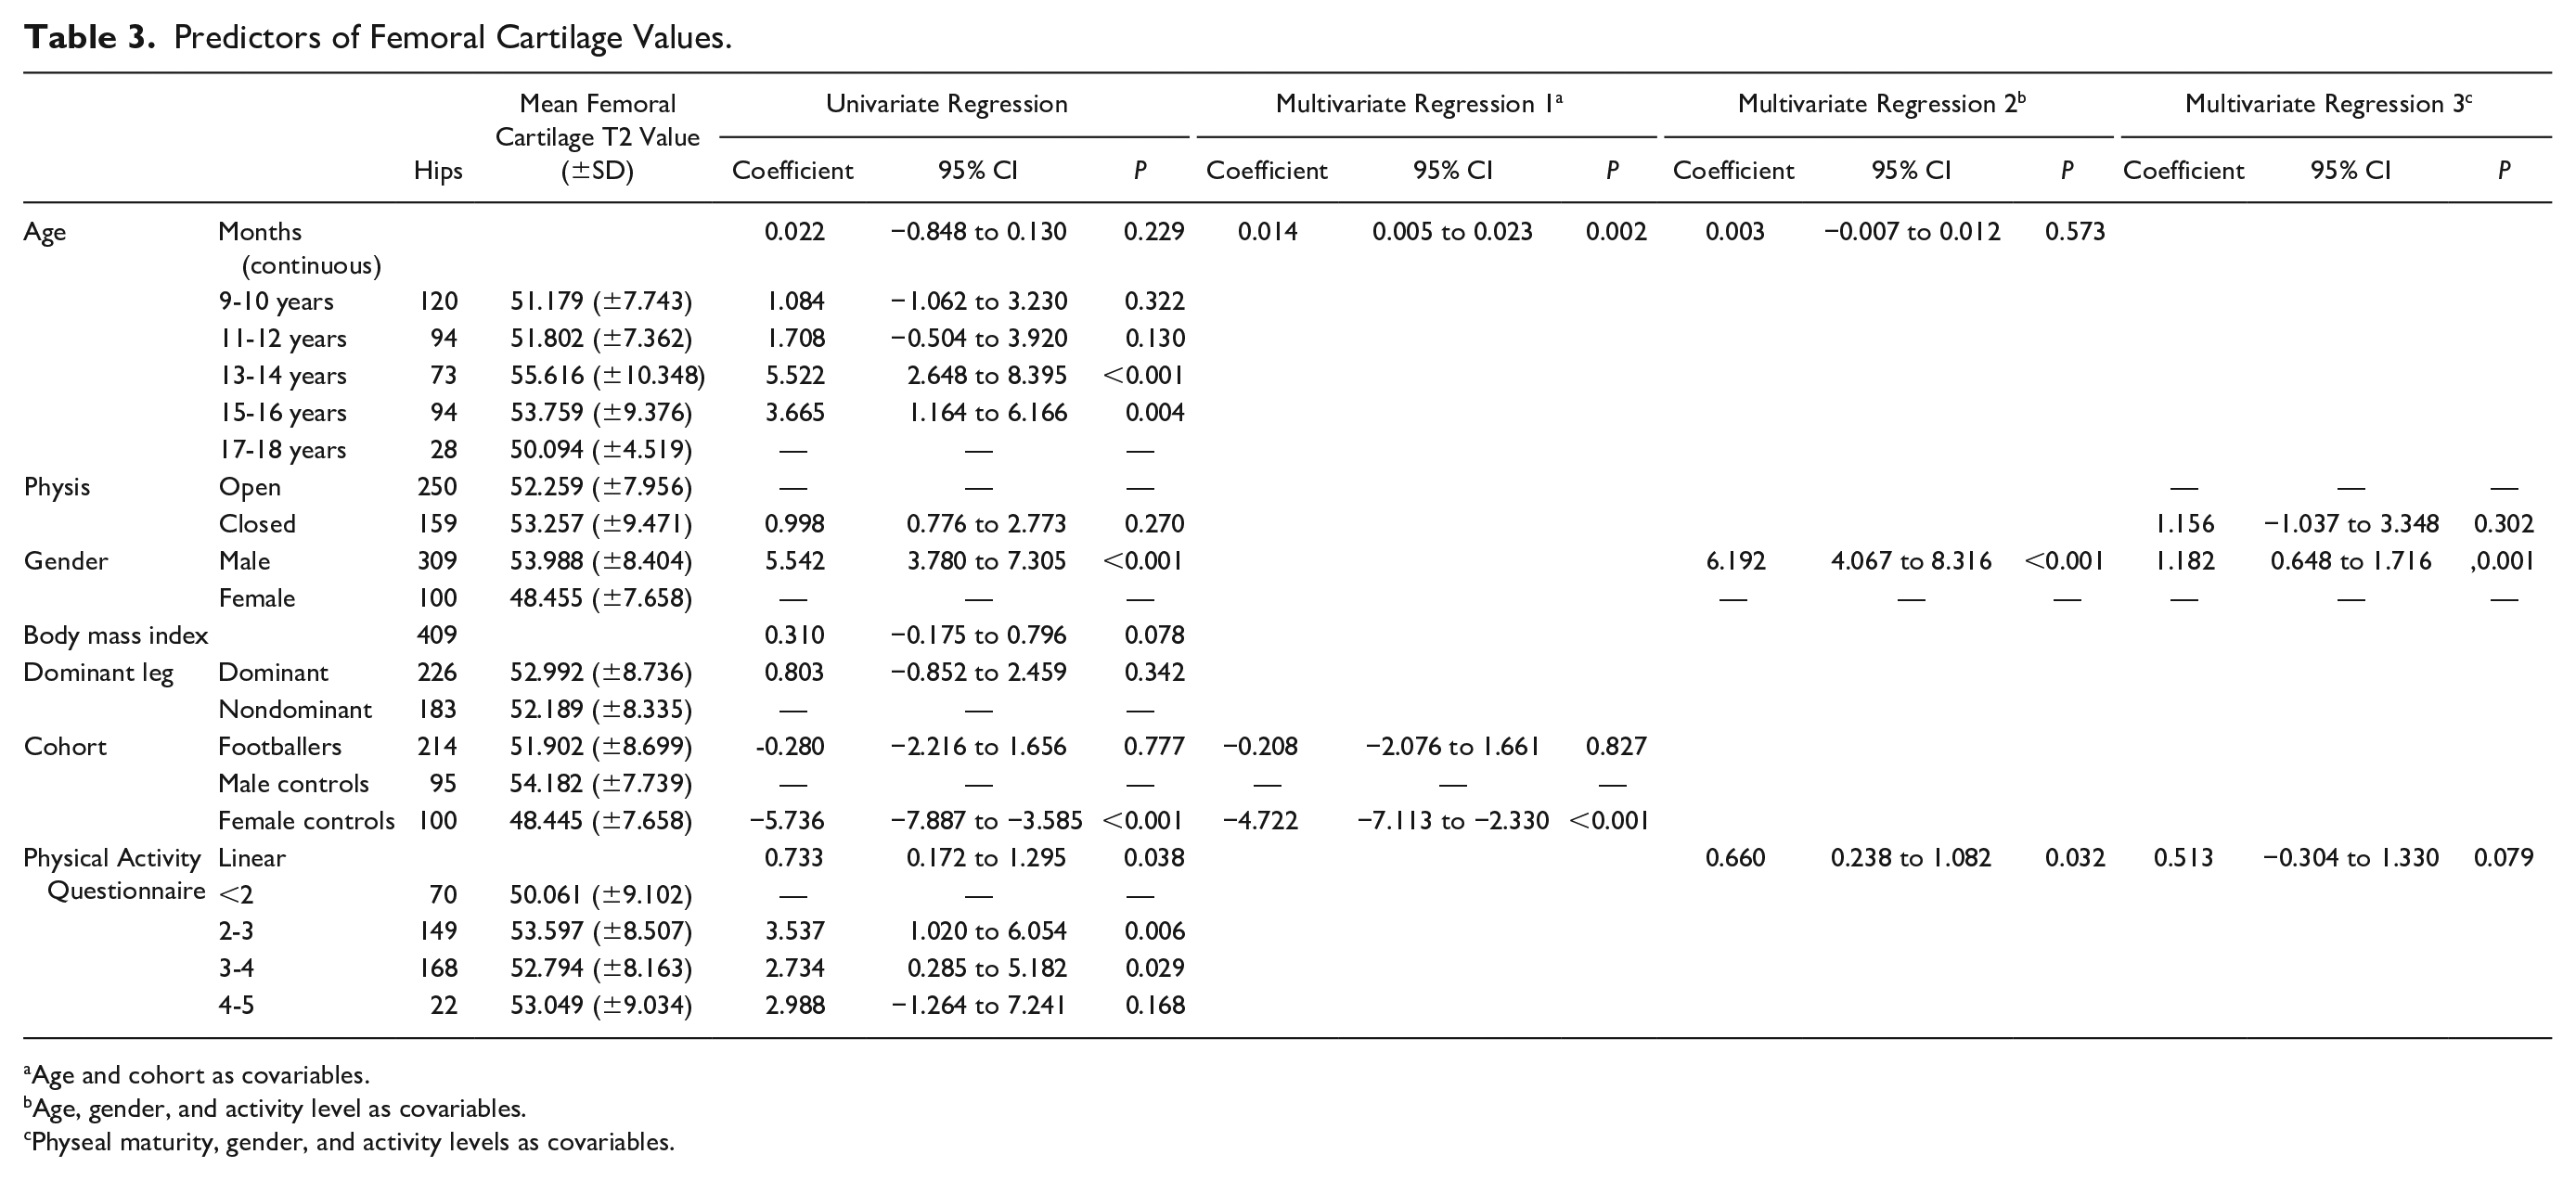
Age and cohort as covariables.
Age, gender, and activity level as covariables.
Physeal maturity, gender, and activity levels as covariables.
Males had significantly greater acetabular cartilage T2 values than females in a univariate regression analysis, but not in a multivariate regression analysis when controlling for age and activity level ( Table 2 ). Males had significantly greater femoral cartilage T2 values than females. Adjusting for age and activity level, males had a femoral cartilage T2 value 6.19 ms greater than females (P < 0.001) ( Table 3 ).
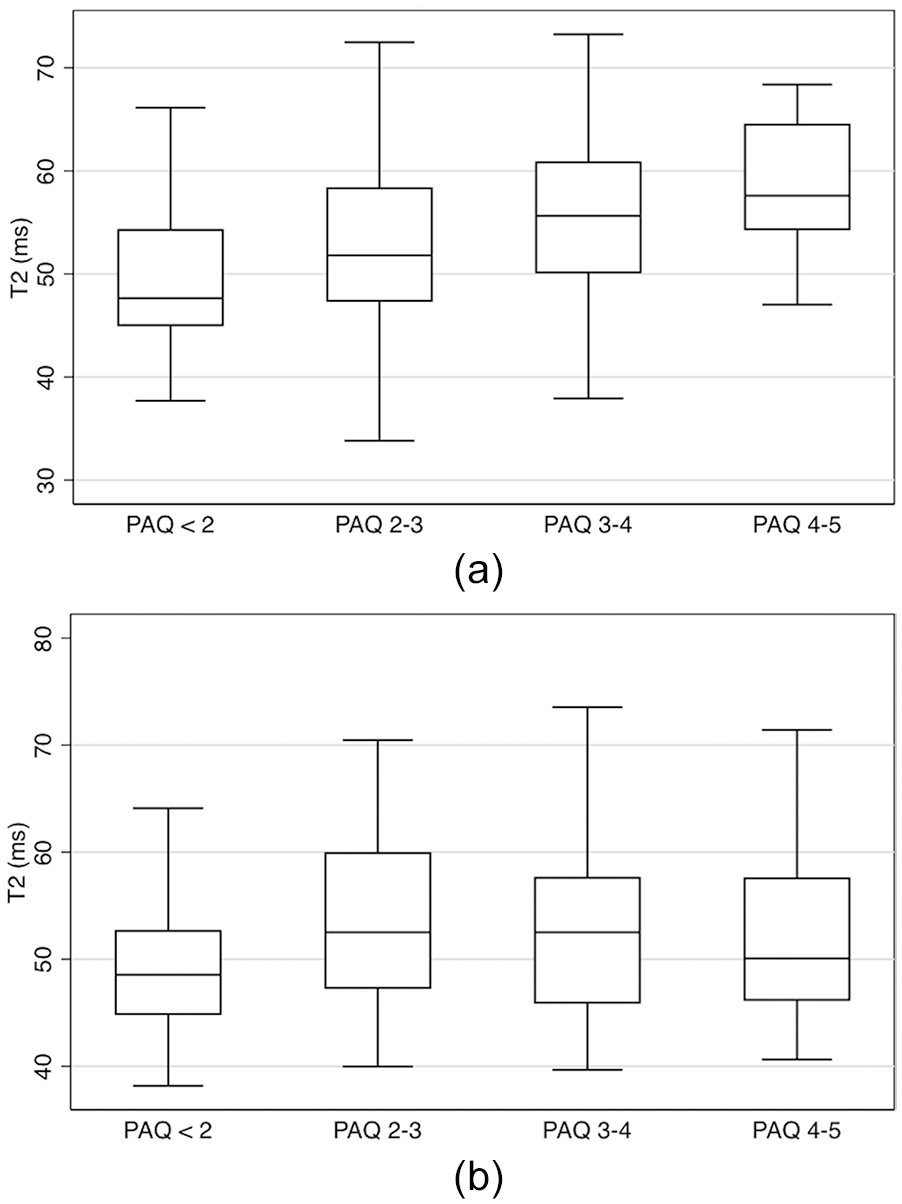
Individuals with high activity levels (PAQ score) had significantly greater acetabular cartilage T2 values than individuals with low activity levels. Adjusting for age and gender in a multivariate linear regression model there was a significant positive linear relationship between PAQ score and acetabular cartilage T2 values (coefficient 1.072, P < 0.001) ( Table 2 ). Adjusting for age and gender individuals with a PAQ score between 4 and 5 had acetabular cartilage T2 values 5.75 ms greater than individuals with a PAQ less than 2 (P < 0.001) ( Fig. 2a ).
(
Individuals with high activity levels (PAQ score) had significantly greater femoral cartilage T2 values than individuals with low activity levels. Adjusting for age and gender in a multivariate linear regression model there was a significant positive linear relationship between PAQ score and femoral cartilage T2 values (coefficient 0.66, P = 0.032) ( Table 3 ). Adjusting for age and gender individuals with a PAQ score between 4 and 5 had femoral cartilage T2 values 9.18 ms greater than individuals with a PAQ less than 2 (P < 0.001) ( Fig. 2b ).
No significant association was seen between leg dominance or body mass index and acetabular or femoral cartilage T2 values ( Tables 2 and 3 ).
Change in Cartilage Composition with Age
Skeletal Maturity
Individuals with a closed physis had significantly lower acetabular cartilage T2 values than individuals with an open physis. Adjusting for activity level and gender, individuals with a closed physis had an acetabular cartilage T2 value 7.86 ms less than individuals with an open physis (P < 0.001) ( Table 2 , Fig. 3 ). There was no significant difference in femoral cartilage T2 values between individuals with an open and closed physis ( Table 3 ).
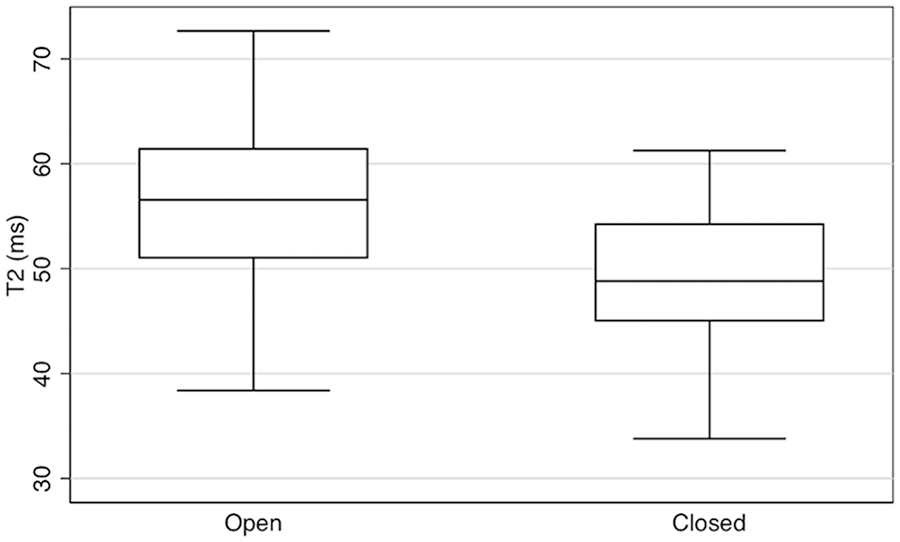
Acetabular cartilage T2 values by physeal maturity in all individuals: box and whisker plot.
Chronological Age
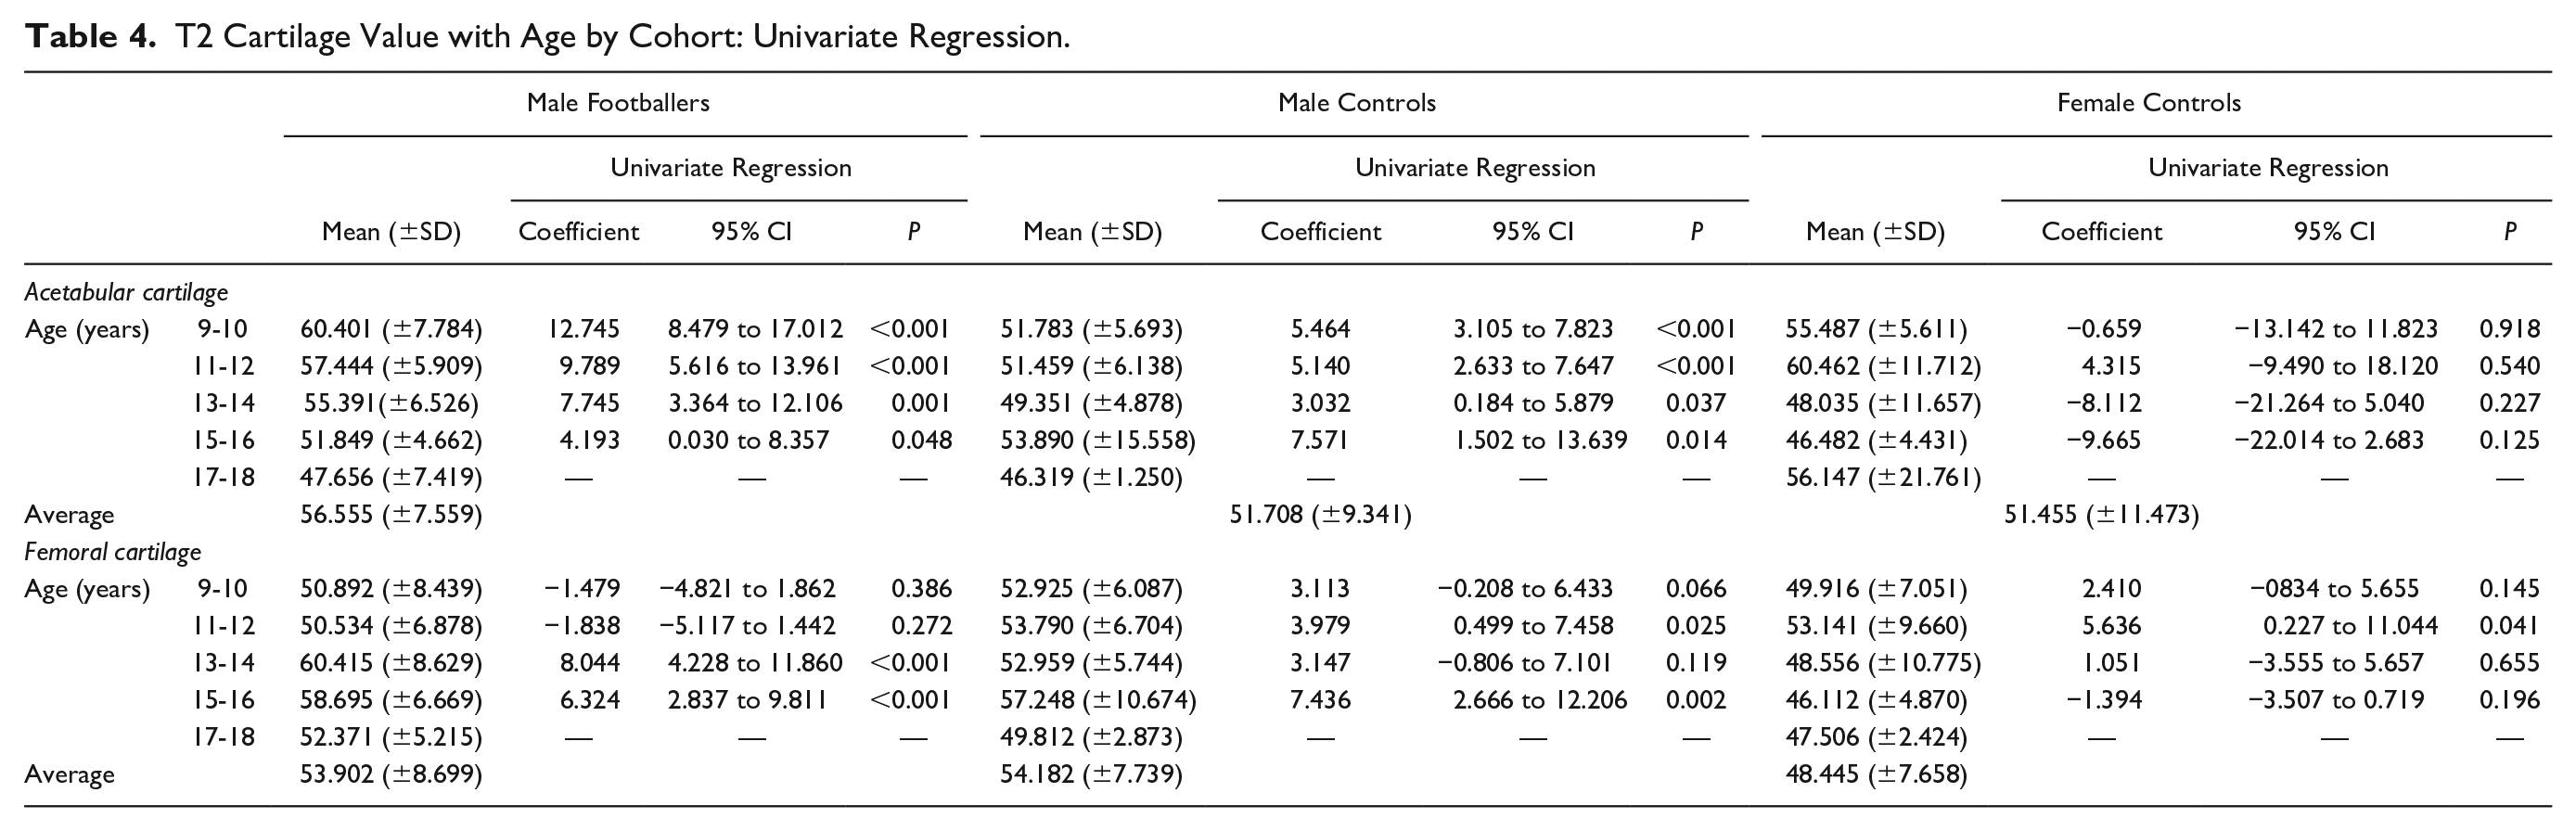
This study found no clear pattern of change in hip cartilage T2 values with age in all individuals ( Tables 2 and 3 ). Male footballers, however, showed a clear decrease in acetabular cartilage T2 values with age, with significant difference between age groups occurring up to 18 years of age ( Table 4 , Fig. 2a ). No consistent pattern of change in acetabular cartilage T2 values with age was observed in male or female controls. No consistent pattern of change in femoral cartilage T2 values with age was observed in any cohort ( Table 4 ).
T2 Cartilage Value with Age by Cohort: Univariate Regression.
Effect of Cam Morphology on Cartilage Composition
In this study no correlation was seen between average alpha angle and anterosuperior acetabular cartilage T2 values. Individuals with cam morphology (alpha angle greater than 60°) had lower anterosuperior acetabular cartilage T2 values in a univariate regression model (coefficient −3.23 ms, P = 0.006), but not in a multivariate regression analysis adjusting for age, gender, and activity level. Similarly, no correlation was seen between epiphyseal extension and anterosuperior acetabular cartilage T2 values.
Reproducibility
Alpha angle: intraobserver ICC was 0.996 (95% CI 0.995-0.997), SDD was 3.39°, and RMSCoV was 3.0%. Interobserver ICC was 0.91 (95% CI 0.87-0.95), SDD was 4.22°, and RMSCoV was 4.61%.
Lateral epiphyseal extension: Intraobserver ICC was 0.998 (95% CI 0.997-0.0.999), SDD was 0.01, and RMSCoV was 0.86%. Interobserver ICC was 0.988 (95% CI 0.982-0.993), SDD was 0.01, and RMSCoV was 1.09%.
T2 mapping intraobserver reproducibility combining all ROIs from T2 scans was ICC 0.98 (95% CI 0.97-0.98), RMSCoV 3.50%, and SDD 2.20 ms. Interobserver reproducibility combining all ROIs was ICC 0.96 (95% CI 0.95-0.96), RMSCoV 5.20%, and SDD 3.50 ms.
Discussion
The aim of this study was to determine the effects of activity and cam morphology on cartilage composition during adolescence and investigate the development of cartilage composition with age. This study demonstrates that high activity levels may adversely affect acetabular cartilage composition during adolescence, but cam morphology may not detrimentally affect cartilage composition until after adolescence.
Effect of Activity on Cartilage Composition in Adolescence
The effect of exercise on cartilage composition in adolescence has not previously been investigated. Disagreement exists over the effect of exercise on cartilage in healthy adults. Previous compositional MRI studies in adults have reported that increased activity levels both increase GAG levels (represented by low cartilage T2 values)20,21 and result in disorientation of collagen fibers and low GAG levels (represented by high T2 cartilage values). 22
In this study, elite adolescent footballers had significantly higher acetabular cartilage T2 values than controls, but no difference was seen between cohorts in femoral cartilage T2 values. The acetabular cartilage T2 value was 4.85 ms greater in elite footballers than male controls. Higher PAQ scores were also significantly associated with higher T2 values in both acetabular and femoral cartilage. These results mirror the findings of Stehling et al., 22 who reported a difference in patellar cartilage T2 values of 3 ms between high and low activity individuals. These findings suggest that individuals with high activity levels may have different cartilage architecture and composition, such as lower GAG levels and collagen fiber disorientation, compared to low activity individuals.
The significance of this is not clear. However, it may be that this represents a pathological response in articular cartilage to increased load during a phase of rapid growth. Increased load during adolescence has been shown to result in other pathological processes in the proximal femur, such as extension of the lateral epiphysis resulting in cam morphology. 34 It has been shown that individuals aged 12 to 14 years are most susceptible to these changes. 25 Our results agree with these findings and suggest that significant pathological adaptations to excessive load are taking place throughout the developing hip joint at a key point during early adolescence.
Males had significantly greater femoral cartilage T2 values than females, but no difference was seen between the sexes in acetabular cartilage. Acetabular cartilage represents an area of greater clinical significance than femoral cartilage, as the acetabulum is where damage associated with OA is first seen. Further research is required in adult cohorts before the difference in femoral cartilage between genders could be interpreted as being clinically significant or consistent in adult cohorts.
No difference was found in acetabular or femoral cartilage T2 values between dominant and non-dominant legs. This finding agrees with previous studies that have suggested that the kicking leg does not play an important role in skeletal maturation during adolescence. 35 The average time in possession of the ball for an individual ranges from 50 to 100 seconds during a 90-minute football match. 36 Accordingly, the time spent loading the hips unequally during kicking is likely negligible when compared with the time spent loading the hips equally during running and cutting maneuvers, which may explain why no difference is seen between dominant and nondominant legs.
Change in Cartilage Composition with Age
During skeletal growth chondrocytes develop different phenotypes by adapting to local functional requirements within the joint to produce GAG-rich areas.23,24 This would suggest that cartilage composition might change and develop during adolescence. However, no studies exist that have investigated cartilage composition in an adolescent cohort.
This study demonstrates that skeletally mature individuals have significantly lower acetabular cartilage T2 values than skeletally immature individuals. This would suggest that cartilage develops throughout adolescance to attain a higher GAG content and improved collagen fiber orientation.
Elite footballers had a significant decrease in acetabular T2 values up to 18 years of age. T2 values appear to remain more stable in male and female controls throughout adolescence. This finding may suggest that the adverse effects of high load on cartilage diminish as adolescence progresses, and adds weight to the argument that high levels of exercise are most detrimental during early adolescence.
There was no recognizable pattern of change in femoral cartilage composition. The majority of the acetabulum is involved in weight bearing, whereas weightbearing areas of the femoral head depend on the relationship of the femur to the acetabulum and change continually with movement. 37 As such, by evaluating the femoral cartilage as a whole this study may have missed more localized areas of increased GAG content.
Effect of Cam Morphology on Cartilage Composition
Cam morphology in healthy adults has been shown to cause GAG loss in the anterosuperior acetabular cartilage that precedes radiographic OA. 26 Cam morphology is thought to develop around 11 to 14 years of age, 25 but the age at which GAG loss first occurs is unknown. In this study, there was no correlation between the quality of acetabular cartilage and the presence of a cam deformity. The internal biomechanical interaction between the femur and acetabulum may therefore be a lesser concern during adolescence. There is a strong association between cam deformity and long-term risk of OA. 3 Moreover, asymptomatic labral or cartilaginous injuries of the hip associated with anatomical features of cam or pincer morphology have been reported in 25% of adult professional football players. 38 Damage at the acetabular rim from cam morphology may therefore not appear for several years after skeletal maturation, further work is required to establish this.
Limitations
The main limitation of this study is the cross-sectional design. It is not possible to comment on the true change in cartilage composition within the individuals over time based on the findings from this study. A significant limitation of this study is in using T2 values as a surrogate measure for GAG content and collagen fiber orientation. T2-mapping of the hip is susceptible to error introduced by loading, magic angle effect, and partial volume effect.39,40 Accordingly, the results from this study should be interpreted with care. It should also be noted that T2 cartilage values can become transiently raised by loading the cartilage immediately prior to scanning. 41 However, T2 relaxation times have been shown to remain stable after 25 minutes of joint unloading prior to T2 scanning in the hip. 13 In this study, T2 sequences were performed with a minimum of 45 minutes unloading prior to acquisition. As such our results are unlikely to be influenced by the loading status of the joint prior to scanning.
Conclusion
This study suggests that high activity levels may significantly affect acetabular cartilage composition during adolescence. The period of greatest susceptibility of cartilage to high load appears to be early adolescence. Cam morphology does not appear to be associated with cartilage damage at the anterosuperior acetabular rim during adolescence. Chondrolabral damage secondary to cam impingement likely occurs postadolescence. This would suggest that a time period exists for intervention prior to the development of irreversible cartilage damage in young athletes suffering from cam impingement. Potential interventions could aim to modify training load or type by substituting skills-based sessions for fitness training, avoiding high flexion exercises, or modifying hip and pelvic movements to avoid impingement. There may also be a role for active monitoring of cartilage composition for the development of pathology to inform early surgical intervention decision making. Further longitudinal research is required to validate these findings.
Footnotes
Acknowledgments and Funding
The author(s) disclosed receipt of the following financial support for the research, authorship, and/or publication of this article: This study was funded by the National Institute for Health Research (NIHR) Oxford Musculoskeletal Biomedical Research Unit and Clinical Research Network. Support was also received from the Arthritis Research UK Centre for Sport, Exercise and Osteoarthritis.
Declaration of Conflicting Interests
The author(s) declared the following potential conflicts of interest with respect to the research, authorship, and/or publication of this article: Authors Scott Fernquest, Antony Palmer, Claudio Pereira, Calum Arnold, Emma Hirons, John Broomfield, and Simon Newman have nothing to disclose. Sion Glyn-Jones receives payment for lectures including service on speakers bureaus from Zimmer-Biomet, Corin, and ConMed.
Ethical Approval
The study was approved by Oxford University Medical Sciences Inter-Divisional Research Ethics Committee (MSDIDREC-C2-2013-11).