
Abstract
Objective
To assess age-dependent and regional differences in T2* relaxation measurements in hip joint cartilage of asymptomatic volunteers at 3 T.
Design
Three age cohorts (cohort 1: age 20-30 years, 15 individuals; cohort 2: age 30-40 years, 17 individuals; cohort 3: age 40-50 years, 15 individuals) were enrolled. T2* values were obtained in the central and peripheral cartilage of the acetabulum and the femoral head in 7 regions (anterior to superior and posterior).
Results
T2* did not differ among age cohorts in acetabular cartilage (cohort 1: 24.65 ± 6.56 ms, cohort 2: 24.70 ± 4.83 ms, cohort 3: 25.81 ± 5.10 ms, P = 0.10) and femoral head cartilage (cohort 1: 27.08 ± 8.24 ms, cohort 2: 25.90 ± 7.82 ms, cohort 3: 26.50 ± 5.61 ms, P = 0.34). Analysis of the regional T2* distribution pattern indicates increased T2* values in the anterior, anterior-superior, superior-anterior, and the posterior-superior aspects of acetabular and femoral head cartilage. For acetabular cartilage, higher values were observed in the central region (25.90 ± 4.80 ms vs. 24.21 ± 4.05 ms, P < 0.0001) whereas femoral head cartilage did not reveal such differences (26.62 ± 5.74 ms vs. 26.37 ± 5.89 ms, P = 0.44).
Conclusions
The T2* analysis of presumably healthy hip joint cartilage does not seem to be stratified according to age in this population. Regional T2* variation throughout hip joint cartilage is apparent in this modality.
Introduction
Due to the awareness of pre-arthritic problems in the hip joint today, which, if left untreated, would lead to early osteoarthritis (OA) over the natural course of time, combined with the continued advances in the field of hip joint preservation surgery and cartilage repair techniques, a precise and reproducible assessment of hip joint cartilage is warranted. Such an assessment would assist as a decision guiding tool for physicians regarding various treatment options, including surgical and nonsurgical approaches, and also provide valuable information regarding disease onset and progression and, therefore, possibly facilitate the process of reviewing surgical outcomes and treatment follow-up objectively and in a reproducible manner.
Magnetic resonance imaging (MRI) is now considered the standard of care in morphological cartilage assessment. Highly precise morphological imaging of hip joint cartilage was initially considered ambitious due to the unique hip anatomy with its location deep in the pelvis, the spherical shaped cartilage, and—in particular regions—limited cartilage thickness. Over the past decade, MR scanners with high (≥3 T [Tesla]) field strengths and evolving cartilage-specific MR sequences have greatly improved the utility of morphological cartilage imaging, albeit the ability to delineate very early changes in the course of OA remains limited.
Supplementary to morphological MR cartilage assessment, biochemical sensitive MRI techniques (i.e., delayed gadolinium-enhanced magnetic resonance imaging of cartilage [dGEMRIC],1,2 T1rho imaging,3,4 glycosaminoglycan chemical exchange saturation transfer [gagCEST], 5 sodium imaging, 6 T2 mapping,7,8 and T2* mapping9,10) offer the ability to depict subtle cartilage changes before macroscopic alterations are notable; these techniques are well-documented, previously described, and published. Each of these techniques target biochemical changes that occur within cartilage boundaries during the process of cartilage degeneration. However, each method holds different advantages and disadvantages related to its clinical application. While some of these techniques are sensitive to the content of cartilage glycosaminoglycan (dGEMRIC, gagCEST, sodium imaging, T1rho imaging), T2 and T2* mapping is susceptible to the cartilage water content and interactions between water molecules and the collagen fiber network. Notably, while T1rho may not be as specific for proteoglycan as gagCEST, sodium, or dGEMRIC, there are now a moderate number of articles utilizing T1rho demonstrating that T1rho reflects the compositional changes seen in the early stages of OA including cohorts of hip dysplasia, femoroacetabular impingement (FAI), and hip OA.11,12
In particular, with recent concerns related to the questionable safety of gadolinium-involving methodologies,13,14 T2* mapping features substantial safety benefits when compared with other imaging techniques. 15 Without the need for contrast media, 3-dimensional (3D) cartilage assessment can be accomplished with comparatively short acquisition times and a high signal-to-noise ratio and high image resolution. Moreover, T2* mapping is easy to implement on clinical routine MRI systems without the need for specialized hardware components.
Despite the growing interest in the T2* mapping technique for articular cartilage assessment, to the best of our knowledge, no previously reported work has provided data for T2* relaxation among different age groups of healthy volunteers. Furthermore, an analysis of the sectoral/regional T2* distribution within the hip joint has not been performed.
A working knowledge about the “normal” T2* relaxation spectrum among presumably healthy hip joint cartilage is certainly necessary to be able to interpret the results of T2* cartilage assessments in different cartilage disease patterns. Therefore, aiming for T2* baseline values for hip joint cartilage in various age cohorts, this study investigated the age-dependent and regional distribution of T2* relaxation times in the hip joint cartilage of asymptomatic volunteers at 3 T.
Methods
This study met all regulations and was approved by the local ethics committee. All participants provided written informed consent prior to their enrollment.
Study Cohort
In this study, we analyzed the data of 47 healthy, asymptomatic volunteers. Subsequent to their admission, each individual was allocated into 3 age cohorts: cohort 1: age 20 to 30 years, 15 individuals, mean age: 25.9 ± 2.3 years (range: 21.1-29.1 years), 8 females, 7 males, 8 left hips, 7 right hips; cohort 2: age 30 to 40 years, 17 individuals, mean age: 34.1 ± 3.3 years (range: 30.4-39.6 years), 8 females, 9 males, 8 left hips, 9 right hips; cohort 3: age 40 to 50 years, 15 individuals, mean age: 44.7 ± 3.5 years (range: 40.1-49.8 years), 8 females, 7 males, 8 left hips, 7 right hips. As this study was conducted on a clinical MR scanner, data acquisition was limited to weekends and resources regarding measuring time were limited. Therefore, we included data for cohort 1 that had been previously published. 16 In that study, 35 asymptomatic volunteers (mean age 24.9 ± 2.1 years) served as a control for 29 patients with symptomatic FAI who underwent T2* mapping of the hip. For this study, the data of 15 individuals in the control group were randomly selected. Efforts were only made to ensure a balanced ratio of males and females as well as left and right hips. For cohort 2 and cohort 3, we recruited a total of 34 volunteers between 30 and 50 years of age. After reviewing their MRIs, 2 participants had to be excluded due to motion artifacts and an incidental diagnosis of asphericity of the femoral head. Therefore, the data of 47 volunteers underwent statistical analysis.
Although data acquisition for cohort 1 was achieved by a previous study, it has to be noted that there were no differences concerning volunteer recruitment, pre-MRI examination, or MRI protocol issues within all 3 age cohorts in this study. Each participant was asymptomatic regarding musculoskeletal-related pain in either the lower back, groin, or lower extremities, and none reported a history of hip or knee pain, no surgical interventions on the lower extremities, and no contraindications to undergoing MRI. A thorough physical examination was conducted prior to MRI for all individuals by an orthopedic consultant with 8 years of experience in hip joint surgery, revealing no clinical signs of any hip or knee joint pathology or deviation of the mechanical axis of both legs.
Magnetic Resonance Imaging
Magnetic resonance imaging was performed on a 3 T MR scanner (Magnetom Trio, Siemens Medical Solutions, Erlangen, Germany) with a body-matrix phased-array coil in the supine position. Efforts were made to increase the comfort on the examination table by stabilizing the hip with blankets and pillows and, therefore, keep motion artifacts to a minimum. To reduce potential diurnal effects, MRI was performed at the same time of the day, and each participant was reminded to keep physical activities to a minimum, although we did not supervise each study participant before the MRI.
The MRI protocol included a double-echo steady-state (DESS) sequence for morphological cartilage assessment (repetition time: 14.75 ms, echo time: 5.03 ms, flip angle: 25°, number of excitation: 1, field of view: 192 mm2, slice thickness: 0.6 mm, in-plane resolution: 0.6 × 0.6 mm, slice gap: 0.2 mm, bandwidth: 260 Hz/pixel, acquisition time: 13.17 minutes) followed by a GRE 3D multi-echo data image combination (MEDIC) sequence with 6 consecutive echoes for the T2* measurements (repetition time: 38 ms, echo times: 4.62 ms, 9.41 ms, 15.28 ms, 21.15 ms, 27.02 ms, 32.89 ms, flip angle: 25°, number of excitation: 1, field of view: 192 mm2, slice thickness: 0.6 mm, in-plane resolution: 0.6 × 0.6 mm, slice gap: 0.2 mm, bandwidth: 260 Hz/pixel, acquisition time: 13.29 minutes).
Data Analysis
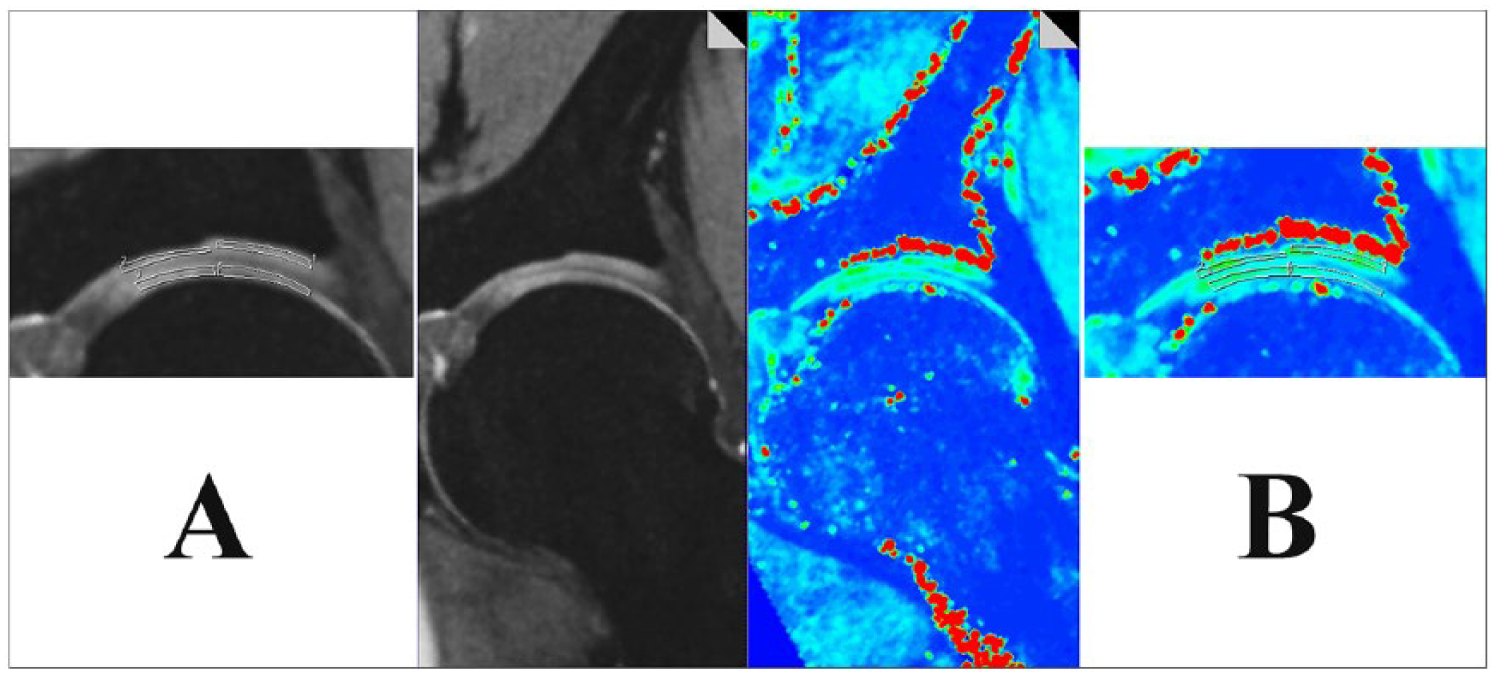
Image analysis was carried out by a qualified observer with a special interest in biochemically sensitive cartilage MRI and 8 years of experience in this field. After transferring all 3D MRI data sets to a Leonardo workstation (Siemens Medical Solutions, Erlangen, Germany), 7 radial reformats with a slice thickness of 2 mm were created by multiplanar reconstruction to depict the (1) anterior, (2) anterior-superior, (3) superior-anterior, (4) superior, (5) superior-posterior, (6) posterior-superior, and (7) posterior aspects of the hip joint. Using a region of interest (ROI) analysis, in each of these 7 regions, the articular cartilage of the acetabulum—and the corresponding cartilage of the femoral head—was further divided into central and peripheral cartilage, defined as 2 equally halves between the acetabular fossa and the chondro-labral junction. The corresponding DESS reformats served as guidance to ensure precise ROI placement within cartilage boundaries. Figure 1 illustrates the ROI placement within acetabular and femoral cartilage in DESS and corresponding T2* reformats.
In each of the 7 regions, T2* measurements (
Statistical Analysis
For the evaluation of age-related and regional dependencies on T2* measurements, a generalized estimated equation (GEE analysis) with Sidak correction for multiple comparisons was utilized and the Wald chi-squared values, mean T2* values ± standard deviation (SD), the 95% Wald confidence interval (CI), as well as P values were obtained. For the comparison between the 2 gender cohorts, we utilized Student’s t test for independent variables. P values <0.05 were considered to be statistically significant.
In 10 randomly selected volunteers, T2* values were obtained by a second observer for interobserver agreement (intraclass correlation testing, pairwise correlation model with absolute agreement). Notably, these measurements were obtained from the same reformats as the initial measurements to ensure analysis of the exact same cartilage regions.
Results
In this study, we analyzed a total of 1,316 ROIs (central and peripheral cartilage of the acetabulum and femoral head, 7 radial reformats, 47 participants); 239 ROIs (18.16%) were excluded from further analysis due to imaging artifacts, lacking a clear differentiation between femoral and acetabular cartilage, or apparent cartilage damage. Cartilage damage was obvious in 96 ROIs (44 ROIs in cohort 2, 52 ROIs in cohort 3; no apparent cartilage damage was noted in cohort 1). Therefore, a total of 1,021 ROIs underwent statistical analysis. The mean size of the ROI was 0.10 ± 0.04 cm2 (27.82 ± 10.55 pixels).
Regarding age-related T2* relaxation, neither for acetabular cartilage (cohort 1: 24.65 ± 6.56 ms, cohort 2: 24.70 ± 4.83 ms, cohort 3: 25.81 ± 5.10 ms, χ2 = 4.70, P = 0.10) nor for femoral cartilage (cohort 1: 27.08 ± 8.24 ms, cohort 2: 25.90 ± 7.82 ms, cohort 3: 26.50 ± 5.61 ms, χ2 = 2.13, P = 0.34) were any statistically significant differences noted between the different age cohorts. Table 1 summarizes the age-dependent distribution of mean T2* relaxation times for acetabular and femoral cartilage, and Table 2 provides a pairwise comparison testing.
T2* Values in Acetabular and Femoral Head Cartilage in Different Age Groups.
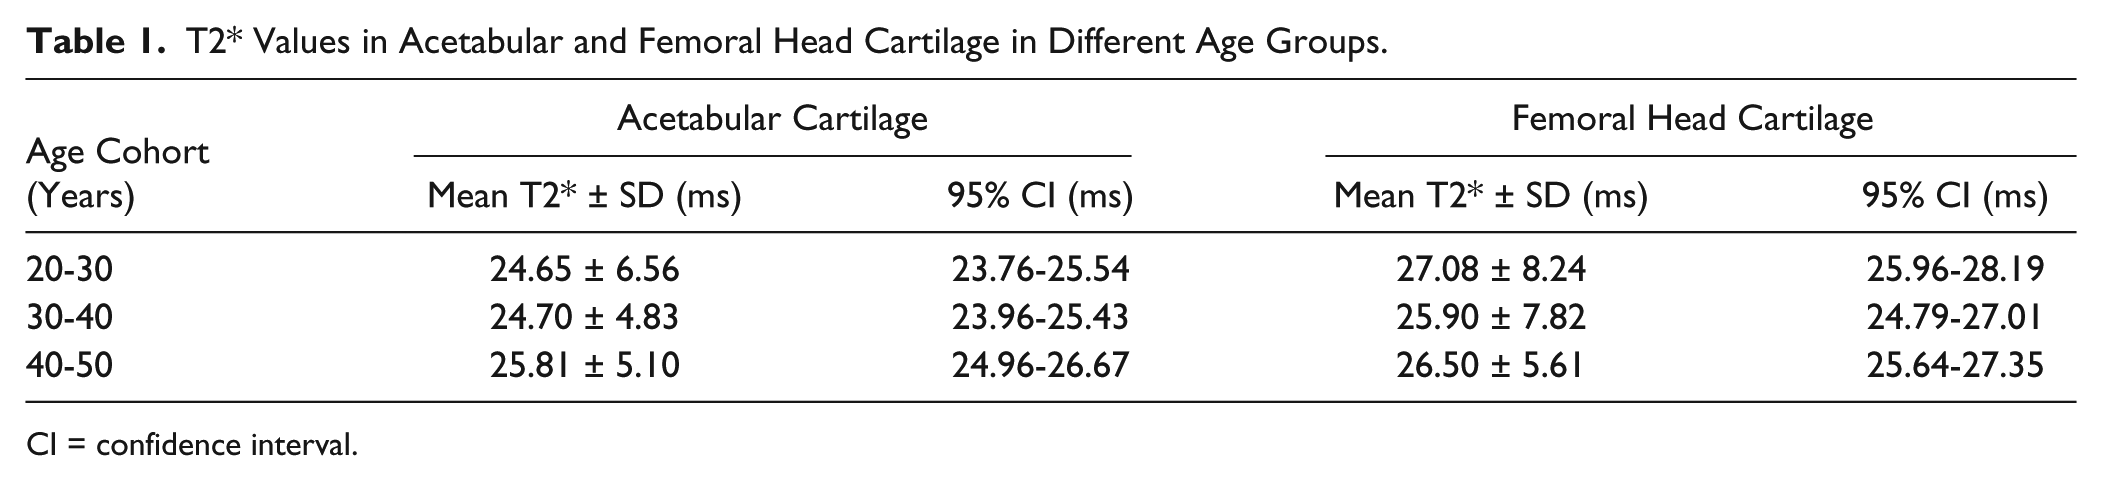
CI = confidence interval.
Pairwise Comparison between T2* Relaxation Measures of Acetabular and Femoral Cartilage in Different Age Groups.
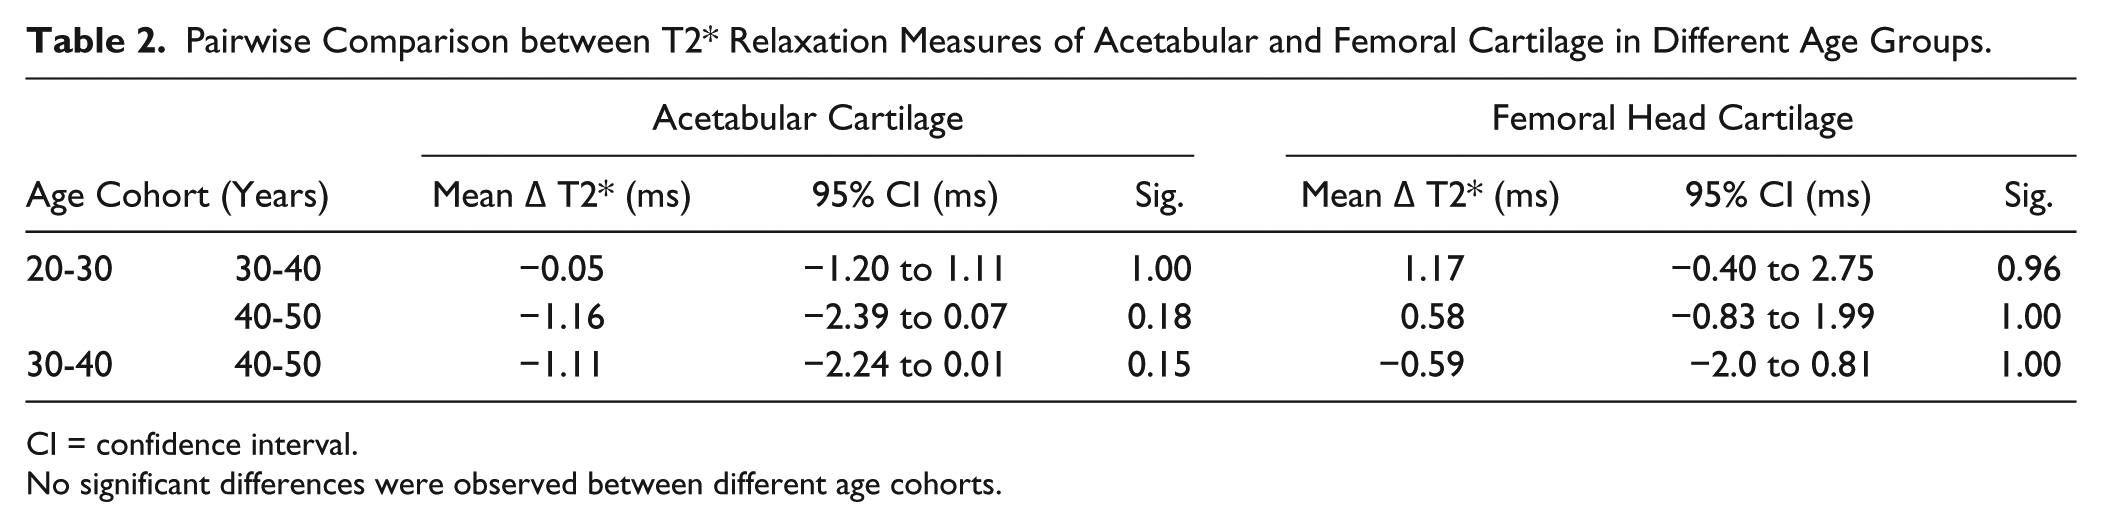
CI = confidence interval.
No significant differences were observed between different age cohorts.
Notably, we did observe regional differences in the T2* relaxation measures. Higher T2* values were detected in central acetabular cartilage when compared to peripheral acetabular cartilage (25.90 ± 4.80 ms vs. 24.21 ± 4.05 ms, P < 0.0001), whereas for femoral head cartilage, no significant differences (26.62 ± 5.74 ms vs. 26.37 ± 5.89 ms, P = 0.44) were noted between central and peripheral cartilage.
An analysis of the regional distribution of T2* relaxation times within the cartilage of the acetabulum and the femoral head among the 7 radial reformats revealed higher values for the anterior, the anterior-superior, and the superior-anterior aspects of the hip joint. Furthermore, the posterior-superior region of acetabular and femoral cartilage revealed superior values when compared to the adjacent regions (except for posterior-superior compared to superior-posterior in acetabular cartilage, where a P value of 0.08 was noted). Mean T2* values for acetabular cartilage were noted between 23.03 ± 3.31 ms (superior-posterior) and 27.18 ± 5.14 ms (anterior-superior). T2* values for femoral head cartilage amounted between 23.60 ± 4.35 ms (posterior) and 29.64 ± 4.76 ms (superior-anterior). The regional distribution of T2* relaxation times for acetabular and femoral head cartilage is shown in Figure 2 and Table 3 . The pairwise comparison is presented in Table 4 .
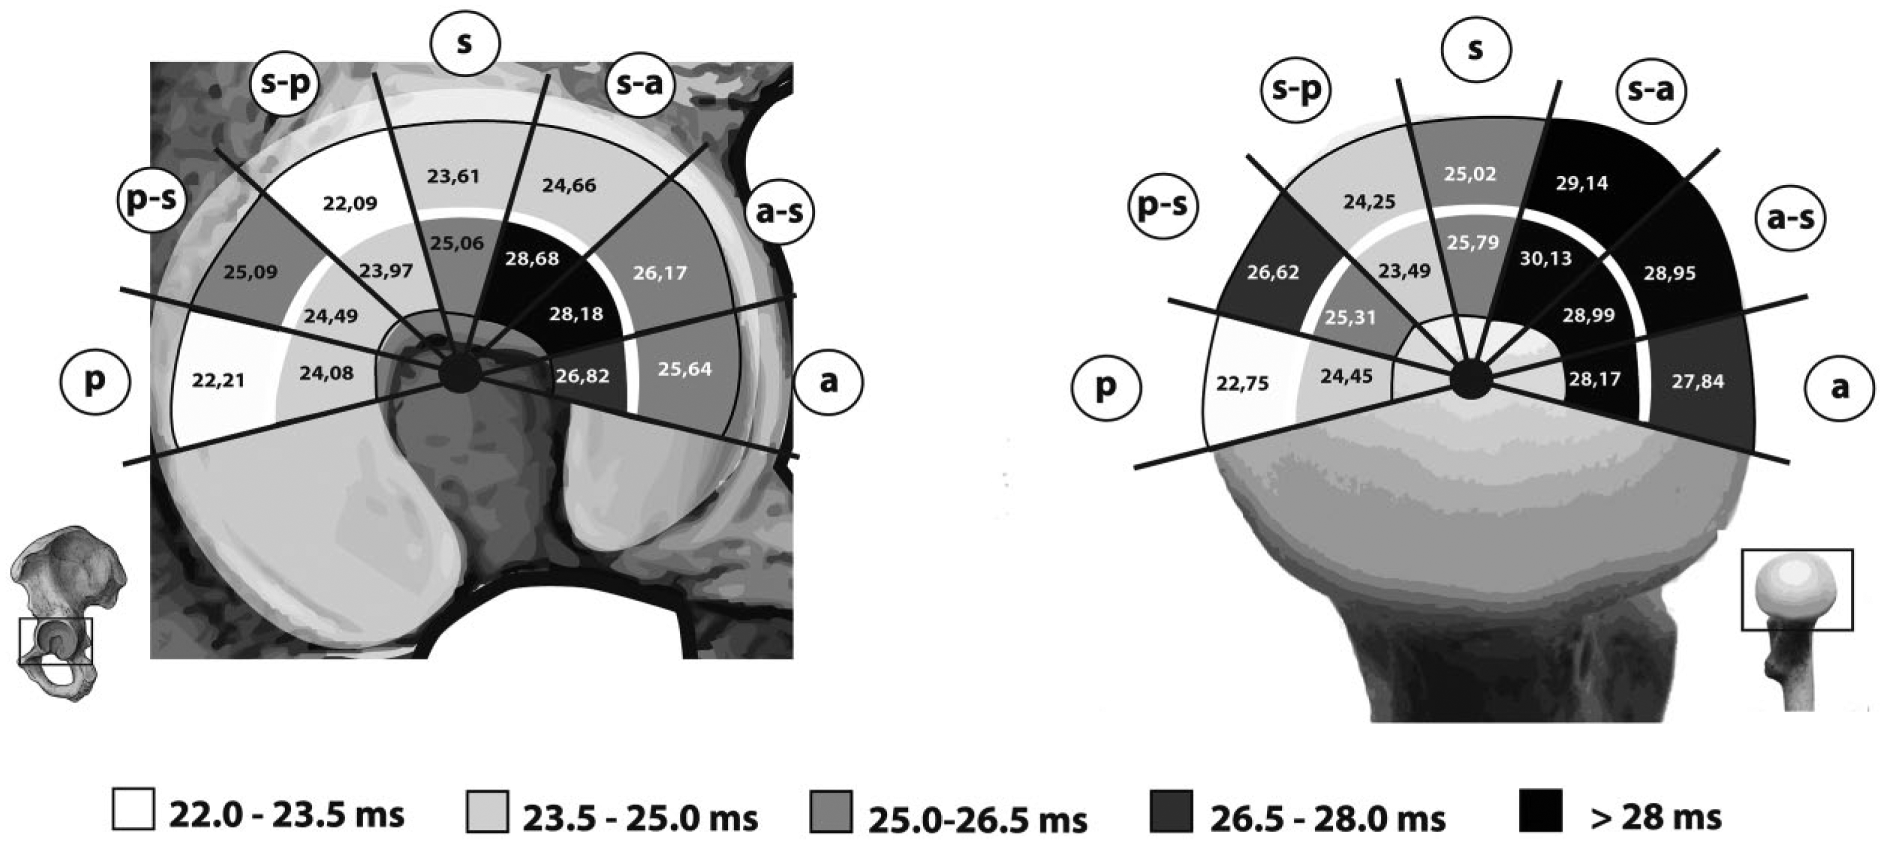
Regional/sectoral distribution of mean T2* values in acetabular (left) and femoral head (right) cartilage. Notably, higher values in the anterior, anterior-superior, and superior-anterior regions were identified. When compared to the adjacent regions, higher values were also observed in the posterior-superior region of both acetabular and femoral head cartilage. a = anterior; a-s = anterior-superior; s-a = superior-anterior; s = superior; s-p = superior-posterior; p-s = posterior-superior; p = posterior.
T2* Values in Acetabular and Femoral Head Cartilage in Different Regions of the Hip Joint.
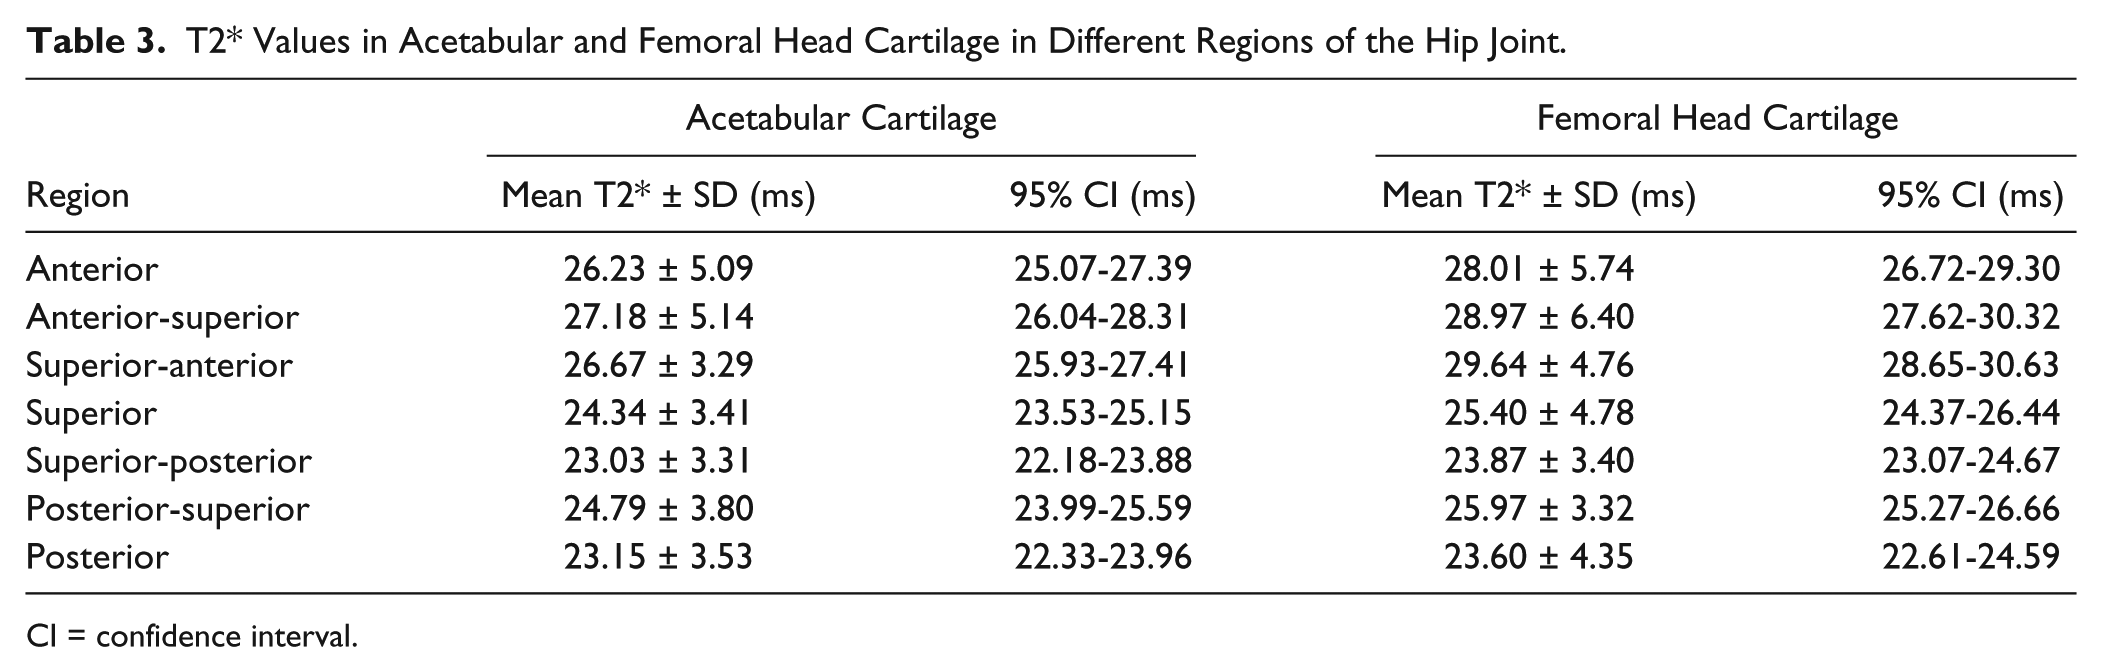
CI = confidence interval.
Pairwise T2* Comparison of Acetabular and Femoral Head Cartilage in Different Regions of the Hip.
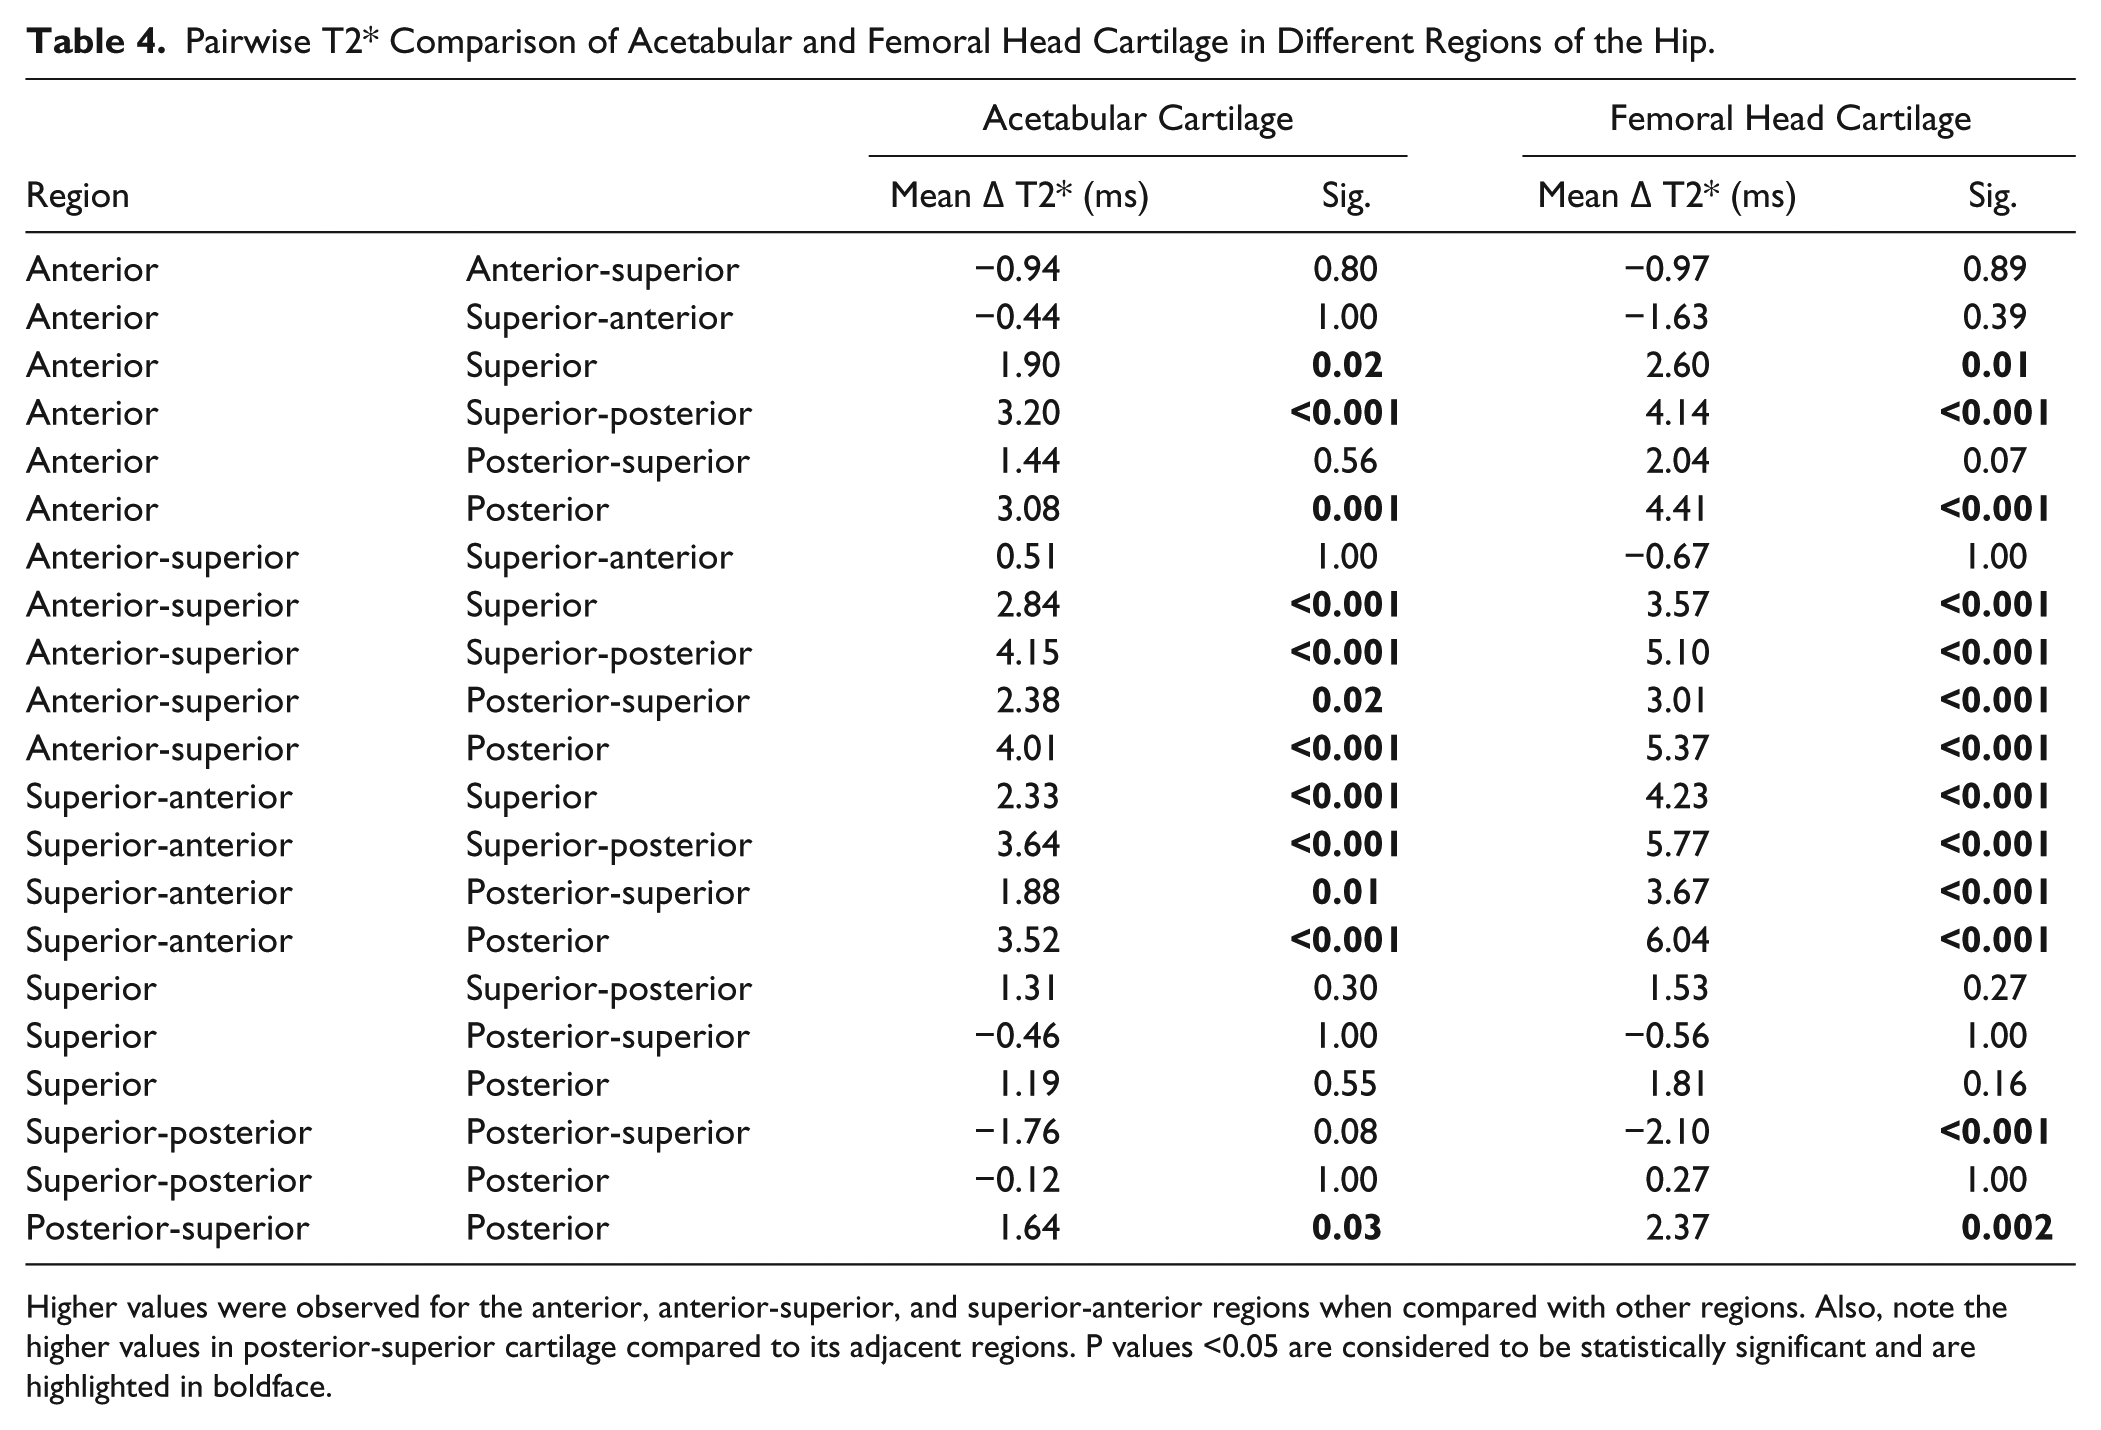
Higher values were observed for the anterior, anterior-superior, and superior-anterior regions when compared with other regions. Also, note the higher values in posterior-superior cartilage compared to its adjacent regions. P values <0.05 are considered to be statistically significant and are highlighted in boldface.
An evaluation between the 2 gender cohorts revealed no differences between acetabular (female: 25.12 ± 4.29 ms vs. male: 25.28 ± 4.32 ms, P = 0.68) or femoral (female: 26.95 ± 4.85 ms vs. male: 26.37 ± 4.59 ms, P = 0.15) cartilage.
Intraclass correlation coefficient (ICC) analysis indicated a high interreader reproducibility of the T2* measurement in this study (ICC 0.74, P = <0.0001 for acetabular cartilage; ICC 0.85, P = <0.0001 for femoral head cartilage).
Discussion
In this study, we investigated age-dependent differences and the regional/sectoral distribution pattern of T2* relaxation times in the hip joint cartilage of asymptomatic volunteers at 3 T with morphologically normal cartilage. Regarding age, no significant differences in the T2* values for both acetabular and femoral cartilage were observed among the 3 cohorts. In addition, regional disparities in T2* relaxation were apparent with higher values in central acetabular cartilage compared to peripheral acetabular cartilage, as well as superior levels in the anterior to superior-anterior as well as the posterior-superior region of both acetabular and femoral head cartilage.
When assessing hip joint cartilage using the T2* mapping modality, baseline values of presumably healthy cartilage are mandatory to interpret the obtained T2* values in potentially damaged cartilage regions. Our findings are similar to those in previously reported in vivo studies on T2* cartilage assessment of hip joint cartilage in which asymptomatic controls served as a source of baseline T2* values for acetabular and femoral cartilage.16-19 However, there are little data available on the topography of the T2* relaxation pattern of hip joint cartilage, which becomes increasingly important in pathological conditions such as FAI, where cartilage damage can frequently be observed in distinct cartilage regions (e.g., labral-chondral junction in the cam-type FAI).
The first descriptive report on T2* relaxation in hip joint cartilage was published in 2009. 17 In that study, 10 asymptomatic volunteers (mean age 27.0 ± 1.9 years, range 25-31 years) served as a control for 33 patients with symptomatic FAI. After morphological grading, T2* and dGEMRIC measurements were compared. Regarding the group of asymptomatic volunteers, mean T2* values were reported between 32.7 ± 4.5 ms in cartilage that was graded to have no morphological alterations and values of 29.1 ± 4.0 ms in cartilage with minor surface irregularities and changes in signal intensity. Notably, this study was conducted using a 1.5-T MR scanner, which made a distinct differentiation between acetabular and femoral cartilage impossible. Therefore, acetabular and femoral cartilage was evaluated as one entity during the ROI assessment. As T2* relaxation is sensitive to the water content, joint fluid between the 2 articulating cartilage layers likely biased the T2* evaluation in that study, resulting in slightly higher T2* values compared to our findings. The same limitation was pointed out by Miese et al. 18 In their group of 10 healthy participants (mean age 24 years, range 19-29 years) who served as a control for patients with slipped capital femoral epiphysis, T2* values between 23.06 ± 2.68 (central hip cartilage) and 29.83 ± 3.86 (medial hip cartilage) were reported using a 1.5-T MR scanner.
A 3-T MR scanner may remedy this limitation as the higher field strength offers the capability of higher image resolution, which is, in turn, beneficial because it is able to differentiate better between acetabular and femoral head cartilage in most cartilage regions. Acquired in asymptomatic volunteers on a 3-T MR scanner, recently reported T2* baseline values for acetabular and femoral cartilage are very similar to the findings of this study, ranging from 22.9 ± 3.0 ms to 26.0 ± 5.0 ms.16,19
There are little available data on hip joint cartilage that provide important clinical information about regional heterogeneities in the T2* relaxation pattern. Similar to our results, Apprich et al. 19 noted regional heterogeneity with higher T2* values in the anterior aspect of the hip joint than in the superior region (26.64 ± 4.3 ms vs. 22.67 ± 2.7 ms, P = 0.012). The authors contribute these findings primarily to (1) the magic angle effect that promotes an increase in T2/T2* relaxation when collagen fibers are orientated 54.7° to the main magnetic field and (2) possible differences in collagen density, fiber orientation, and water content in weight-bearing and non–weight-bearing cartilage regions.
An increase in T2/T2* relaxation when collagen fibers are orientated at an angle of approximately 55° is referred to as the magic angle effect.20,21 This phenomenon might have contributed to the heterogeneity of regional T2* distribution in this study, as comparatively higher values were observed in the anterior-superior and posterior-superior region (which are closest to the magic angle). Similar to the findings of Apprich et al. and our results, Watanabe et al. 22 described increasing T2 mapping measures for femoral head cartilage toward the magic angle. In their study, single-plane radial T2 mapping analysis was conducted in 6 acetabular and 12 femoral head regions (12 healthy volunteers; mean age 29.5 ± 4.9 years), and radial sections were defined stepwise every 10° from a center line that was drawn through the center of the femoral head, perpendicular to the main magnetic field. Femoral T2 values appeared to steadily increase toward the magic angle and were shown to peak between 40° and 50° and (symmetrically with respect to the central line) −40° to −50°. The unexpected findings of lower values at 50° to 60° (respectively −50° to −60°) led to the authors to hypothesize that collagen fiber orientation that is not perpendicular to the subchondral bone might contribute to lowering the expected angle of highest T2 relaxation. Notably, in the study by Watanabe et al., these findings were only present in femoral head cartilage, while acetabular cartilage did not show superior values in these particular regions. Although not statistically significant, when comparing the posterior-superior and superior-posterior region (P = 0.08), our results strongly point toward an influence of the magic angle in acetabular cartilage as well. Not only the magic angle effect but also the biomechanics of the hip during motion, loading conditions, and alterations in the biochemical composure of weight-bearing and non–weight-bearing cartilage likely contribute to these regional differences in T2* relaxation of femoral and acetabular cartilage.
We do acknowledge some limitations in this study. Our study group was fairly small and data acquisition for the various age cohorts was obtained at different points in time. Although both MRI protocols were identical and fastidious efforts were made to ensure standardized volunteer recruitment and physical examination before MRI, we cannot rule out the possibility that this might have possibly biased our results. Our study did not comprise a standardized protocol for pre-MRI activities to rule out possible alterations in joint loading among the study cohort. However, while previously published data revealed a load dependency for T2 relaxation in knee cartilage, 8 a recently conducted study 23 provides evidence that joint loading prior to image acquisition and diurnal effects do not seem to bias hip joint cartilage assessment utilizing T2* mapping. Of note, in this study we investigated full-thickness femoral and acetabular cartilage, although—for T2* cartilage assessment—a typically zonal stratification with higher T2* values in superior cartilage regions and lower values toward the radial zone (where water molecule restriction and T2* decay is promoted due to the characteristically perpendicular collagen fiber orientation and high proteoglycan content) is well documented. 15 In a recently published study on zonal and regional T2* relaxation in different morphological grades of knee joint cartilage, Bittersohl et al. noted a decrease of T2* values with increasing cartilage degeneration in both superior and deeper cartilage layers, with only a slightly more pronounced decrease in T2* between a modified Mankin grade 1 and grade 2/3 in superficial layers. 24 Given this rather steady decrease of T2* in superficial and deep cartilage layers in normal appearing cartilage and cartilage with higher grades of degeneration, we believe our methodology is appropriate for the purpose of this study. However, future studies, including an analysis of both superficial and deep cartilage layers are needed to shed further light on this topic.
Gradient-echo–based MRI techniques including the DESS and MEDIC (T2* mapping) sequence lack the 180° refocusing pulse making them prone to local susceptibility fields. These susceptibility fields, which are pronounced at the cartilage/bone interface and by foreign body particles like postsurgical debris or artificial implants, can compromise the assessment of cartilage, in particular when MRI is performed in the postoperative setting. Note should be made that minor changes to the highly organized basilar components of cartilage close to the tidemark, which have very short T2* relaxation times (estimated T2* values in deep and calcified cartilage = 1-2 ms 25 ), may have been underestimated considering the TE range of our T2* mapping technique (TE min = 4.62 ms). As reported previously, changes in these deep cartilage zones may be better picked up by utilizing ultra-short echo time (TE range: 0.5-40 ms) T2* mapping techniques.26,27 Nevertheless, limitations in these studies including small study samples have to be taken into account and each method holds different advantages and disadvantages related to its clinical application.
In conclusion, our results emphasize a regional distribution pattern for T2* relaxation among hip joint cartilage in asymptomatic volunteers, with superior values in the anterior to the superior-anterior aspects of the joint. Furthermore, the posterior-superior region appears to have higher T2* relaxation values when compared to its adjacent regions. Asymptomatic hips do not show evidence of any inconsistency in T2* values among different age cohorts. These results may further help establish T2* baseline values for hip joint cartilage that can serve as a reference, especially in cartilage disease studies, where cartilage degeneration might occur with topographic variation.
Footnotes
Authors’ Note
This study was conducted at the Heinrich-Heine University Hospital, Düsseldorf, Germany
Acknowledgments and Funding
We would like to thank Mr. Sebastian Ullrich, who helped with conducting the statistical analysis in this study, and Mr. Shane Bass, who provided parts of the art work. The author(s) received no financial support for the research, authorship, and/or publication of this article.
Declaration of Conflicting Interests
The author(s) declared no potential conflicts of interest with respect to the research, authorship, and/or publication of this article.
Ethical Approval
Ethical approval for this study was obtained from the Ethics Committee of the Heinrich-Heine University Düsseldorf (Study number 5218R, Register-ID 2015094276)
Informed Consent
Written informed consent was obtained from all subjects before the study.