
Abstract
Objective
Our aim was to compare T2 with delayed gadolinium-enhanced magnetic resonance imaging of cartilage (dGEMRIC) in the hip and assess the reproducibility and effect of joint unloading on T2 mapping.
Design
Ten individuals at high risk of developing hip osteoarthritis (SibKids) underwent contemporaneous T2 mapping and dGEMRIC in the hip (10 hips). Twelve healthy volunteers underwent T2 mapping of both hips (24 hips) at time points 25, 35, 45, and 55 minutes post offloading. Acetabular and femoral cartilage was manually segmented into regions of interest. The relationship between T2 and dGEMRIC values from anatomically corresponding regions of interests was quantified using Pearson’s correlation. The reproducibility of image analysis for T2 and dGEMRIC, and reproducibility of image acquisition for T2, was quantified using the intraclass correlation coefficient (ICC), root mean square coefficient of variance (RMSCoV), smallest detectable difference (SDD), and Bland-Altman plots. The paired t test was used to determine if difference existed in T2 values at different unloading times.
Results
T2 values correlated most strongly with dGEMRIC values in diseased cartilage (r = −0.61, P = <0.001). T2 image analysis (segmentation) reproducibility was ICC = 0.96 to 0.98, RMSCoV = 3.5% to 5.2%, and SDD = 2.2 to 3.5 ms. T2 values at 25 minutes unloading were not significantly different to longer unloading times (P = 0.132). SDD for T2 image acquisition reproducibility was 7.1 to 7.4 ms.
Conclusions
T2 values in the hip correlate well with dGEMRIC in areas of cartilage damage. T2 shows high reproducibility and values do not change beyond 25 minutes of joint unloading.
Introduction
Compositional magnetic resonance imaging (MRI) techniques have been proposed to act as noninvasive surrogate markers of discrete matrix alterations in cartilage that may precede surface damage and the development of osteoarthritis (OA). 1 A plethora of compositional sequences exist; however, delayed gadolinium-enhanced magnetic resonance imaging of cartilage (dGEMRIC) and T2 mapping are arguably the most researched and widely used. Yet a number of issues need to be resolved before they can reliably be used in large-scale clinical trials and in clinical practice. 1
dGEMRIC of the hip is a well-validated compositional MRI technique that indirectly measures cartilage glycosaminoglycan (GAG) content. 2 There is a strong correlation between in vivo dGEMRIC values and histological grade of early OA in the hip. 3 dGEMRIC is also capable of predicting disease progression in dysplasia 4 and femoroacetabular impingement (FAI) in the hip. 5 However, dGEMRIC requires the use of intravenous gadolinium-based contrast agents. This results in significant logistical issues due to the required delay between contrast administration and MRI acquisition. Moreover, these contrast agents are potentially nephrotoxic,6,7 and repeated use of linear gadolinium-based contrast agents, such as Magnevist, 2 can result in gadolinium deposition in brain tissue. 8 Indeed, Magnevist 2 has been used in the majority of dGEMRIC validation studies but is no longer available due to concerns raised over the potential neurological effects of deposited gadolinium.8,9 Accordingly, non–contrast-based cartilage-imaging techniques may offer greater clinical applicability.
T2 mapping is thought to be sensitive to the water content of cartilage and the integrity of the collagen network,10,11 but may also measure GAG content. 12 A correlation between T2 relaxation times and histological severity of early OA has been shown, 13 and T2 mapping has been found to enhance the ability to diagnose early OA. 14 In contrast to dGEMRIC, T2 mapping does not require the use of a contrast agent and is available on all clinical scanners. Therefore, it is likely that T2 mapping will become more commonly used than dGEMRIC for the assessment of early compositional cartilage changes. However, T2 mapping has not been as well validated as dGEMRIC for clinical use in the hip.
The anterosuperior acetabular cartilage has previously been identified as the initial area of cartilage damage in the pathogenesis of FAI and OA.5,15 Low dGEMRIC values in this area can predict future OA in FAI populations. 5 Whether T2 mapping values are affected similarly to dGEMRIC values by diseased hip cartilage in FAI remains largely unknown. The correlation between these 2 sequences has been inconsistent and poorly defined in the limited studies performed in the hip in individuals with FAI to date.16,17
The reproducibility of T2 mapping in the hip also remains an issue. Significant heterogeneity exist in the literature with regard to scan protocol, magnetic field strength, scanner and coil vendor, segmentation methodology, and interindividual and diurnal variation in cartilage values. These issues are likely responsible for the large variability in normal and abnormal cartilage values and levels of reproducibility reported.18-20
A further concern affecting the adoption of T2 mapping into routine clinical scans is the influence of joint loading on T2 values. Differences in T2 relaxation times between normal and diseased tissue are more pronounced after unloading the knee 21 and hip. 22 However, the optimum time period of unloading the hip prior to MRI, after which T2 values in the hip remain stable, is undetermined.
The aims of this study were to (1) determine whether dGEMRIC correlates with T2 mapping values in the hip in individuals at high risk of developing OA; (2) establish the reproducibility of image analysis for T2 mapping and dGEMRIC, in the hip in individuals at high risk of developing OA; and (3) investigate the effect of joint loading and determine the optimal offloading time prior to T2 mapping in the hip in healthy volunteers.
Methods
Ethical approval for this study was granted by Oxfordshire Research Ethics Committee B (07Q1605/26).
Population
The study consisted of 2 distinct cohorts. (1) Ten participants of the SibKid study5,15 selected at random during follow-up assessments to receive dGEMRIC and T2 mapping evaluation. SibKids are thought to be at high risk of developing hip OA through their strong family history and high prevalence of cam-type FAI. Participants were asymptomatic with a minimum joint space width >2.5 mm and Kellgren-Lawrence Grade <2 on anteroposterior radiograph.23,24 Cam-type FAI was defined by the presence of an alpha angle greater that 60° on anteroposterior radiograph. (2) Twelve healthy volunteers with no history of hip pathology received T2 mapping of both hips at different time points.
MRI Protocol
Imaging was performed using a 3T clinical platform (Achieva 3.0T X-series; Philips Healthcare, Eidhoven, Netherlands) with surface hip coils (medium and large; Philips Healthcare).
T2 Mapping
Two-dimensional T2 mapping: Fast spin echo (FSE) pulse sequence, repetition time (TR) 3500 ms, first echo time (TE) 13.5 ms, echo spacing (ES) 13.5 ms, total number of echoes: 7 (13.5 ms, 27 ms, 30.5 ms, 44 ms, 57.5 ms, 71 ms, 94.5 ms), echo train length (ETL): 94.5 ms, flip angle 180°, field of view (FOV) 273 mm × 150 mm, bandwidth 191 Hz/pixel, slice thickness 3 mm, slice gap 0.8 mm, acquisition matrix 292 × 278, reconstructed pixel size 0.51 × 0.52 × 3 mm, NEX 1, SENSE factor: 2.0. Acquisition time 8 minutes.
dGEMRIC
A total of 0.2 mM/kg of Magnevist (dimeglumine gadopentetate, 2 Bayer Schering Pharma, Germany) was administered intravenously. An exercise protocol was completed with 10 minutes of walking on a treadmill at 4 km/h followed by 150 hip movements (50 flexion, 50 internal rotation, 50 external rotation) to ensure full perfusion of the gadolinium into the articular cartilage. 25 Seventy-five minutes after contrast administration the dGEMRIC sequence was commenced. Sequence parameters comprised sagittal 3D turbo field echo (TFE) with 180° inversion prepulse, TR 6 ms, TE 2.9 ms, flip angle 12°, bandwidth 289 Hz/pixel, prepulse time delays (IR) 2100, 1200, 600, 250, and 105 ms, FOV 180 mm × 180 mm, slice thickness 3 mm, no slice gap, turbo factor 30, SENSE factor 1.4, acquisition matrix 208 × 209 (interpolated to 512 × 512), acquired pixel size 0.86 × 0.86 × 3 mm. To attain sufficient signal-to-noise ratio at short IR, the total time between inversion pulses (TRTOTAL) was held constant at 2200 ms. Acquisition time was 8 minutes per sequence. Total scan time was 45 minutes.
T2 and dGEMRIC sequences were acquired in true sagittal plane with the first slice referenced off the medial border of the femoral head with the remaining slices extending laterally.
Image Acquisition
SibKid Cohort: dGEMRIC and T2 Mapping
Participants underwent T2 mapping and dGEMRIC of a single hip in 2 scanning sessions during one visit. T2 mapping was performed in the first scanning session after 25 minutes unloading. IV contrast was then administered and dGEMRIC was performed 75 minutes later during the second scanning session.
Healthy Volunteer Cohort: T2 Mapping
Volunteers underwent T2 mapping of both hips. Volunteers lay non–weight-bearing for 20 minutes prior to transfer onto the MRI table. Positioning time was 5 minutes. Imaging was performed on alternate hips to ensure complete repositioning of the participant and coils, without the participant weight-bearing between scans, in the following sequence: right hip, left hip, right hip, and left hip, with patient repositioning between scans. T2 mapping was therefore performed at time points 25 minutes (right hip) (20 minutes unloading plus 5 minutes positioning), 35 minutes (left hip), 45 minutes (right hip), and 55 minutes (left hip). The FOV for T2 scans 1 and 3 (right hip) and 2 and 4 (left hip) was repositioned using the same landmarks to ensure anatomical alignment of slices.
Image Analysis
Images were manually segmented using OsiriX software (Version 6.0.2 64 Bit, Pixmeo, Geneva, Switzerland). dGEMRIC segmentation was performed on 1200 inversion time images, and T2 mapping segmentation was performed on 13.5 ms echo time image. ROIs were developed based on a clockface around the center of the femoral head at 30° intervals. Regions were referenced from the 12 o’clock position that passes through the center of the femoral head parallel to the axis of the proximal femur diaphysis. The 3 o’clock boundary was positioned perpendicular to this line and represented an anterior position for both hips. Femoral and acetabular cartilage were segmented separately and ROIs were not extended beyond where there was adjacent femoral and acetabular cartilage, hence did not include the chondrolabral junction ( Fig. 1 ). Each scan gave approximately 15 sagittal slices through the hip. The number of slices per hip from which articular cartilage was segmented varied between patients depending on hip size and image quality but was consistently between 4 and 6.
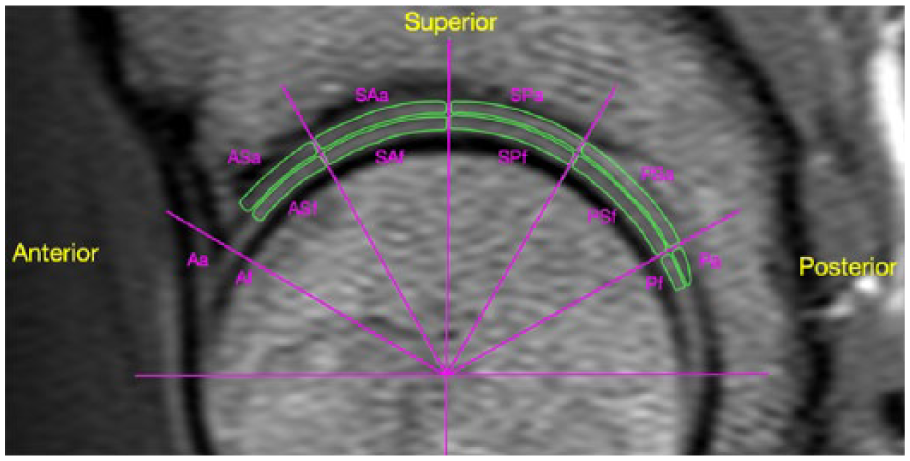
Example regions of interest (ROI) for MRI segmentation.
Quantitative T1 (dGEMRIC) and T2 (T2 mapping) maps were generated using custom code (MATLAB R2015a, MathWorks, Natick, MA). Quantitative T1 maps were generated by averaging signal intensity from segmented areas on co-registered prepulse time delay images and fitting a mono-exponential T1 recovery curve using a nonlinear algorithm. Quantitative T2 maps were generated using a sum of squares algorithm on co-registered echo time images and fitting a mono-exponential T2 recovery curve using a nonlinear algorithm. The time to complete imaging analysis and subsequent processing for each individual ranged from 90 to 120 minutes.
T2 and dGEMRIC Comparison in SibKid Cohort
Anatomically corresponding ROIs were compared to determine the correlation of T2 and dGEMRIC values in different areas of the joint. An average T2 and dGEMRIC value for the anterosuperior acetabular cartilage (comprising ROIs anterior acetabular [Aa], anterosuperior acetabular [ASa], and superoaneterior acetabular [SAa] cartilage) was also compared. The anterosuperior acetabular cartilage has previously been identified as the initial area of cartilage damage, and the area most severely affected, in the pathogenesis of FAI and OA.5,15 Low dGEMRIC values in this area can predict future OA. 5
Reproducibility
Reproducibility of T2 and dGEMRIC Image Analysis (Scan Segmentation) in SibKid Cohort
The reproducibility of image analysis was determined by comparing relaxation times from the same ROIs in participants’ hips from the same scan segmented at separate time points. Segmentation was repeated for T2 and dGEMRIC scans of all the participants from the SibKid cohort by the primary observer (academic orthopedic clinician) 2 weeks after the initial measurements. Interobserver readings were performed by an independent investigator (academic orthopedic clinician).
Reproducibility of T2 Image Acquisition in Healthy Volunteer Cohort
Scans from all 4 time points underwent manual segmentation by a single observer (academic orthopedic clinician). The reproducibility of image acquisition and effect of joint unloading was determined by comparing relaxation times of anatomically corresponding ROIs in the same hip scanned at different time points. Relaxation times were therefore compared between the first right hip scan at time point 25 minutes (scan 1) and the second right hip scan at time point 45 minutes (scan 3). Similarly, the first left hip scan at time point 35 minutes (scan 2) was compared with the second left hip scan at time point 55 minutes (scan 4).
Statistical Analysis
All data were normally distributed. The relationship between T2 and dGEMRIC data was quantified using Pearson’s correlation. T2 values are directly proportional to cartilage damage, whereas dGEMRIC values are inversely proportional to cartilage damage; therefore, a negative coefficient will suggest agreement between the 2 sequences. Differences in relaxation times of ROIs between scans 1 and 3, and scans 2 and 4, were evaluated using the paired t test.
Reproducibility of T2 image acquisition (repeat scans) and T2 and dGEMRIC segmentation was assessed using intraclass correlation coefficients (ICCs) of the mean values for each ROI and were categorized as poor (ICC < 0.69), fair (ICC 0.7-0.79), good (ICC 0.8-0.89), or high (ICC > 0.9). 26 The smallest detectible difference (SDD; mean change ± 1.96 × SD of the change), and root mean square of the coefficient of variance (RMSCoV; root mean square of the change divided by the mean, multiplied by 100) 18 were also calculated. Determining the reproducibility of a compositional sequence is vital to differentiate true change from measurement noise. The SDD of image analysis (segmentation) is likely to represent the level above which difference in compositional values from repeat scans can be considered significant. Bland-Altman plots were used to evaluate bias between the mean differences of repeat scans and to estimate an agreement interval. 27 Statistical software Stata 12.0 (College Station, TX) was used for analysis, and significance was set at P < 0.05.
Results
Cohort
SibKid Cohort
Ten volunteers (4 females, 6 males, mean age 59 years, range 44-64) underwent dGEMRIC and T2 scanning of a single hip (6 right and 4 left). All hips were found to have cam-type FAI morphology on anteroposterior radiographs (average alpha angle 70.7°, SD 10.6).
Healthy Volunteer Cohort
Twelve healthy volunteers (7 males, 5 females, mean age 37.5 years, range 31-52) underwent T2 mapping of both hips.
T2 and dGEMRIC Correlation in SibKid cohort
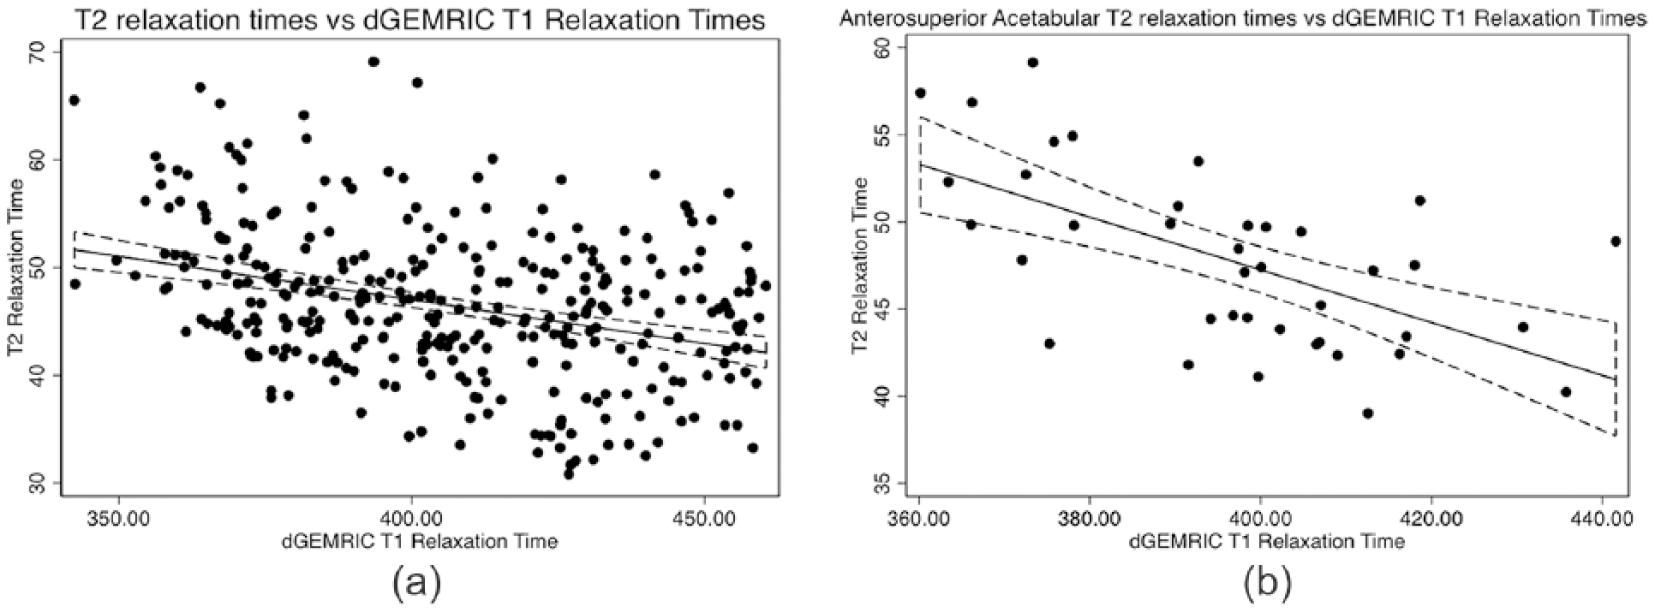
Combining all ROIs from the 10 hips of the SibKid cohort (n = 398) dGEMRIC and T2 absolute values showed a statistically significant but weak negative correlation (r = −0.34 P = <0.001) ( Table 1 and Fig. 2a ). A stronger correlation was found when selecting the anterosuperior acetabular cartilage (Aa, ASa, and SAa; n = 39) (r = −0.61, P = <0.001; Fig. 2b ). Significant variation was seen in correlation between different ROIs, with the highest correlation in the anterosuperior acetabular regions (ASa; r = −0.71, P = <0.001), and no significant correlation in the anterior femoral regions.
Correlation of T2 and dGEMRIC absolute values.
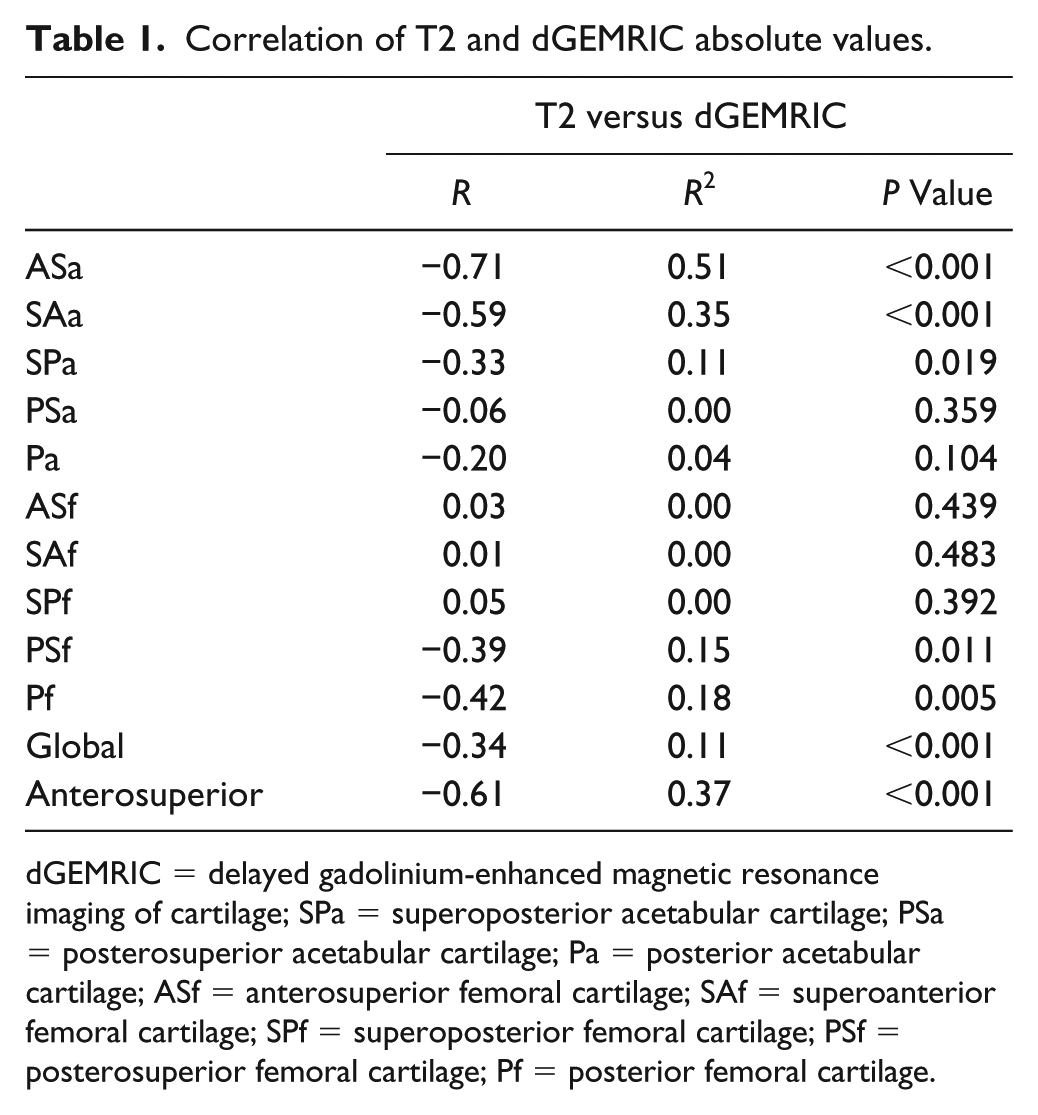
dGEMRIC = delayed gadolinium-enhanced magnetic resonance imaging of cartilage; SPa = superoposterior acetabular cartilage; PSa = posterosuperior acetabular cartilage; Pa = posterior acetabular cartilage; ASf = anterosuperior femoral cartilage; SAf = superoanterior femoral cartilage; SPf = superoposterior femoral cartilage; PSf = posterosuperior femoral cartilage; Pf = posterior femoral cartilage.
(
dGEMRIC Image Analysis (Segmentation) Reproducibility in SibKid Cohort
Intraobserver reproducibility for all ROIs from dGEMRIC scans of the 10 hips in the SibKid cohort (n = 215) ICC was 0.99 (0.98-0.99), RMSCoV 3.0% (2.4-3.6), and SDD 26.3 ms (22.3-29.3). Interobserver reliability combining all ROIs (n = 215), ICC was 0.98 (0.97-0.98), RMSCoV 4.2% (3.3-5.0), and SDD 37.3 ms (30.6-43.9) ( Table 2 ).
Intra- and Interobserver Reproducibility of dGEMRIC Image Analysis in SibKid Cohort.
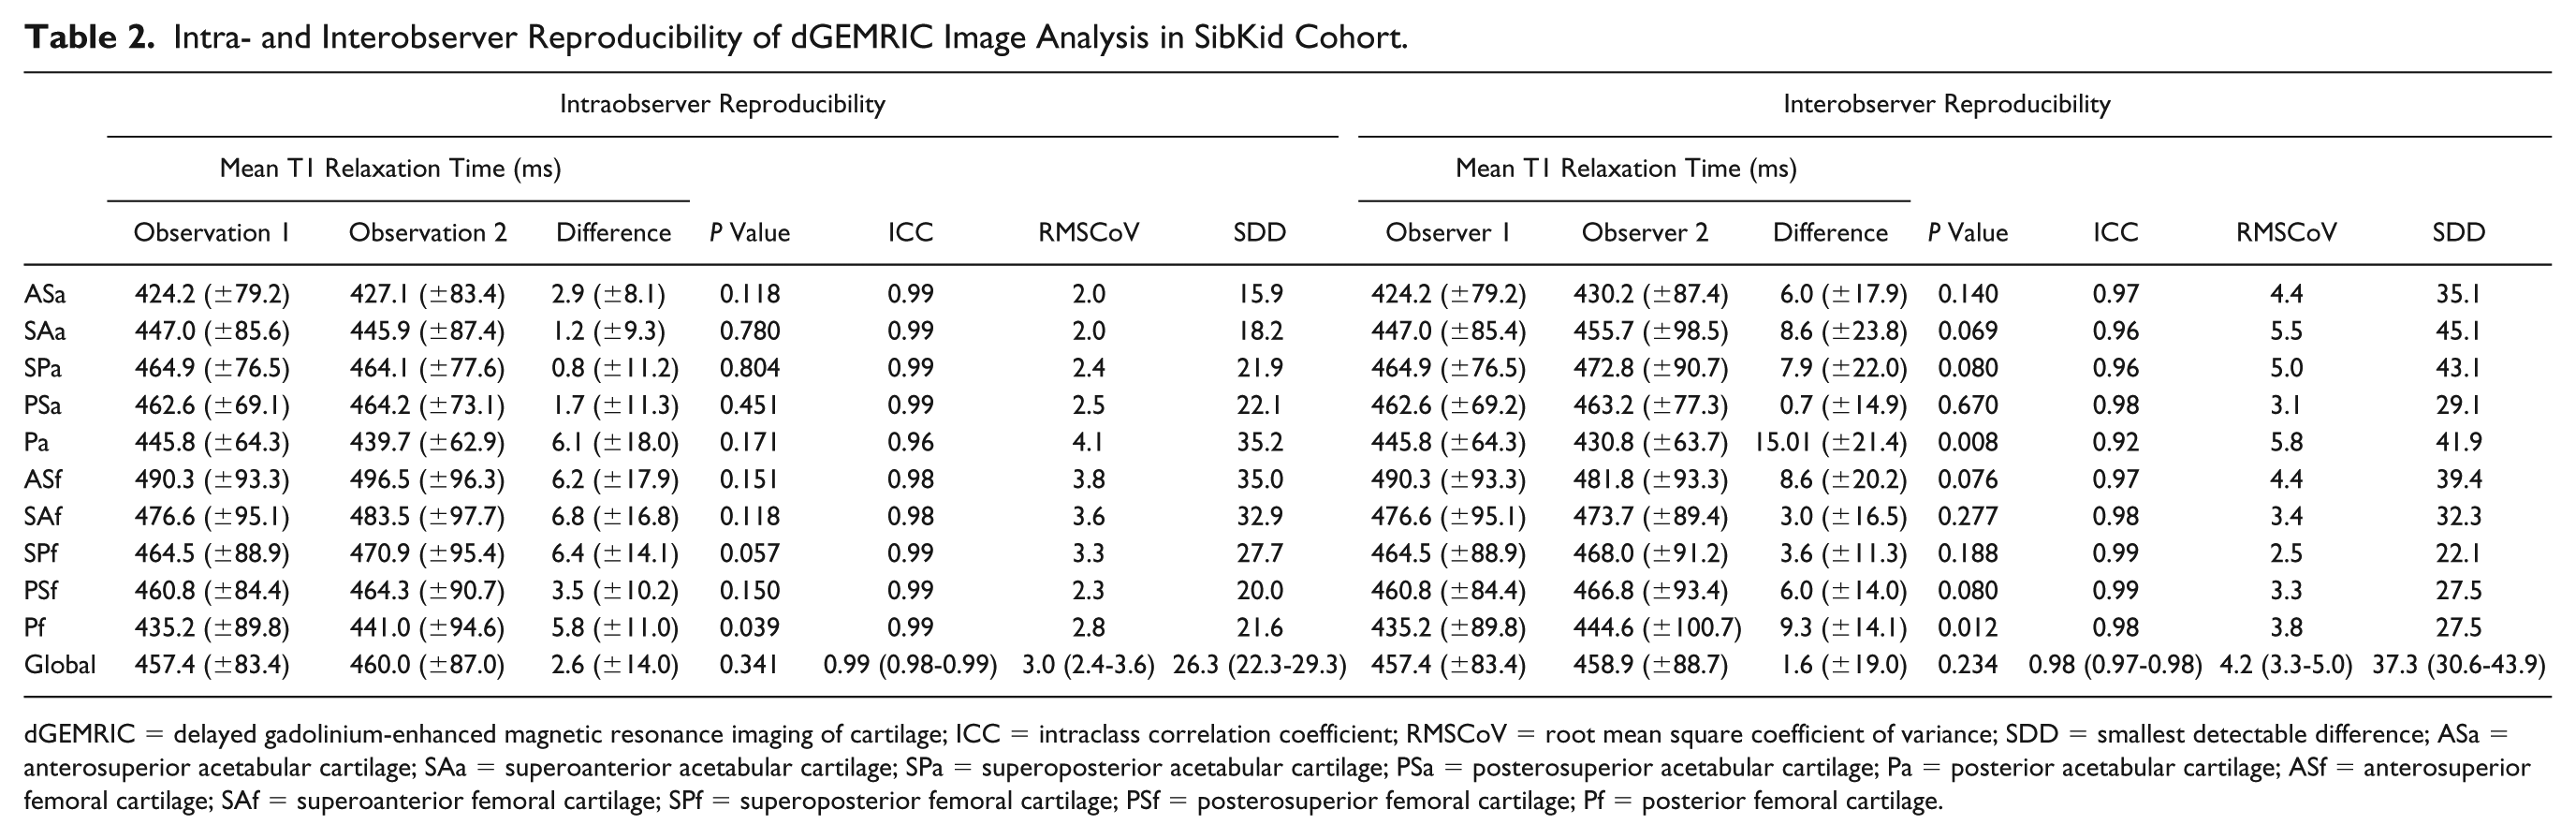
dGEMRIC = delayed gadolinium-enhanced magnetic resonance imaging of cartilage; ICC = intraclass correlation coefficient; RMSCoV = root mean square coefficient of variance; SDD = smallest detectable difference; ASa = anterosuperior acetabular cartilage; SAa = superoanterior acetabular cartilage; SPa = superoposterior acetabular cartilage; PSa = posterosuperior acetabular cartilage; Pa = posterior acetabular cartilage; ASf = anterosuperior femoral cartilage; SAf = superoanterior femoral cartilage; SPf = superoposterior femoral cartilage; PSf = posterosuperior femoral cartilage; Pf = posterior femoral cartilage.
T2 Image Analysis (Segmentation) Reproducibility in SibKid Cohort
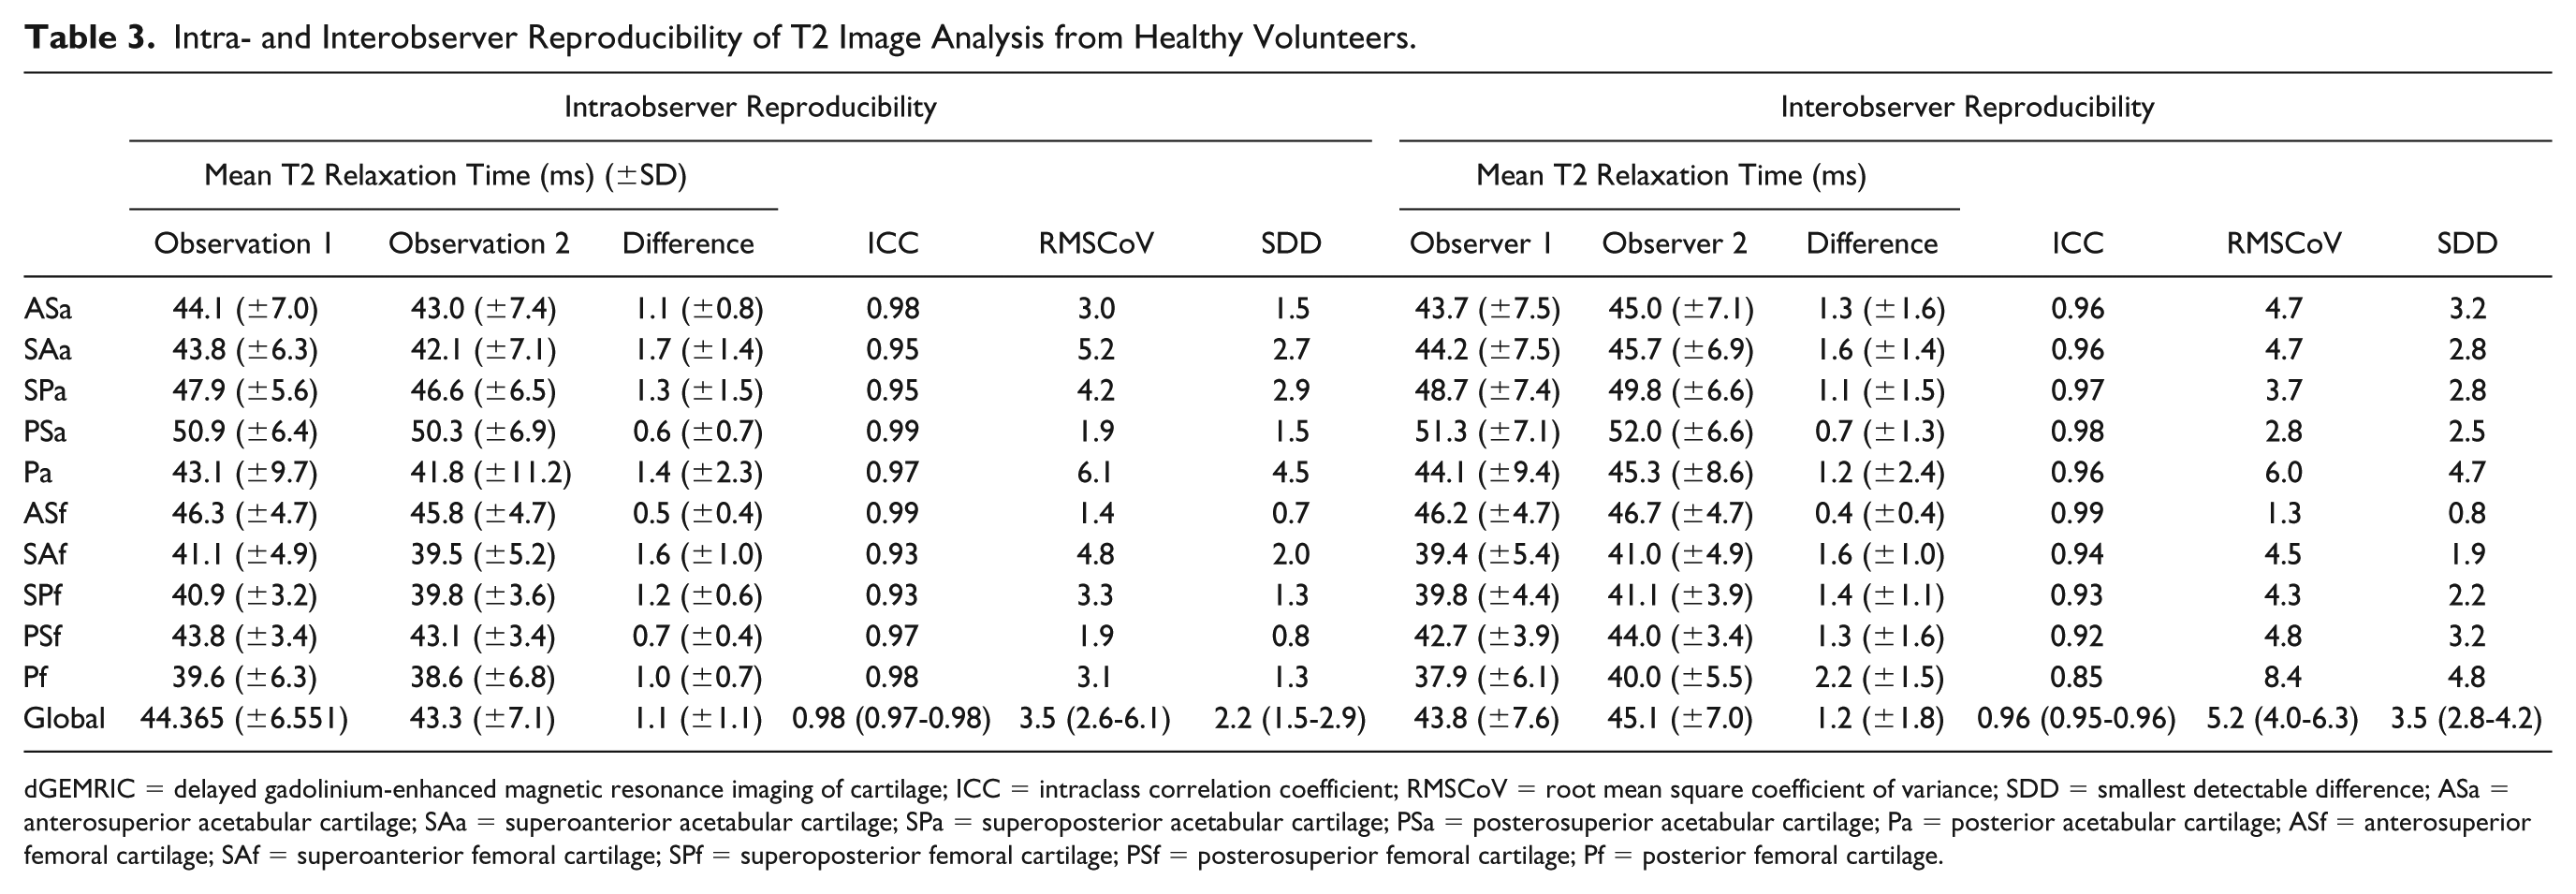
Intraobserver reproducibility combining all ROIs from T2 scans of the 10 hips in the SibKid cohort (n = 399) was ICC 0.98 (95% CI: 0.97-0.98), RMSCoV 3.5% (95% CI: 2.6-6.1), and SDD 2.2 ms (95% CI: 1.5-2.9). Interobserver reproducibility combining all ROIs (n = 283) was ICC 0.96 (95% CI: 0.95-0.96), RMSCoV 5.2% (95% CI: 4.0-6.3), and SDD 3.5 (95% CI: 2.8-4.2) ( Table 3 ).
Intra- and Interobserver Reproducibility of T2 Image Analysis from Healthy Volunteers.
dGEMRIC = delayed gadolinium-enhanced magnetic resonance imaging of cartilage; ICC = intraclass correlation coefficient; RMSCoV = root mean square coefficient of variance; SDD = smallest detectable difference; ASa = anterosuperior acetabular cartilage; SAa = superoanterior acetabular cartilage; SPa = superoposterior acetabular cartilage; PSa = posterosuperior acetabular cartilage; Pa = posterior acetabular cartilage; ASf = anterosuperior femoral cartilage; SAf = superoanterior femoral cartilage; SPf = superoposterior femoral cartilage; PSf = posterosuperior femoral cartilage; Pf = posterior femoral cartilage.
T2 Image Acquisition Reproducibility/Effect of Joint Unloading in Healthy Volunteer Cohort
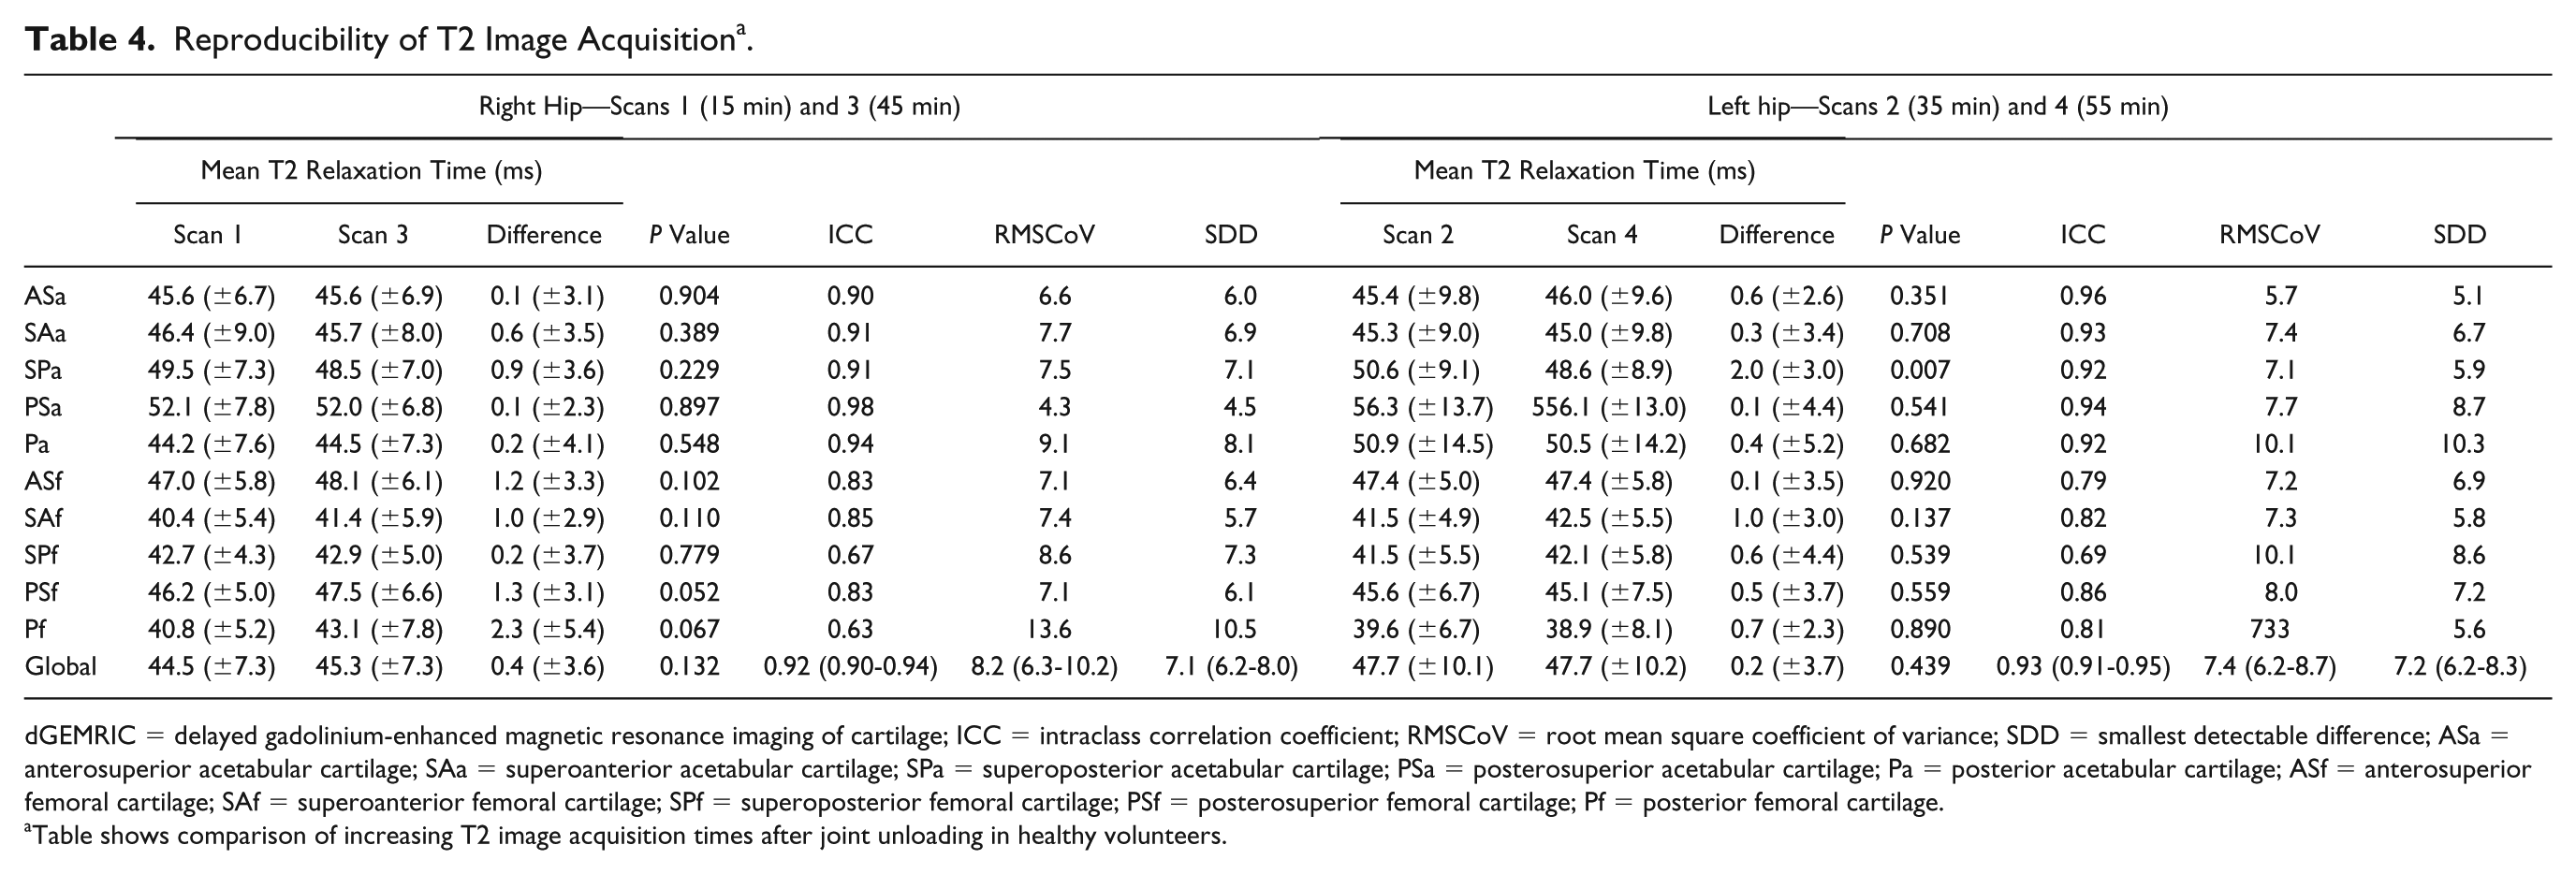
There was no statistically significant difference in the mean relaxation time of all ROIs (n = 659) from T2 scans of all 24 hips in the healthy volunteer cohort between scans 1 and 3 (all ROIs n = 330, P = 0.132) and scans 2 and 4 (all ROIs n = 329, P = 0.439). Mean T2 relaxation time of all segmented cartilage was as follows: scan 1 right 44.5 ms (SD 7.3) (time point 25 minutes), scan 2 left 47.7 ms (SD 10.1) (time point 35 minutes), scan 3 right 45.3 ms (SD 7.3) (time point 45 minutes), scan 4 left 47.7 ms (SD 10.2) (time point 55 minutes) ( Table 4 ).
Reproducibility of T2 Image Acquisition a .
dGEMRIC = delayed gadolinium-enhanced magnetic resonance imaging of cartilage; ICC = intraclass correlation coefficient; RMSCoV = root mean square coefficient of variance; SDD = smallest detectable difference; ASa = anterosuperior acetabular cartilage; SAa = superoanterior acetabular cartilage; SPa = superoposterior acetabular cartilage; PSa = posterosuperior acetabular cartilage; Pa = posterior acetabular cartilage; ASf = anterosuperior femoral cartilage; SAf = superoanterior femoral cartilage; SPf = superoposterior femoral cartilage; PSf = posterosuperior femoral cartilage; Pf = posterior femoral cartilage.
Table shows comparison of increasing T2 image acquisition times after joint unloading in healthy volunteers.
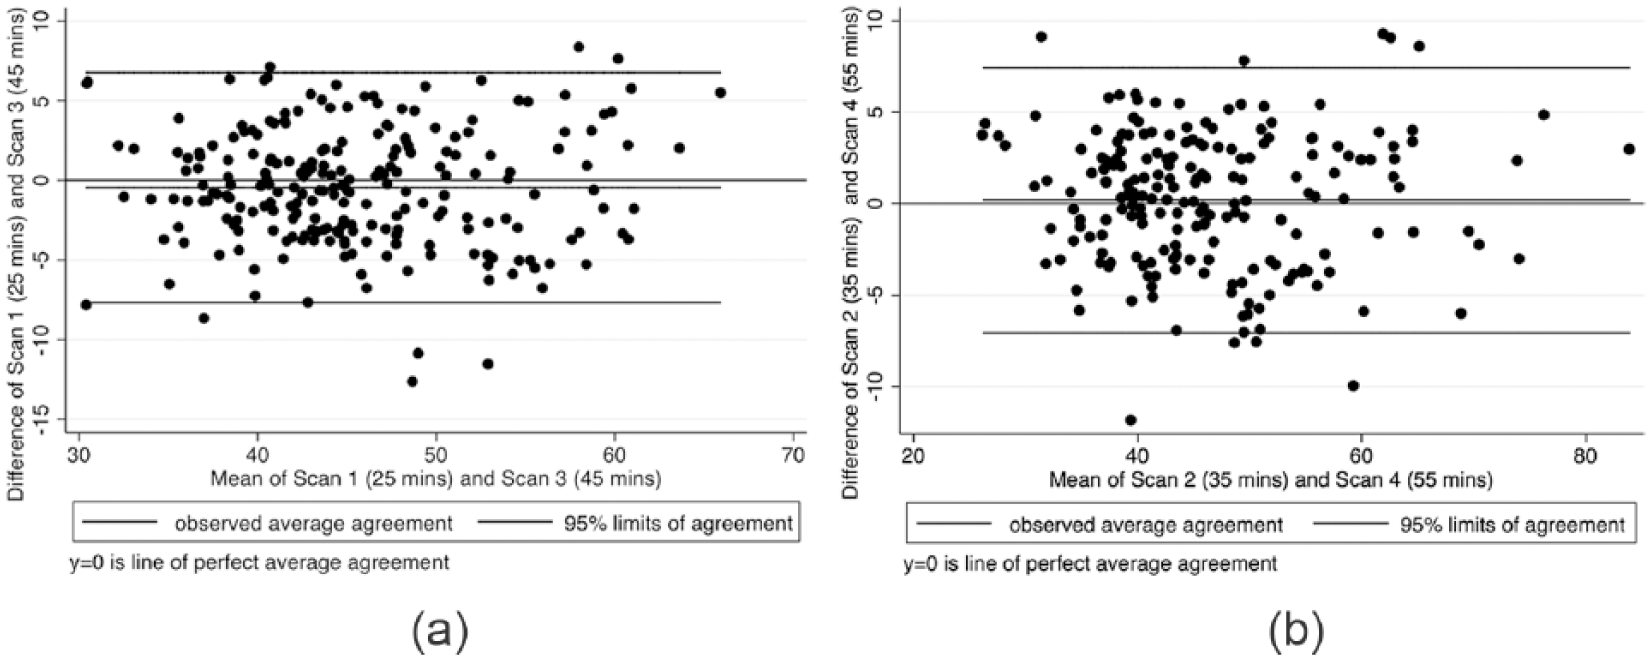
Considering all ROIs (n = 659), ICC was 0.92 (95% CI: 0.90-0.94) for scans 1 and 3 and 0.93 (95% CI: 0.91-0.95) for scans 2 and 4, RMSCoV was 8.3% (95% CI: 6.3-10.2) for scans 1 and 3 and 7.4% (95% CI: 6.2-8.7) ( Fig. 3 ) for scans 2 and 4, and SDD was 7.1 ms (95% CI: 6.2-8.0) for scans 1 and 3 and 7.2 ms (95% CI: 6.2-8.3) for scans 2 and 4 ( Table 4 ). Bland-Altman plots showed an average difference of −0.5 ms (95% CI: −7.7 to 6.8) for scans 1 and 3 ( Fig. 3a ) and 0.2 ms (95% CI: −7.0 to 7.4) for scans 2 and 4 ( Fig. 3b ).
(
Discussion
The results from this exploratory study suggest that T2 values correlate well with dGEMRIC values in the anterosuperior acetabulum of individuals at high risk of developing OA. This study also reports that T2 mapping shows high acquisition and analysis reproducibility and there is no difference in T2 values beyond 25 minutes of joint unloading prior to scanning.
T2 mapping is likely to supersede dGEMRIC for the assessment of clinically relevant early compositional cartilage alteration. Logistically difficult scanning protocols and the requirement for intravenous contrast in dGEMRIC makes its future use uncertain. Indeed, in 2017 the European Medicines Agency published guidelines advocating restricted use of gadolinium, 9 and Magnevist has been unavailable in the United Kingdom since 2018. However, the sensitivity and specificity of T2 mapping as a marker of cartilage matrix alterations remains uncertain, especially when compared with better validated sequences such as dGEMRIC. 28 Moreover, the reproducibility of T2 mapping and effect of joint unloading in the hip remains unknown.18-20,22
A number of alternative compositional sequences exist that perhaps offer more comparative methods of cartilage assessment to dGEMRIC: gagCEST and T1Rho being two of the more established. gagCEST is sensitive to GAG levels 29 and is similarly capable in distinguishing healthy from damaged cartilage when compared to dGEMRIC. 30 However, in vivo MRI findings have not yet been compared with tissue histology and the gagCEST sequence requires field strengths greater than 3 Tesla.31,32 Disagreement exists over the tissue parameter T1rho is most sensitive to, whether that be GAG content or collagen fiber orientation, 28 and its reproducibility in the hip remains largely unstudied.19,33 Given the uncertain future of dGEMRIC, and limitations of gagCEST and T1Rho, T2 mapping is arguably the most viable compositional sequence that could be employed as a routine clinical investigation.
Our study found a significant but weak correlation between global dGEMRIC and T2 values, with a stronger correlation in the anterosuperior acetabulum. A possible explanation for this is that T2 and dGEMRIC measure separate entities; dGEMRIC detects GAG content, 2 whereas T2 is sensitive to the collagen content, network, and fibril orientation, which determine the water content of cartilage.10,11,34 In areas of cartilage damage, such as the anterosuperior acetabulum in FAI, 35 where there is a low GAG content and disruption of the collagen network, there is strong correlation. However, in areas of presumed normal cartilage the GAG content and collagen network are not necessarily causally related there is a weaker correlation. This would suggest that T2 mapping is similarly as sensitive and specific as dGEMRIC in identifying areas of cartilage at risk of future degeneration in a susceptible population.
The levels of correlation we found between T2 and dGEMRIC are stronger than those reported by Klocke et al. (r = −0.095), 36 Taylor et al. (r = −0.19), 37 and Wei et al. (r = 0.003) 38 in the knee. This could be explained by the difference in cohorts and disease severity, and the accuracy of the T1 and T2 measurements. Compositional MRI is best suited to detecting pre-morphological biochemical changes in cartilage. The SibKid cohort did not demonstrate morphological OA at baseline, but a significant proportion (28%) did progress to radiographic OA within 5 years. 5 Klocke et al. compared T2 and dGEMRIC cartilage values in young patients with acute ACL rupture (mean age 23.2 years), and Wei et al. in young athletes with no known disease. Their cohort would be unlikely to have early OA changes, resulting in a weak correlation mirroring our findings in areas of healthy cartilage. Taylor et al. compared T2 and dGEMRIC in ex vivo samples taken from patients with end-stage OA and cadaveric joints rather than patients with early OA. Compositional MRI is unlikely to play a role in joint assessment once damage has progressed beyond focal or ultrastructural pathology, 28 thus limiting the usefulness of their findings.
Our results agree with those of Ascani et al. 17 and Hesper et al., 16 who suggested that dGEMRIC and T2 mapping could detect the earliest signs of cartilage damage in the hip. However, in contrast to our findings, cartilage values from the 2 sequences in the study by Hesper et al. did not significantly correlate (Pearson correlation coefficients were r = −0.22, P = 0.54, in the acetabular cartilage of symptomatic individuals and r = −0.05, P = 0.79, in asymptomatic individuals). 16 It should be noted however that Hesper et al. only evaluated a very small ROI at the chondro-labral junction measuring 3 to 6 mm. Accordingly, no comparison between the 2 sequences was made for the majority of the joint, and significant areas of cartilage damage found more superiorly could have been missed.
Only a few reproducibility studies for T2 mapping of the hip have been carried out to date.19,20 In this study, intraobserver reproducibility for T2 image analysis (segmentation) was high, consistent with previous reproducibility trials in the knee by Glaser et al. (RMSCoV 2.1% to 3.8%) 39 and Watanabe et al. (RMSCoV 3.7% to 5.3%), 40 and better than those found by Mosher et al. (RMSCoV 4.36% to 14%). 41 Interobserver reproducibility was better than that found by Ho et al. (ICC 0.24-0.68) 42 in a similar study. Intra- and interobserver reproducibility of dGEMRIC image analysis compared favorably with previous studies by Tiderius et al. 43 (RMSCoV <3%) and Bittersohl et al. 44 (global ICC: 0.95).
Our results for image acquisition reproducibility compared favorably to the work by Nemeth et al. investigating T2 mapping reproducibility in the hip. 20 Nemeth et al. reported a concordance correlation coefficient of 0.65 and estimated the precision of their repeatability measurements to be between 5.5% and 9.1% for T2 scans performed 30 minutes apart in the hip. Though it should be noted that Nemeth et al. segmented the acetabular and femoral cartilage as a single ROI, joint space inclusive. This segmentation methodology was likely responsible for the significantly worse levels of reproducibility seen when repeat scanning was performed at 2 weeks. 20
Bland-Altman plots for repeated scans of the same hip at different time points did not reveal any significant systematic bias in this study. Of interest, the confidence intervals for the average difference between scans 1 and 3, and between scans 2 and 4, were similar in magnitude to the SDD between repeated scans, at around 7 ms. The SDD is of vital importance in determining true change in compositional values from measurement error. It is likely that values above 7 ms may represent a meaningful change in cartilage composition in T2 mapping.
It is important to note the probable effect of manual segmentation on the values we have obtained in determining image acquisition reproducibility. The SDD for segmentation reproducibility was 2.2 ms. It is likely that T2 values above this threshold represent significant change introduced from another source, and T2 values below represent manual measurement noise. T2 image acquisition reproducibility reflects the acquisition and then manual segmentation of repeat imaging, from which the SDD was calculated as 7.1 ms and 7.4 ms. Therefore, the true variability in T2 values introduced by repeated scans may be closer to 5 ms. Though speculative, this should likely be taken into account when designing and interpreting clinical trials.
An area that requires attention is the lack of a uniform T2 mapping protocol and variation in pulse sequences between centers as well as different methods of calculating T2 values.15,45-47 This is highlighted by the work of Pai et al., 48 who found that the use of different T2 techniques can result in the mean T2 value ranging from 27 to 41 ms. A standardized protocol is required for clinical studies, not just for T2 mapping, but also for all compositional MRI studies.
Previous studies have demonstrated that joint unloading is critical for differentiating healthy and diseased cartilage, but this study suggests unloading beyond 25 minutes does not alter T2 values. This finding has significant clinical relevance relating to the routine use of T2 mapping in diagnostic imaging. Our results would suggest that T2 mapping can be incorporated into routine MRI protocols and performed after morphological sequences since T2 mapping values do not change beyond 25 minutes of joint unloading. Moreover, T2 mapping provides reproducible results. Accordingly, T2 mapping could potentially be used in the field of early hip OA management as a routine clinical screening tool to detect discrete intrachondral matrix alterations that may precede cartilage deterioration. This could aid patient risk stratification and decision-making in early intervention therapies.
There are limitations to this study. The large in plane resolution of the dGEMRIC scans increases the risk of partial volume effect (PVE). The magic angle effect and topographical variations in cartilage may also account for some difference in relaxation times between cartilage regions. 49 Shao et al. demonstrated that T2 values could be significantly increased near the magic angle to several times more than that caused by degenerative change. 50 Although it is difficult to determine the extent of impact of PVE and magic angle effect, the relaxation times observed in all areas of tissue segmented in this study were within accepted limits for normal and damaged cartilage. Moreover, no region of cartilage consistently showed a systematic increase or decrease in relaxation time throughout the cohort, suggesting the impact of PVE and magic angle effect may have been small. Scans were acquired in the true sagittal plane to allow adequate visualization and analysis of the clinically relevant anterosuperior acetabulum. 35 However, this is often at the expense of adequate visualization of the lateral acetabulum, which may also be clinically relevant and is better visualized by scans in the coronal plane. Acquisition reproducibility was performed in a single session and the effect of activity during the preceding days was not explored. The effect of unloading was also confined to healthy volunteers; however, our values suggest that a number displayed evidence of early degenerative change.
A further significant limitation of this study is the highly selected and small sample size. This study must therefore be considered exploratory, particularly results pertaining to the SibKid cohort, and further work is required to validate the results. However, the power of the statistical analysis performed in this study is aided by the relatively large dataset due to the high number of ROIs per hip.
Conclusion
In conclusion, this study found that unloading the hip joint for 25 minutes is adequate to achieve repeatable T2 values and that T2 values correlate to dGEMRIC values in areas of cartilage at risk of future degeneration. T2 mapping offers significant advantages over dGEMRIC due to logistically easier and temporally shorter scanning sessions without the requirement of contrast agents. T2 mapping could be incorporated into routine MRI protocols as a screening tool for discrete intrachondral matrix alterations that may precede cartilage deterioration. However, further work is required to validate this sequence in the hip, and it may be that a combination of compositional sequences as opposed to a single sequence may give the most comprehensive biochemical assessment of the hip cartilage.
Footnotes
Acknowledgments and Funding
We would like to thank Claudio Pereira for his invaluable assistance with participant assessments and MRI sequences. We would like to acknowledge funding support from the National Institute for Health Research (NIHR) Oxford Musculoskeletal Biomedical Research Unit.
Declaration of Conflicting Interests
The author(s) declared the following potential conflicts of interest with respect to the research, authorship, and/or publication of this article: Authors Scott Fernquest, Antony Palmer, Bonnie Gammer, Emma Hirons, Benjamin Kendrick, Henry De Berker, Neil Bangerter, and Andrew Carr have no conflicts of interest to disclose. Adrian Taylor receives payment for lectures including service on speakers bureaus from Depuy and Corin. Sion Glyn-Jones receives payment for lectures including service on speakers bureaus from Zimmer-Biomet, Corin, and ConMed.
Ethical Approval
Ethical approval for this study was granted by Oxfordshire Research Ethics Committee B (07Q1605/26).
Informed Consent
Written informed consent was obtained from all subjects before the study.