
Abstract
Objective
To assess differences in biochemical composition of the deep cartilage layer in subjects with type 2 diabetes mellitus (T2DM) and nondiabetic controls using UTE (ultra-short echo time) T2* mapping and to investigate the association of vascular health and UTE T2* measurements.
Design
Ten subjects with T2DM matched for age, sex, and body mass index with 10 nondiabetic controls. A 3D UTE sequence with 6 echo times was acquired using 3T magnetic resonance imaging of the knee. For UTE T2* analysis, the deep cartilage layer was segmented and analyzed in 5 compartments (patella, medial, and lateral femur and tibia). The ankle brachial index (ABI) was obtained in all subjects. Linear regression analyses were used to assess associations of T2DM and UTE T2* relaxation times and the associations of ABI measurements and UTE measurements.
Results
Compared with nondiabetic controls, T2DM subjects had significantly lower mean T2*-UTE in the patella (mean difference 4.87 ms; 95% confidence interval [CI] 1.09-8.65; P = 0.015), the lateral tibia (mean difference 2.26 ms; 95% CI 0.06-4.45; P = 0.045), and the lateral femur (mean difference 4.96 ms; 95% CI 0.19-9.73; P = 0.043). Independent of diabetic status, subjects with higher ABI values, indicating better vascular health, had higher T2*-UTE of the patella (coefficient 15.2; 95% CI 3.3-21.4; P = 0.017), the medial tibia (coefficient 9.8; 95% CI 1.0-18.6; P = 0.031), and the lateral femur (coefficient 18.8; 95% CI 3.3-34.3; P = 0.021).
Conclusions
T2*-UTE measurements of the deep cartilage layer were consistently lower in subjects with T2DM and in subjects with impaired vascular health, likely indicating increased mineralization of this layer.
Introduction
Diabetes mellitus and osteoarthritis (OA) are frequent health disorders with a rising prevalence.1,2 The National Diabetes Statistics Report of 2017 estimated that currently 9.4% of the total U.S. population has diabetes mellitus, which equates to 30.3 million people. 3 OA is the most common degenerative joint disorder and is characterized by cartilage breakdown and subsequent damage to adjacent joint structures, leading to pain and disability. 4 The most important risk factors for OA are higher body mass index (BMI) and age, with the prevalence of OA increasing from 13.5% in adults of 25 years and older, to 33.5% in adults older than 65 years. 5 However, beyond obesity and age-related OA, previous studies have suggested that metabolic disorders, such as type 2 diabetes mellitus (T2DM), may accelerate morphological joint degeneration.6-10
The association of T2DM and OA has been subject to a number of previous studies that found accelerated cartilage degeneration in subjects with T2DM compared to nondiabetic controls.6-12 However, little is known about the underlying biological mechanisms driving this accelerated cartilage degeneration. Previous studies have demonstrated that ultra-short echo time (UTE) T2* mapping (T2*-UTE) can be used to characterize the deep calcified cartilage layer.13-15 Moreover, it has been suggested that the deep calcified cartilage layer may be critically important in the pathogenesis of OA.16,17 However, to the best of our knowledge, the deep calcified cartilage layer has been virtually unexplored in subjects with metabolic disorders.
The purpose of this study was therefore to compare differences in the biochemical composition of the deep calcified cartilage layer, in subjects with T2DM and healthy nondiabetic controls, using UTE cartilage T2* mapping. Moreover, we aimed to investigate the association between vascular health, as another component of the metabolic OA phenotype, 18 and the biochemical composition of the deep calcified cartilage layer.
Method
Subject Selection
Study participants were recruited within an age range of 40 to 70 years. Bilateral knee radiographs were obtained in a posterior-anterior (PA) projection while subjects were weightbearing and Kellgren-Lawrence (KL) grades were determined, as previously reported. 19 Those with advanced radiographic OA in either knee (KL grade >2) and with knee pain most days of the month were excluded (>15 days over the last month), since previous studies have shown that quantitative assessment of cartilage composition may be limited once advanced cartilage defects occur. 20 We also excluded subjects with inflammatory arthropathic disorders, a history of knee injury or surgery, and with conditions excluded by magnetic resonance imaging (MRI) safety guidelines such as metal implants.
Ten subjects with T2DM were recruited for our study and group matched for age, sex, and BMI with 10 nondiabetic controls. Informed consent was obtained from all participants; the study was compliant with the Health Insurance Portability and Accountability Act and approved by the local institutional review board (Institutional Review Board UCSF, 16-18725). Subjects with T2DM were defined as subjects diagnosed with T2DM by a physician for more than 3 years that was either insulin requiring or treated with oral therapies such as sulfonylureas and metformin. Subjects without T2DM were defined as subjects without self-reported T2DM and without oral antidiabetic medication or insulin treatment.
Vascular and Laboratory Assessment
The ankle brachial index (ABI) was obtained to identify large vessel, peripheral arterial disease as a measure to assess vascular health. 21 The systolic blood pressure from both brachial arteries and from both the dorsalis pedis and posterior tibial arteries of each leg was measured using a standard blood pressure cuff and a handheld 8-mHz Doppler instrument (Summit Doppler L150, Wallach, Golden, CO, USA). To calculate the ABI for each leg, the higher pressure of the either the dorsalis pedis or posterior tibial artery was divided by the higher of the 2 brachial systolic measurements. The ABI was calculated for the left and the right leg, respectively and the lower ABI value was used for analysis. In addition, hemoglobin A1c (HbA1c) was obtained in all study subjects using the standard cutoff of <6.5% to define optimal long-term glycemic status. 22
Magnetic Resonance Imaging
MR images were acquired of the knee with the lower KL grade, or the right knee (in case of equal KL grades) using a 3T MRI scanner (Discovery MR 750w) and 16 channel Geometry Embracing Method (GEM) flex medium coil (Neocoil, Pewaukee, WI). A sagittal 3D multiecho UTE cones sequence 23 with 6 echo times (TEs 0.228 ms, 3.9 ms,7.6 ms, 12 ms, 17 ms, 24 ms; repetition time [TR] = 32 ms; field of view [FOV] = 14 × 14 × 9.2 cm3, resolution = 0.5 × 0.5 × 2 mm3, 18° flip angle, and fat suppression radiofrequency pulse applied every 5 TRs) was used to obtain cartilage UTE relaxation measurements.
Image Analysis
The distinct linear signal intensity of the deep calcified layer of articular cartilage, previously described by Bae et al., 13 was segmented manually on the first-echo images from UTE cones in the following five compartments: the patella (PAT), the medial and lateral femur (MF and LF) and the medial and lateral tibia (MT and LT); Figure 1 . The trochlea was not segmented due to flow-artifacts in this region caused by the popliteal artery. We aimed to segment as many slices as possible to cover the entire cartilage but used rigorous criteria to exclude sections with compromised image quality. Furthermore, sections with artifacts limiting the segmentation of the cartilage were excluded. UTE T2*maps were computed for each compartment by using a monoexponential decay model as fitting function for the signal intensity from the multiecho UTE images on a pixel-by-pixel basis using six echoes (TE = 0.228-24 ms), as shown in Figure 2 . A global UTE value was calculated using the mean of all compartments.
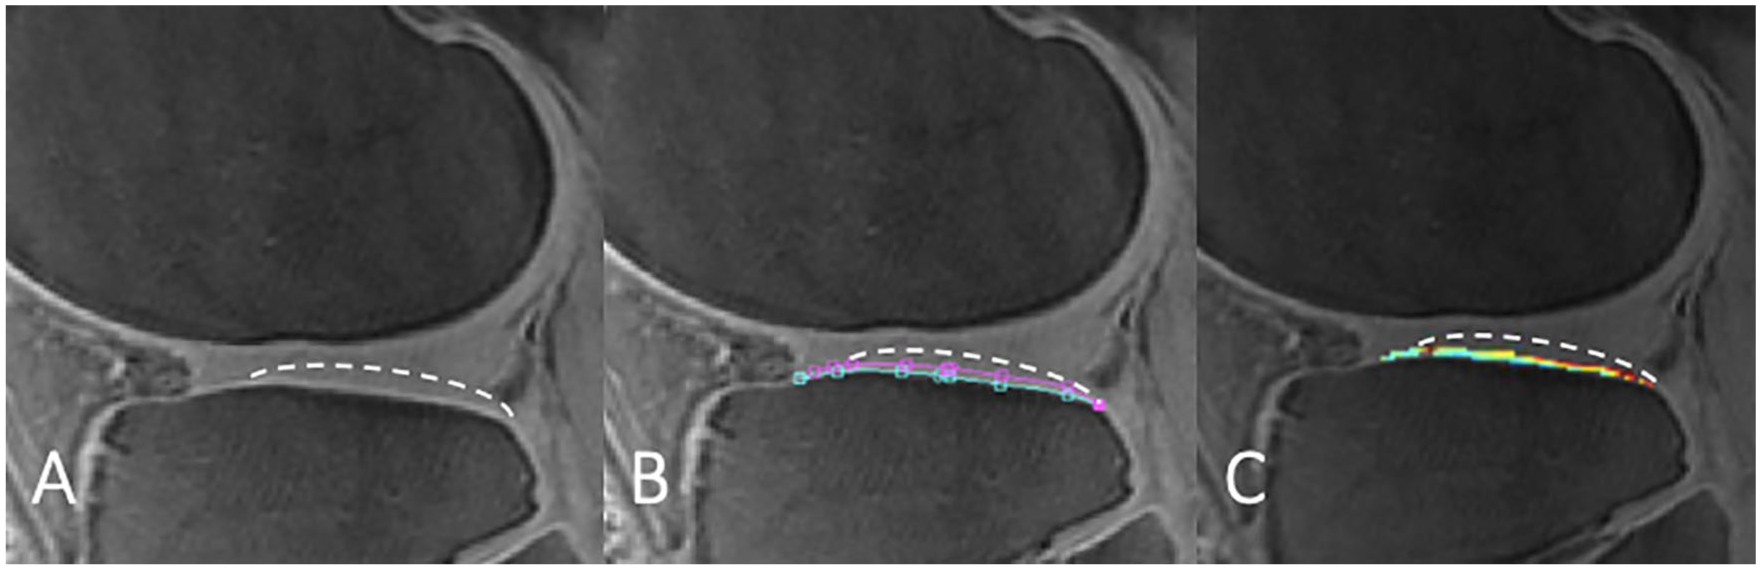
Example of ultrashort echo time–enhanced (UTE) T2* segmentation splines of the lateral tibia compartment, with white dashed line indicating the border of the articular cartilage. The distinct linear signal intensity above the subchondral bone of the deep calcified layer of articular cartilage (A), was manually segmented manually on the first echo (B). Finally, UTE T2* values were calculated on a pixel-by-pixel basis using a monoexponential decay model as fitting function for the signal intensity (C).
(
Reproducibility
To calculate scan-rescan reproducibility and inter- and intrareader reproducibility for UTE T2* mapping of the deep calcified cartilage layer, the reproducibility error was assessed by calculating the root mean square average of the single coefficients of variation (CV) on a percentage basis, as previously reported. 24 The scan-rescan reproducibility was assessed in 4 volunteers. Each volunteer underwent 2 MRI scans of the same knee in one session with at least 1 hour separating both scans. The multiecho UTE cones sequence obtained from the first and second MRI scans were segmented by the same reader (SCF) and scan-rescan reproducibility was assessed overall and for each of the 5 compartments segmented (PAT, MF, LF, MT, and LT). Inter-reader reproducibility was assessed in 4 volunteers between 2 readers (SCF and WA). For intrareader reproducibility, image segmentations for UTE T2* evaluation were repeated in the same 4 volunteers with at least 14 days separating the readings.
Statistical Analysis
The statistical analysis was performed with Stata software, version 14 (StataCorp, College Station, TX) using a 2-sided 0.05 level of significance. Differences in subject characteristics between those with and without T2DM were assessed using Pearson’s chi-square test for categorical data (gender, race) and independent-samples t tests for continuous variables (age, BMI).
Multivariable linear regression analyses adjusted for race were used to assess differences in UTE T2* relaxation times between cases and controls, and to analyze the association of UTE T2* relaxation time and HbA1c in all subjects. We also investigated the association of ABI values and UTE T2* relaxation times, adjusting for race and diabetic status, as diabetic status is a known confounder for vascular health. 25
Results
Study Subjects
The age range for our cohort of subjects with T2DM spanned 47 to 58 years (mean: 53.7 ± 4.3 years). The BMI range for subjects with T2DM spanned 24.5 to 34.9 kg/m2 (mean: 29.5 ± 3.6 kg/m2). The age range for our control cohort spanned 43 to 59 years (mean: 51.8 ± 6.1 years) and the BMI spanned 21.8 to 35.9 kg/m2 (mean: 28.9 ± 3.9 kg/m2). Age and BMI were not significantly different between both cohorts (P = 0.431 and P = 0.712, respectively). Moreover, the T2DM cohort and control cohort had similar distributions for sex (4 females, 6 males in the T2DM cohort; 3 females, 7 males in the control cohort; P = 1.000) and KL grades (P = 1.000). Significant differences were found for distribution of race (T2DM cohort: 2 Caucasian, 4 African American, 4 Asian subjects; control cohort: 8 Caucasian, 1 African American, 1 Asian subject; P = 0.048). Subjects characteristics are reported in Table 1 .
Subject Characteristics.
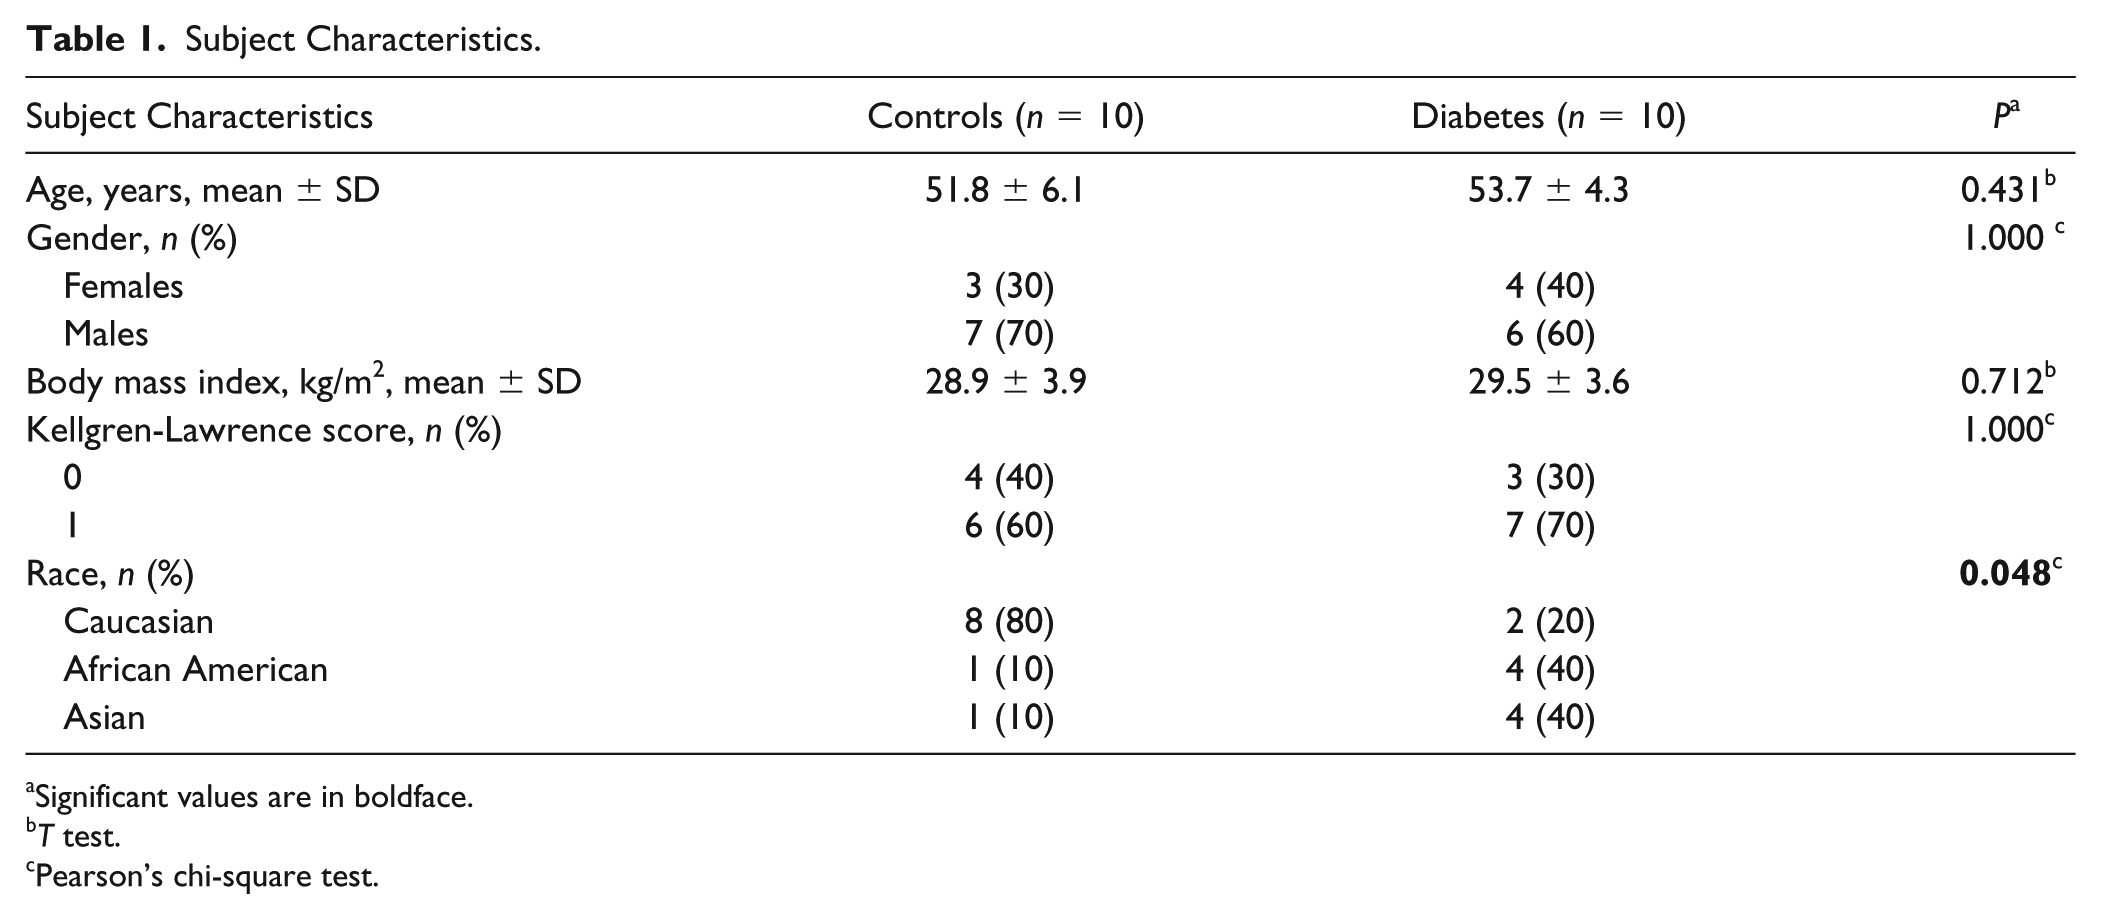
Significant values are in boldface.
T test.
Pearson’s chi-square test.
Diabetes and UTE T2* Measurements
Mean UTE T2* values in subjects with and without T2DM are demonstrated in Table 2 . Compared with nondiabetic controls, T2DM subjects had significantly lower mean UTE T2* values in the PAT (mean difference 4.87 ms; 95% confidence interval [CI] 1.09-8.65; P = 0.015), the LT (mean difference 2.26 ms; 95% CI 0.06-4.45; P = 0.045; Figure 3 ), and the LF (mean difference 4.96 ms; 95% CI 0.19-9.73; P = 0.043). Averaged over all compartments, the mean UTE T2* was significantly lower in those with T2DM compared with nondiabetic controls (mean difference 3.24 ms; 95% CI 0.36-6.12; P = 0.030).
Mean UTE T2* Values in Subjects with and without Diabetes.
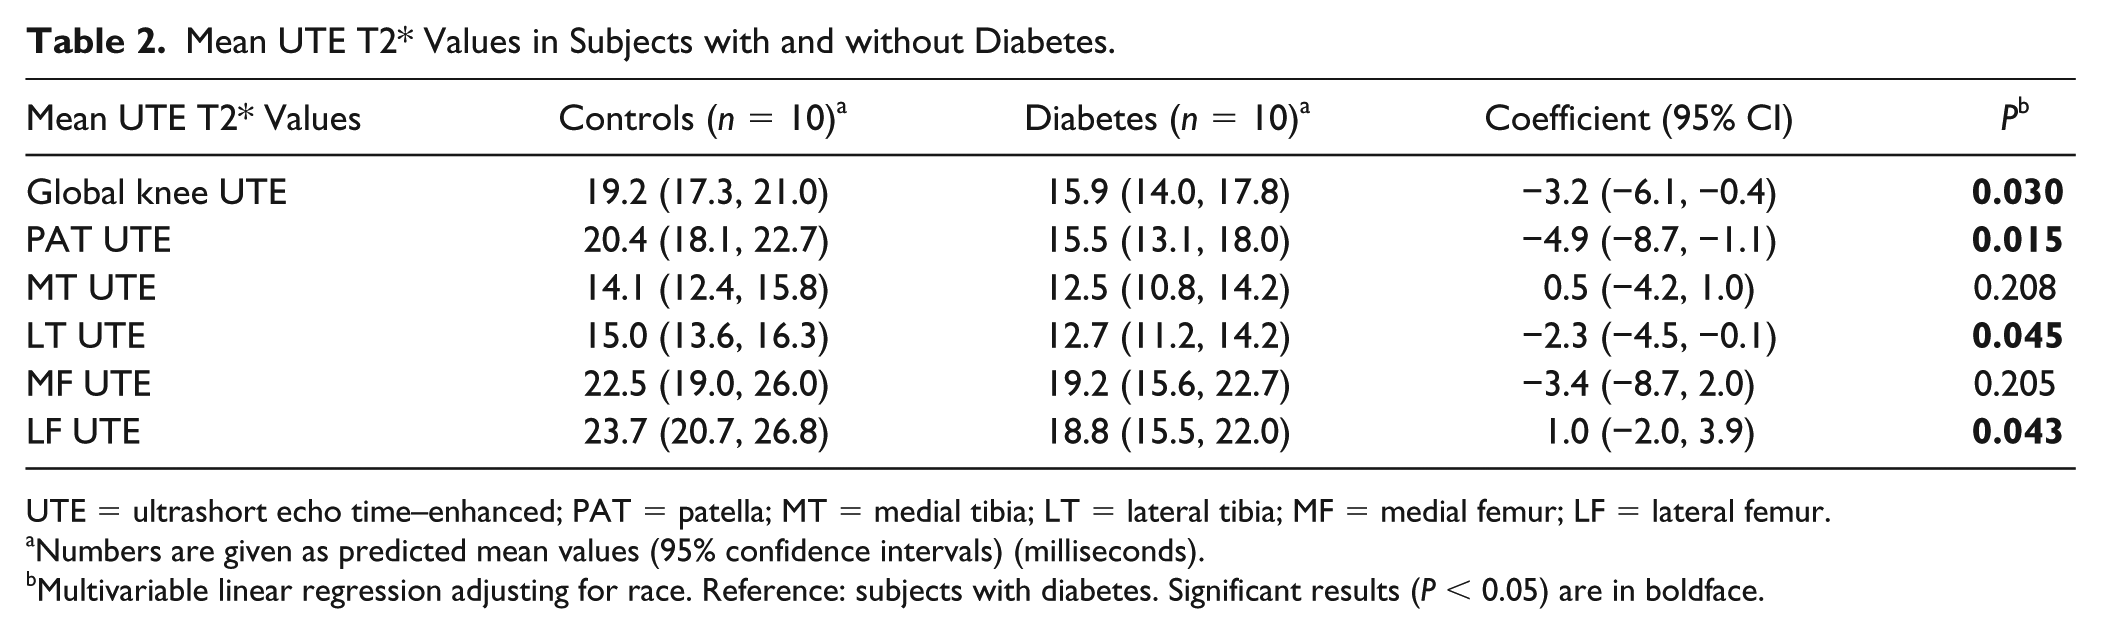
UTE = ultrashort echo time–enhanced; PAT = patella; MT = medial tibia; LT = lateral tibia; MF = medial femur; LF = lateral femur.
Numbers are given as predicted mean values (95% confidence intervals) (milliseconds).
Multivariable linear regression adjusting for race. Reference: subjects with diabetes. Significant results (P < 0.05) are in boldface.
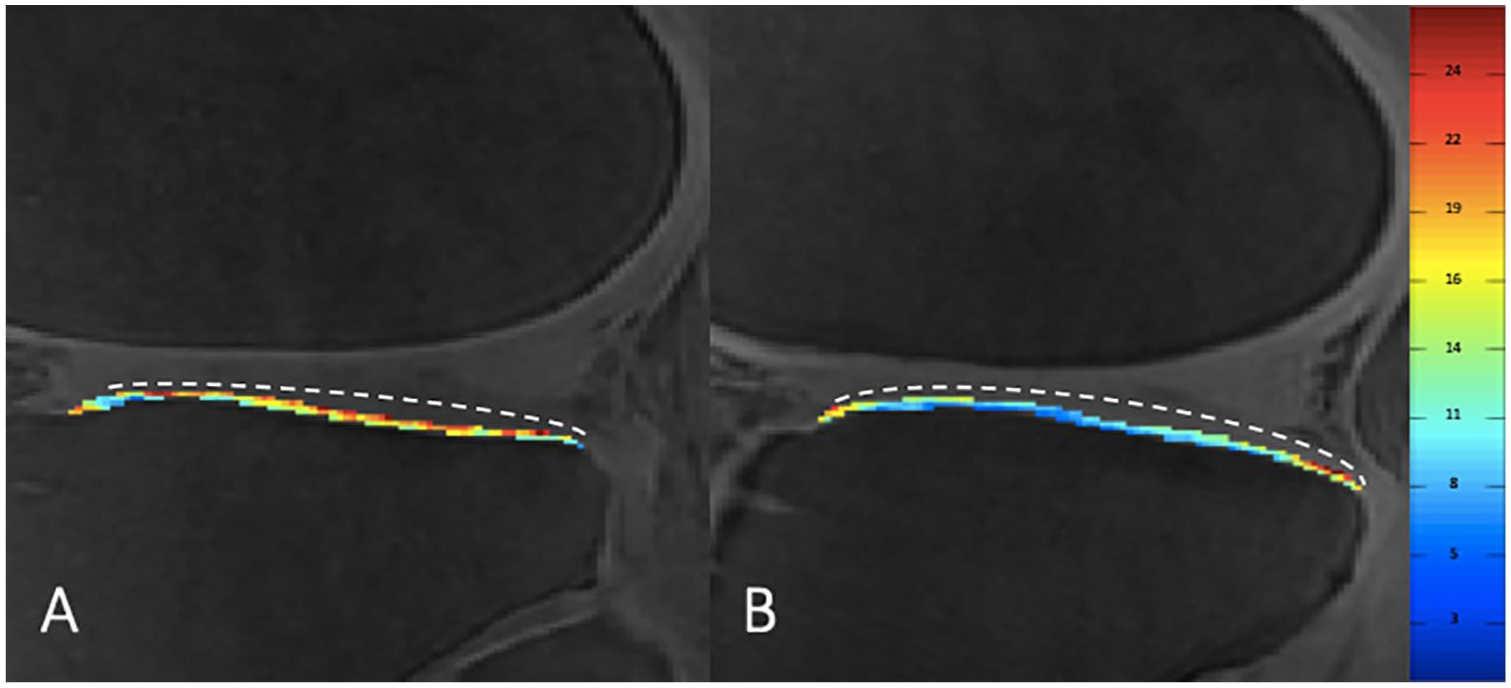
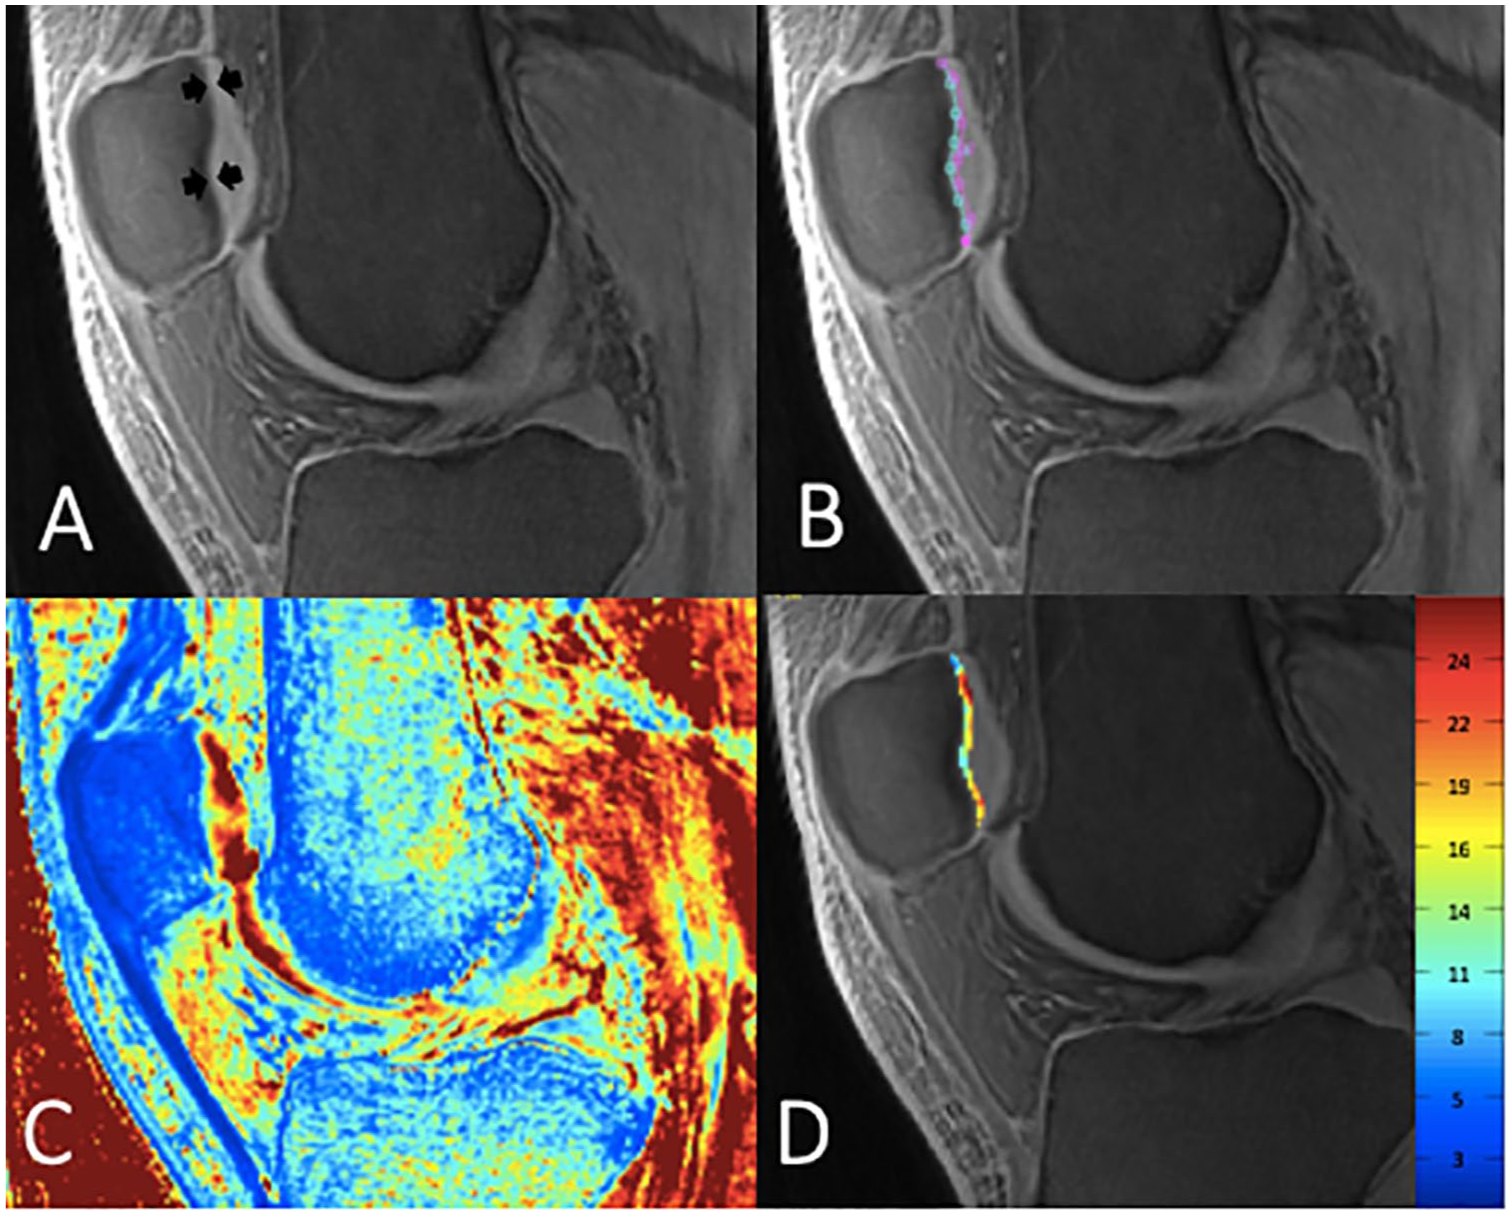
Sagittal ultrashort echo time–enhanced (UTE) T2* color map (values are in milliseconds) of the deep calcified cartilage layer of the lateral tibia of a nondiabetic control (
Mean UTE T2* values in subjects with optimal long-term glycemic status (HbA1c < 6.5%; n = 11) compared to subjects without optimal glycemic status (HbA1c ≥ 6.5%; n = 9) are shown in Table 3 . UTE T2* measurements of the deep cartilage layer of the PAT (mean difference 4.59 ms; 95% CI 0.75-8.42; P = 0.022), and the LT (mean difference 2.31 ms; 95% CI 0.16-4.46; P = 0.037) were significantly lower in subjects with elevated HbA1c ≥ 6.5% compared to those with HbA1c < 6.5%. Moreover, UTE T2* measurements averaged over all compartments were significantly lower in those with elevated HbA1c ≥ 6.5% compared to those with HbA1c < 6.5% (mean difference 3.11 ms; 95% CI 0.25-5.97; P = 0.035).
Mean UTE T2* Values in Subjects with Optimal Long-Term Glycemic Status (HbA1c < 6.5%).
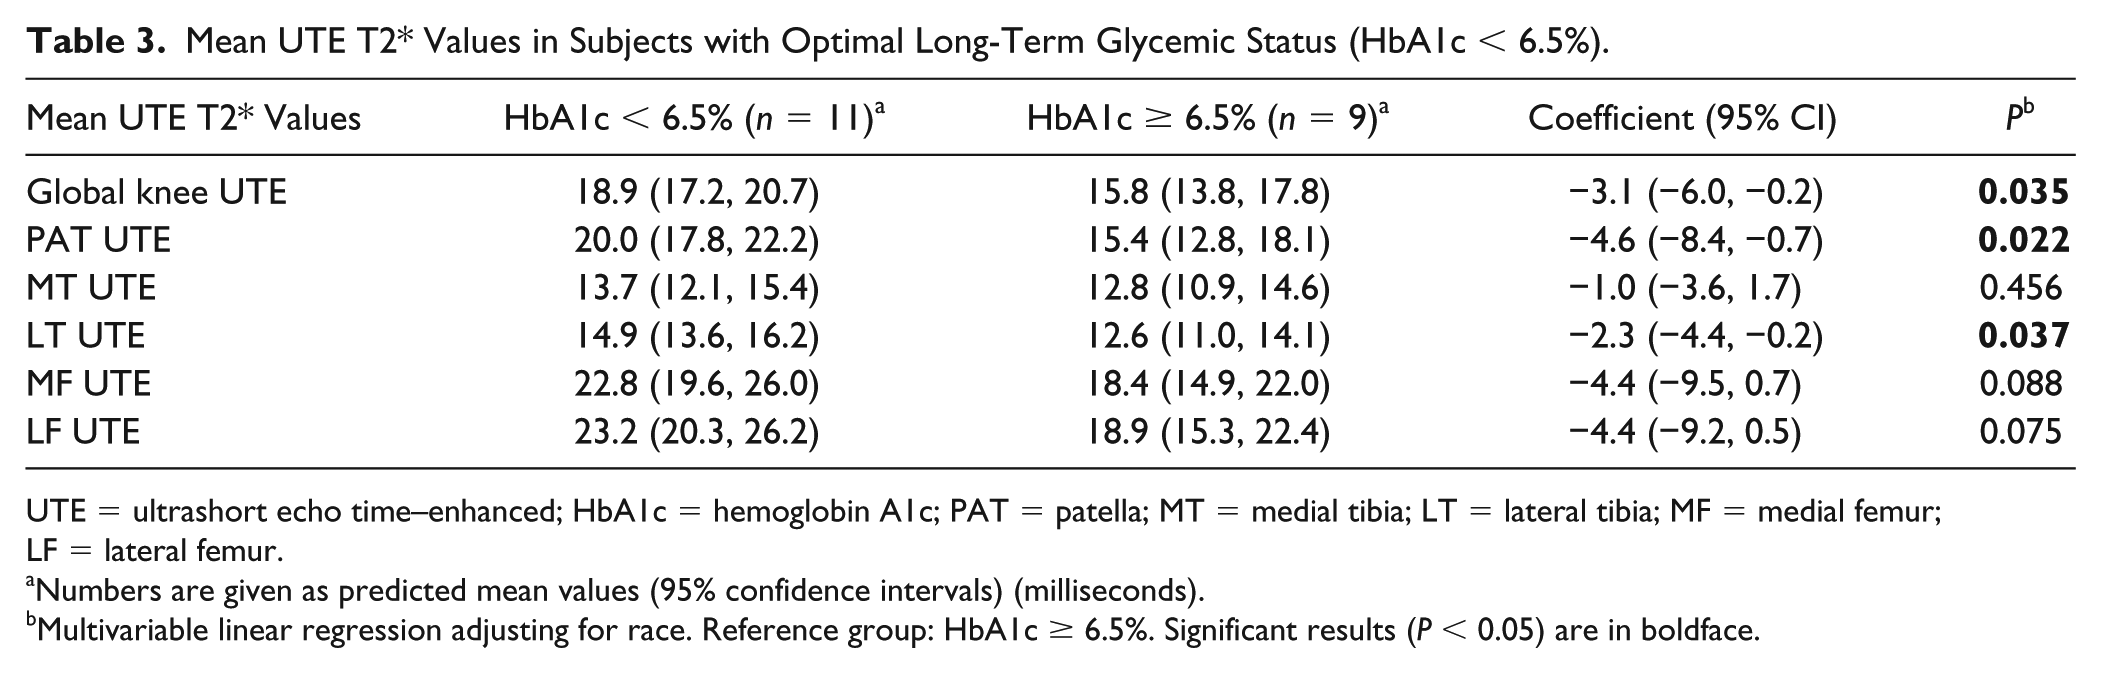
UTE = ultrashort echo time–enhanced; HbA1c = hemoglobin A1c; PAT = patella; MT = medial tibia; LT = lateral tibia; MF = medial femur; LF = lateral femur.
Numbers are given as predicted mean values (95% confidence intervals) (milliseconds).
Multivariable linear regression adjusting for race. Reference group: HbA1c ≥ 6.5%. Significant results (P < 0.05) are in boldface.
Vascular Health and UTE T2* Measurements
The mean ABI value in all our study subjects was 1.11 ± 0.15. Analyzing the association of ABI values and UTE T2* relaxation times, we found that subjects with higher ABI values, indicating better peripheral vascular health, had higher UTE T2* measurements of the PAT (coefficient 15.2; 95% CI 3.3-21.4; P = 0.017), the MT (coefficient 9.8; 95% CI 1.0-18.6; P = 0.031), and the LF (coefficient 18.8; 95% CI 3.3-34.3; P = 0.021) compared to subjects with lower ABI values, indicating impaired peripheral vascular health. Moreover, subjects with higher ABI values had higher UTE T2* measurements averaged over all compartments (coefficient 12.3; 95% CI 3.3-21.4; P = 0.011) compared to subject with lower ABI values. Results for the analyses are shown in Table 4 .
Association of Ankle Brachial Index and Mean UTE T2* Values.
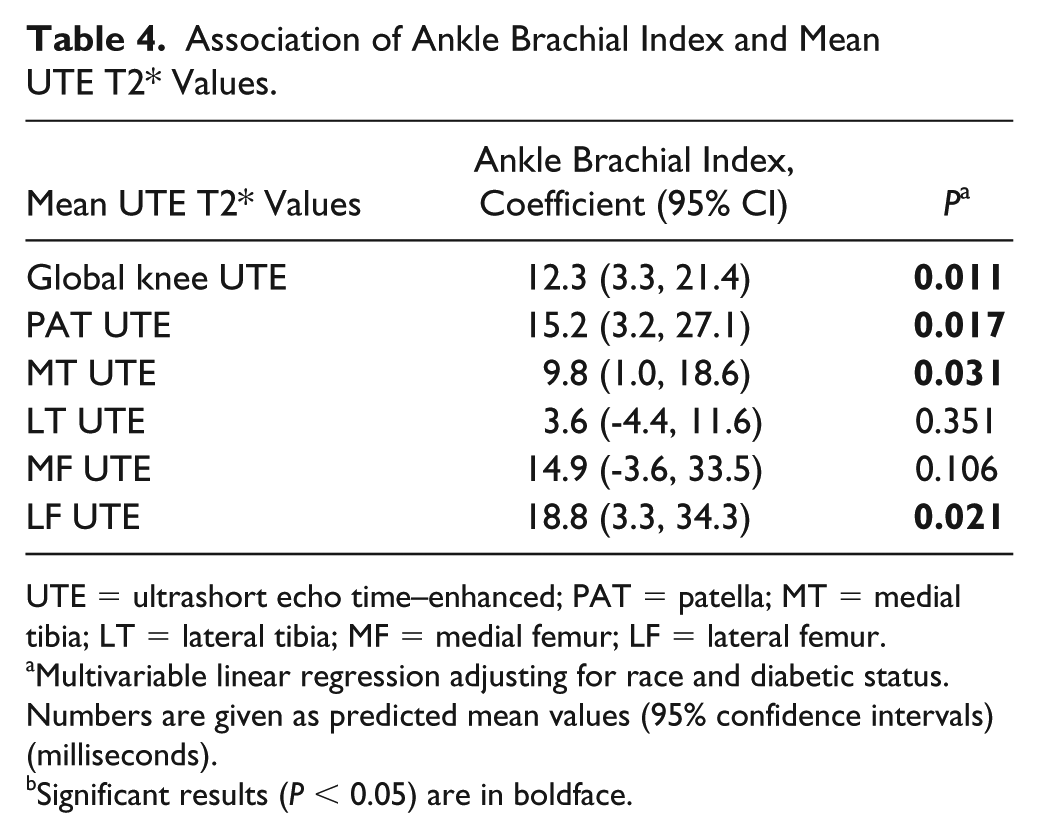
UTE = ultrashort echo time–enhanced; PAT = patella; MT = medial tibia; LT = lateral tibia; MF = medial femur; LF = lateral femur.
Multivariable linear regression adjusting for race and diabetic status. Numbers are given as predicted mean values (95% confidence intervals) (milliseconds).
Significant results (P < 0.05) are in boldface.
Reproducibility
Averaged over all compartments, the scan-rescan reproducibility for UTE cartilage T2* mapping was 0.36%. The CVs for each compartment were 5.64% for PAT, 4.00% for MF, 1.49% for LF, 5.19% for MT, and 4.50% for LT. The interreader reproducibility for image segmentation over all compartments for UTE T2* evaluation was 1.28% and calculated for each compartment interreader CVs were 0.97% for PAT, 2.68% for MF, 1.59% for LF, 2.91% for MT, and 1.77% for LT. The intra-reader reproducibility for image segmentation over all compartments for UTE T2* evaluation was 0.56% and for each compartment: 1.16% for PAT, 0.74% for MF, 0.79% for LF, 1.44% for MT, and 2.35% for LT.
Discussion
This pilot study demonstrated that T2*-UTE cartilage mapping is a useful technique to assess differences in cartilage composition of the deep calcified cartilage layer with high scan-rescan reliability and high inter- and intrareader reliability. UTE T2* measurements of the deep cartilage layer were consistently lower in subjects with T2DM compared with healthy controls, indicating increased mineralization of this layer. Independent of diabetic status, lower ABI values, reflecting peripheral arterial disease, were also significantly associated with lower UTE T2* measurements of the deep calcified cartilage layer.
Different pathophysiological pathways are considered to contribute to the acceleration of joint degeneration in subjects with T2DM. A unifying feature of all pathways is that elevated glucose levels cause local and systemic toxicity. 18 Rosa et al. 26 observed that degenerated OA chondrocytes lack the ability to downregulate their glucose transporter, leading to increased accumulation of glucose. This promotes production of reactive oxygen species, in turn leading to accelerated cartilage degeneration.27,28 In addition, the higher glucose levels may cause accumulation of advanced glycation end products, and increased systemic inflammation, further promoting cartilage degeneration.18,29-33
In comparison to nondiabetic controls, our study results showed that mean T2*-UTE values of the deep cartilage layer were consistently lower in subjects with T2DM, likely indicating increased mineralization of this layer. The biological mechanisms linking accelerated cartilage loss and increased mineralization of the deep cartilage layer are unclear. One hypothesis is based on the theory that increased mineralization of the deep subchondral cartilage layer represents a short-term functional adaptation to protect the hyaline cartilage but precipitates eventual cartilage loss in the long term. 16 Moreover, dystrophic calcifications also occur as a result of tissue damage due to injury. 34 Another hypothesis is based on the flow of nutrients and oxygen: as the articular cartilage has no direct blood supply and relies on perfusion from either the synovial fluid or subchondral vessels, increased mineralization of the deep cartilage layer may inhibit the supply of oxygen and nutrients from the subchondral bone to the cartilage plate, resulting in subsequent cartilage damage. 35 A study by Wang et al. 36 examined the effects of nutrition deprivation from either the subchondral bone or the synovial fluid on cartilage degeneration in rabbits. Interestingly rabbits with loss of nutrition from the synovial fluid had more severe cartilage damage after 8 weeks compared to rabbits with loss of nutrition from the subchondral bone, indicating that synovial fluid could to be the dominant nutrition source. 36 Another study by Guillen-Garcia et al., analyzing cartilage fragments used for autologous chondrocyte cultures, found that chondrocytes isolated from cartilage fragments still attached to the subchondral bone were more viable compared with chondrocytes from loose cartilage fragments not attached to the subchondral bone. 37 Therefore, likely both nutrition pathways are important for cartilage health.
In addition to impaired glucose tolerance, vascular pathologies are another component of the metabolic OA phenotype 18 and were previously found to be associated with knee OA, independent of obesity. 38 Lo et al. 39 found higher systolic blood and pulse pressure, a phenomenon attributed to arterial stiffness, aortic stiffness, and endothelial dysfunction was associated with radiographic knee OA. Hussain et al. 40 measured the caliber of retinal arterioles to assess microvascular health in patients with incident knee arthroplasties for knee OA and found that those with arthroplasties had a narrower arteriolar caliber compared to those without arthroplasties. Interestingly, we also found reduced ABI to be associated with increased mineralization of the deep cartilage layer, independent of diabetic status. While the ABI is not a direct measure of vascular pathology at the site of the joint, a low ABI generally reflects large vessel, peripheral arterial disease and is typically related to increased arterial calcifications. 35 Since we found increased mineralization of the deep cartilage layer in subjects with T2DM, a disease inherently linked to microvascular pathologies, 41 and increased mineralization in those with reduced peripheral large vessel vascular health, this suggests that the increased mineralization could be a consequence of micro- and macrovascular disease and potentially related to ischemic episodes in the subchondral bone.
We acknowledge that our study has limitations. As this is a pilot study, the number of study subjects was limited (n = 20), however, we found significant results even in this small cohort of study subjects. Moreover, since the deep cartilage layer consists of a relatively confined area of the cartilage, we specifically assessed how UTE T2* measurements compared in subjects who were scanned, repositioned and scanned again and evaluated inter- and intrareader reproducibility for the UTE T2* segmentations. As we had excellent scan-rescan, inter-, and intrareader reproducibility, arguably UTE T2* segmentations of the deep cartilage layer are a robust approach to assess compositional differences of the deep cartilage layer. Also, we had no histopathological correlation. Further studies involving histopathological analysis would be of interest. However, these study types are challenging in subjects with no or mild OA, since human specimens are typically acquired from subjects undergoing joint replacement surgery. It should be noted that previous studies found racial differences using T2 cartilage relaxation times to measure cartilage composition.42,43 While this association has not specifically been shown for T2*-UTE, it could have influenced our results, since the distribution of race was significantly different in the T2DM cohort compared with the control cohort. However, by adjusting all analyses for race, we aimed to minimize confounding caused by this factor.
Overall, our study shows that UTE cartilage T2* mapping can assess the biochemical composition of the deep subchondral cartilage layer with high scan-rescan reliability, and high inter- and intrareader reliability. Furthermore, this is the first study to demonstrate that the deep cartilage layer is more mineralized in subjects with T2DM and in subjects with impaired vascular health. This could be an important pathophysiological pathway contributing to accelerated cartilage loss, possibly by inhibiting the flow of oxygen and nutrients from the subchondral bone to the cartilage. Further large-scale, longitudinal studies are warranted to study the association between mineralization of the deep cartilage layer and longitudinal cartilage degeneration.
Footnotes
Acknowledgments and Funding
We would like to thank the participants and staff of the study for their invaluable assistance with patient selection, statistical analysis, and technical support. This research was supported by a Seed Grant from the UCSF Department of Radiology and Biomedical Imaging. We acknowledge funding through the Pilot & Feasibility grant mechanism from the Nutrition Obesity Research Center (NORC) at UCSF (NIH Award P30DK098722).
Declaration of Conflicting Interests
The author(s) declared no potential conflicts of interest with respect to the research, authorship, and/or publication of this article.
Ethical Approval
The study was compliant with the Health Insurance Portability and Accountability Act and approved by the local institutional review board.
Informed Consent
Written informed consent was obtained from all subjects before the study.
Trial Registration
Not applicable.