
Abstract
Objective
Autologous articular cartilage (AC) harvested for repair procedures of high weight bearing (HWB) regions of the femoral condyles is typically obtained from low weight bearing (LWB) regions, in part due to the lack of non-destructive techniques for cartilage composition assessment. Here, we demonstrate that infrared fiber optic spectroscopy can be used to non-destructively evaluate variations in compositional and mechanical properties of AC across LWB and HWB regions.
Design
AC plugs (N = 72) were harvested from the patellofemoral groove of juvenile bovine stifle joints, a LWB region, and femoral condyles, a HWB region. Near-infrared (NIR) and mid-infrared (MIR) fiber optic spectra were collected from plugs, and indentation tests were performed to determine the short-term and equilibrium moduli, followed by gravimetric water and biochemical analysis.
Results
LWB tissues had a significantly greater amount of water determined by NIR and gravimetric assay. The moduli generally increased in tissues from the patellofemoral groove to the condyles, with HWB condyle cartilage having significantly higher moduli. A greater amount of proteoglycan content was also found in HWB tissues, but no differences in collagen content. In addition, NIR-determined water correlated with short-term modulus and proteoglycan content (R = −0.40 and −0.31, respectively), and a multivariate model with NIR data was able to predict short-term modulus within 15% error.
Conclusions
The properties of tissues from LWB regions differ from HWB tissues and can be determined non-destructively by infrared fiber optic spectroscopy. Clinicians may be able to use this modality to assess AC prior to harvesting osteochondral grafts for focal defect repair.
Keywords
Introduction
Articular cartilage is a viscoelastic material that lines the tibia-femoral joint and has unique mechanical properties that enables it to resist compressive and shear forces. It is known that different regions of the knee cartilage are exposed to different magnitudes of force, depending on their anatomic location, and are either high weight bearing (HWB) or low weight bearing (LWB) ( Fig. 1 ). 1 Focal defects are usually located on the HWB femoral condyles and are typically caused by injuries during athletic events or trauma related cases. If defects are left untreated, then osteoarthritis (OA) is likely to develop, which ultimately can lead to the need for total knee arthroplasties.2,3 There are methods to help delay the onset of OA by repair of isolated defects, including osteochondral allograft transplantation surgery (OATS), 4 autologous chondrocyte implantation (ACI),5-8 matrix-induced autologous chondrocyte implantation (MACI), 9 and mosaicplasty, which utilizes autologous tissue.10,11 However, an optimal therapeutic protocol to prevent or treat OA, or repair cartilage defects, has not been established.
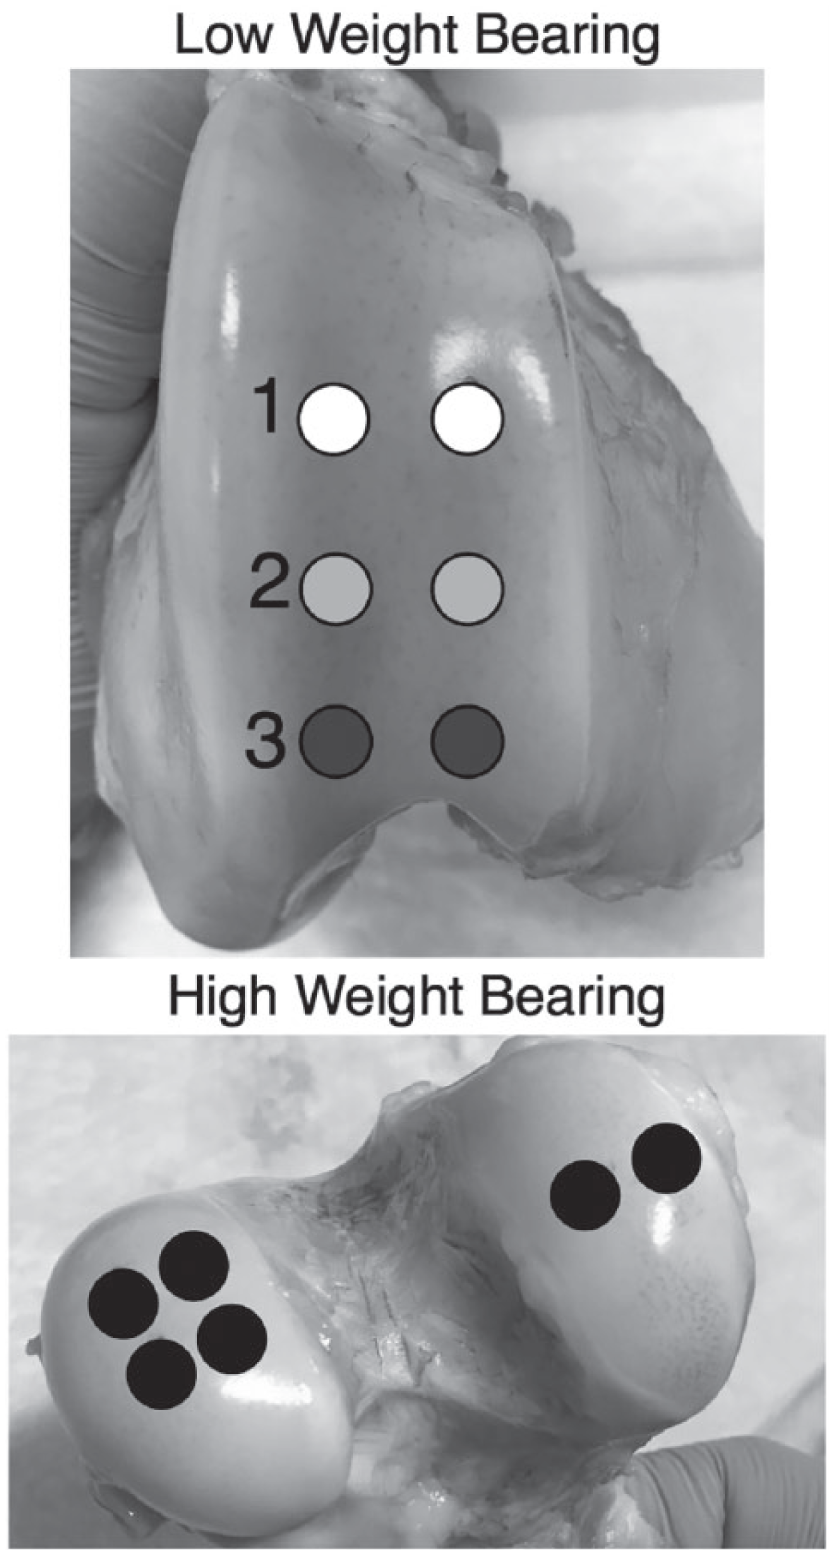
Cartilage from low weight bearing (LWB) regions were located on the patellofemoral groove and from high weight bearing (HWB) regions on the femoral condyles. Circles represent the 6 mm diameter of the biopsy punch that was used.
Osteochondral grafts, which are commonly used to repair defects, such as for mosaicplasty procedures, are chosen from LWB regions. Similarly, the cartilage harvested for use in ACI procedures is harvested from LWB regions. However, the differences between LWB and HWB cartilage mechanical and compositional properties, obtained from the same or different subjects, could impact graft integration and repair, and possibly cellular activity. Several recent studies had reported the need for reoperation after OATS, 12 ACI8,13 and MACI, 14 and mosaicplasty, 11 although it is not clear whether the failure of these procedures is linked to tissue property mismatch. Unfortunately, currently, there is no ideal method available to interrogate the compositional and mechanical properties of grafts prior to implantation or of cartilage prior to harvesting for ACI or MACI. Such knowledge of compositional and mechanical properties of cartilage prior to use in OATS or ACI/MACI could affect integration of the implanted allografts and development of the cultured chondrocytes within native tissue, although there is a paucity of studies that address these issues.
Infrared spectroscopic analysis via fiber optics is a powerful modality for non-destructive assessment of tissue composition, in both the mid-infrared (MIR) range and near-infrared (NIR) range.15-21 We have previously shown that MIR spectral data correlates to articular cartilage composition,22,23 and recent studies from our laboratory have also demonstrated that NIR fiber optic data obtained from engineered cartilage constructs correlate with mechanical properties, as well as collagen and proteoglycan (PG) content of the tissues.17,24,25 Other recent studies suggest that NIR spectroscopy may be used to predict mechanical properties of articular cartilage around lesions20,26 and in normal and osteoarthritic cartilage.19,21,27,28 In Afara et al., 19 NIR spectral data were shown to correlate to mechanical properties of articular cartilage from femoral condyles, patellofemoral grooves, and tibial plateaus. However, the variation in mechanical properties of tissues from different anatomical locations was not reported, and a comparison of tissues from HWB and LWB regions was not explicitly investigated.
Here, we hypothesize that infrared fiber optic spectral data will correlate with mechanical and compositional properties of native articular cartilage and can detect the variation between HWB and LWB cartilage. To investigate this hypothesis, indentation tests of articular cartilage in HWB and LWB regions of bovine knees were performed along with non-destructive spectroscopic assessments of composition using MIR and NIR fiber optic spectroscopy, and biochemical analyses. Development of an infrared fiber optic technique for non-destructive evaluation of osteochondral graft tissue composition, or for identification of regions of cartilage for ACI harvest, could enable selection of the optimal tissue for cartilage repair.
Methods
Tissues
Articular cartilage plugs were harvested from 6 bovine stifle joints from 3 different 2-week old animals (Research 87, Boylston, MA). The initial study design also included investigation of tissue from mature bovine stifle joints, but the cartilage in those joints was too thin for adequate harvest. HWB plugs (N = 36) were collected from the femoral condyles, and LWB plugs (N = 36) were collected from the patellofemoral groove. All tissues appeared macroscopically normal with no evidence of degeneration, as would be expected for 2-week old animals. Each of the 2 regions (HWB and LWB) of the knee were divided into 3 subregions, with 2 plugs investigated in each subregion, leading to 12 samples from each joint. For LWB, region 1 referred to the most proximal area of the groove, region 2 was the center of the groove, and region 3 was the most distal area of the groove. For HWB, region 1 was on the lateral condyle, and regions 2 and 3 were on the medial condyle ( Fig. 1 ). Six-millimeter biopsy punches (Integra Miltex, York, PA) were used to harvest the plugs after MIR spectral data collection. Each sample was stored in a centrifuge tube with phosphate buffered saline and protease inhibitor at −20°C. Data from the first 2 knees were excluded from analyses of mechanical properties as those samples underwent an additional freeze-thaw cycle prior to mechanical testing. However, the data from the first 2 knees were included for gravimetric water (assessed prior to freezing) and biochemical analyses, leaving 48 samples for mechanical testing, and 72 samples for spectroscopic, gravimetric water, and biochemical analyses. In addition, cartilage plugs (N = 6 HWB, N = 6 LWB region 1) were removed from 6 additional bovine stifle joints from another study and were used for NIR spectral evaluation and mechanical and biochemical assessment. MIR data were not available for those samples.
Mid-Infrared Spectroscopy Data Acquisition and Analysis
Prior to removal of the cartilage from the joint, MIR spectra were collected using an attenuated total reflection (ATR) probe (Art Photonics, Berlin, Germany) coupled with an IS5 spectrometer (Thermo Fisher Scientific, Inc, Waltham, MA). Background data were collected from air at a spectral resolution of 8 cm−1 and 64 co-added scans. A greater number of background scans are typically co-added to ensure any noise in the spectra arises from sample data collection. Data were collected from tissues across the spectral range of 650 to 4000 cm−1 at a spectral resolution of 8 cm−1 and 32 co-added scans, which took ~30 seconds per sample. A pressure sensor was used to maintain a constant pressure of 0.3 pounds on the cartilage, as pressure applied when using an ATR probe can affect the spectral signal. 29 Here, we assessed the optimal load to maintain constant tissue contact using additional sample points, prior to the data collection from the tissues included in the study. The load was optimized by observation of a lack of change in amplitude of spectral absorbances over a 2 minute period of data collection. Clinically, the pressure sensor can also be used to guide the surgeon during data collection. Spectral data were imported into The Unscrambler X software (CAMO Software AS, Oslo, Norway) for processing. Average MIR spectra are shown with 5 points of smoothing ( Fig. 2A ), and raw spectra were preprocessed by a Savitzky-Golay second derivative filter with 15 points of smoothing. The second derivative spectra were averaged and inverted to convert to positive peaks ( Fig. 2B ). As second derivative peaks are negative, inverting the peaks aided in understanding the nature of the correlations but was not mathematically necessary. Second derivative peak heights were assessed for amide I (total protein) (1635 cm−1), collagen (1336 cm−1), and PG (1032 cm−1), where the inverted heights correlate to the concentration of each compound in the samples.15,16
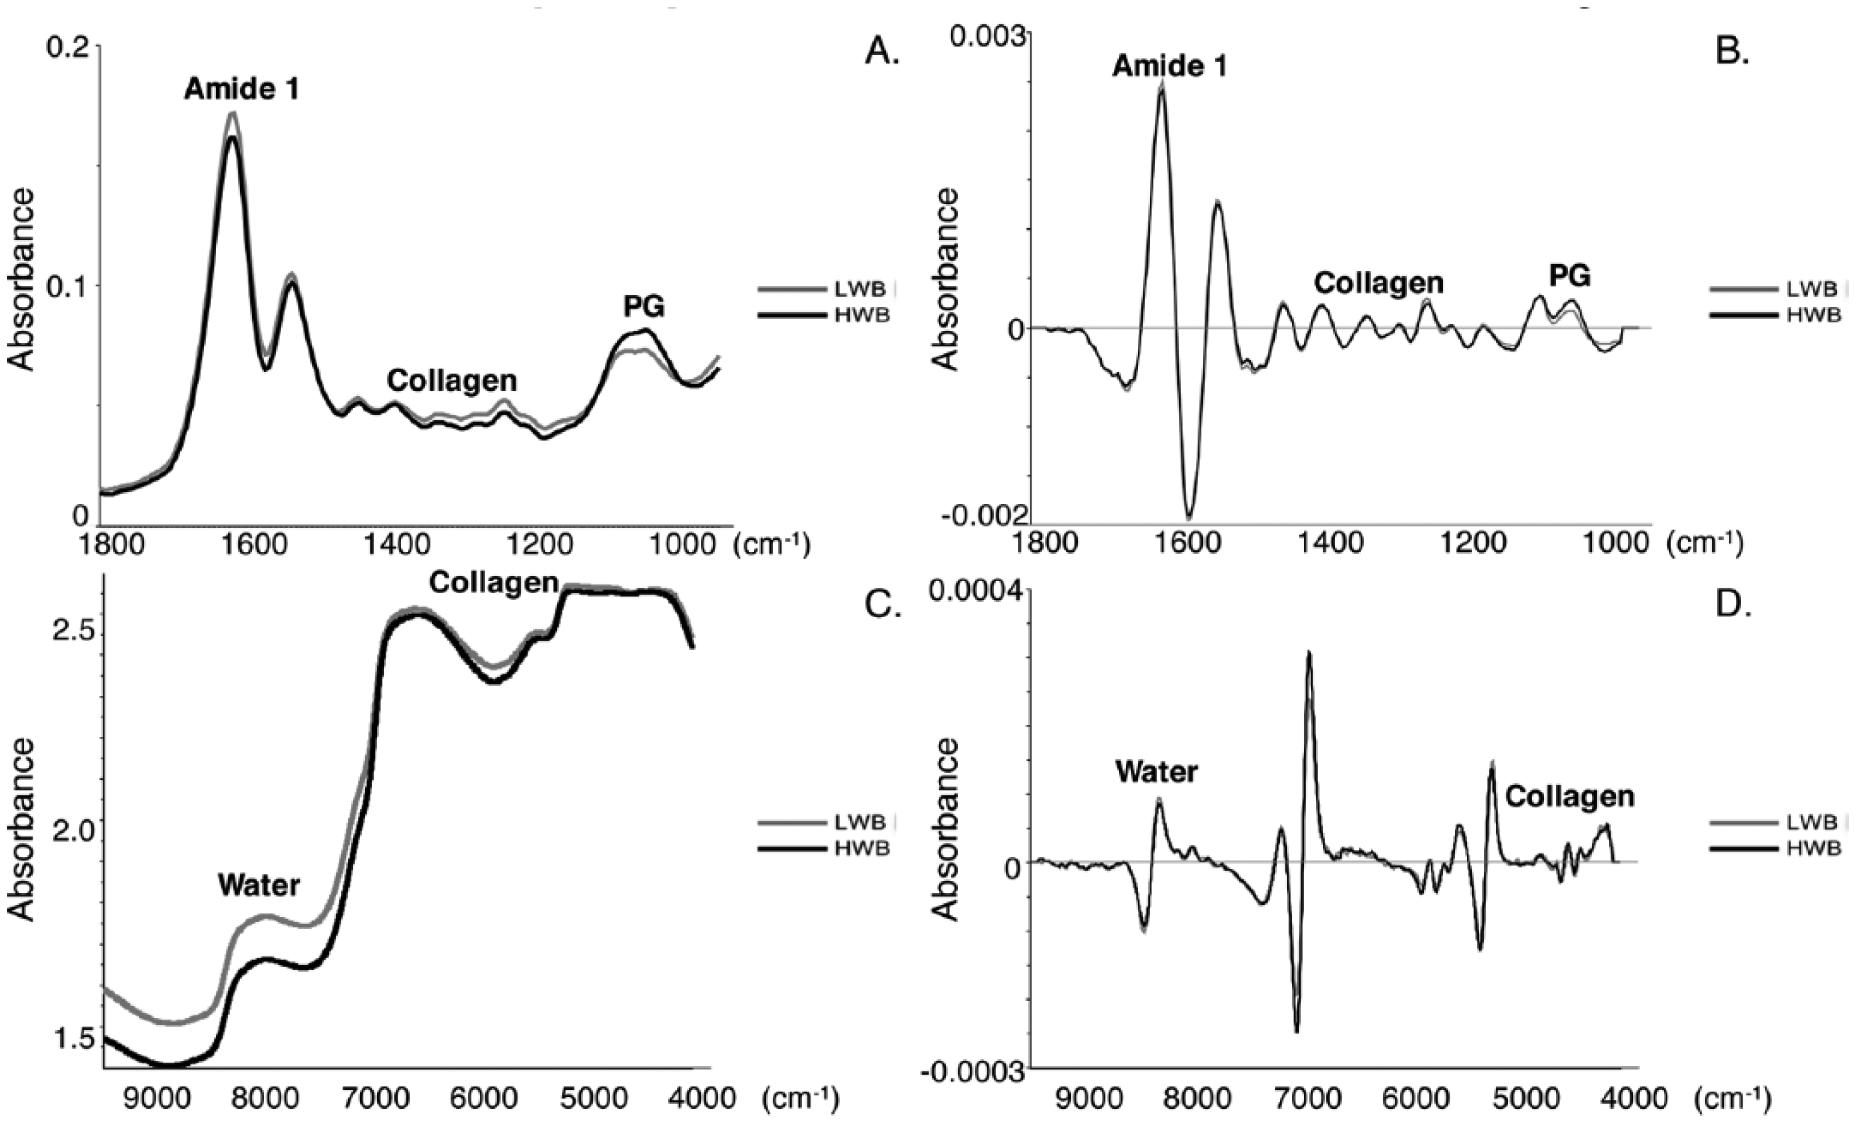
Peaks of interest are labeled, with amide I corresponding to total protein. (
Near-Infrared Spectroscopy Data Acquisition and Analysis
After thawing the tissues, NIR spectra were collected with a fiber optic reflectance probe with a 6 mm fiber bundle diameter (Remspec Corp, Charlton, MA) coupled to a Bruker Matrix spectrometer (Bruker, Billerica, MA). Background data were collected in reflectance from a standard flat (plane) mirror made of float glass at a spectral resolution of 16 cm−1 and 256 co-added scans. The plugs were dried of excess surface water with a Kimwipe, placed on the mirror, and spectra were collected using 128 co-added scans across the spectral range of 4000 to 10000 cm−1 at a spectral resolution of 16 cm−1. The probe was maintained at 1 mm above the mirror for background data collections, and at 1 mm above the samples for tissue data collection with a clamp. Data acquisition took ~2 minutes per sample. The distance of the probe from the samples for data collection was optimized prior to the study based on maximization of energy back to the detector. Spectral data were imported into the Unscrambler X software for processing. Average NIR spectra are shown with 15 points of smoothing ( Fig. 2C ), and raw spectra were preprocessed by a Savitzky-Golay second derivative filter with 43 points of smoothing. The second derivative spectra were averaged and inverted ( Fig. 2D ) to facilitate understanding of peak contributions. Peak heights of NIR second derivative spectra were assessed for water (8680 cm−1) 30 and collagen (4610 cm−1). 24 Although NIR spectra have many overlapping spectral bands and molecular contributions are distributed across the whole spectrum, certain peaks, including the collagen and water peaks, may be used for univariate analysis where there is minimal or no overlap with other components.
Mechanical Testing Data Acquisition and Analysis
Immediately following NIR data acquisition, indentation tests were performed using a Bose Electroforce 3230 (Bose, Framingham, MA) equipped with a 1 mm diameter nonporous spherical indenter and a 1000 g load cell to obtain the short-term and equilibrium elastic Young’s moduli. Indentation tests have been widely used in several studies where the desired biomechanical outcomes were similar to the current study.1,21,31-33 Prior to acquiring test data of the samples included in the current study, a protocol dependent on the displacement of the indenter was optimized for additional LWB and HWB samples based on the limitations of the load cell range, and such that the large variation in LWB and HWB samples could be accurately determined. Ramp and hold tests were performed, where each ramp indented 0.25 mm at a rate of 0.1 mm/s and was held for 10 seconds. The short-term and equilibrium moduli were calculated from force relaxation data during the hold time using the following formula: 34
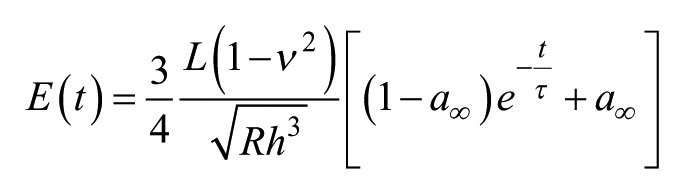
where E(t) represents the viscoelastic Young’s modulus, ν is the Poisson’s ratio (assumed to be 0.49), L is force at t = 0, R is the radius of the indenter, and h is the indentation depth. a∞ is the ratio of the equilibrium (t = ∞) to short-term (t = 0) moduli and τ is the relaxation time constant. The parameters L, a∞, and τ were calculated for each test by minimizing the sum of squared error between the corresponding test and model data using Microsoft Excel Solver. It was verified that one time constant was sufficient to model the experimental data with high fidelity (R2 > 0.9).
Compositional Data Acquisition and Analysis
Wet weights were obtained from the samples after mechanical testing, and samples were lyophilized for 24 hours to remove water from the tissues. Dry weights were then obtained, and gravimetric water percentages were calculated as:

Samples were then digested for 24 hours with proteinase K (Sigma Aldrich, St. Louis, MO). A colorimetric sulfated glycosaminoglycan (SGAG) assay for PG content 35 and hydroxyproline assay for collagen content 36 were performed. The absorbance at 525 nm and 550 nm is proportional to the concentration of chondroitin sulfate (SGAG) and hydroxyproline (collagen) in each sample respectively. SGAG directly relates to the amount of PG in a sample, while hydroxyproline is multiplied by a factor of 7.6 to determine the amount of collagen. 36 Biochemical data were processed in a custom Microsoft Excel file in order to determine percent PG/wet weight and collagen/wet weight.
Infrared Imaging Spectroscopy Data Acquisition and Analysis
Infrared spectral images were acquired to investigate the distribution of collagen and PG in the cartilage samples. Samples were fixed in 10% formalin for 24 hours and then preprocessed in washes of ethanol, xylene, and paraffin. They were then paraffin embedded and sectioned to 5 µm thickness. Sections were then placed on low-e microscope slides (Kevley Technologies, Chesterland, OH) and deparaffinized. Spectral images were collected at a spectral resolution of 8 cm−1 and a spatial resolution of 50 µm with 2 co-added scans, using a Spotlight 400 imaging spectrometer (Perkin Elmer, Chelton, CT). Polarized spectral images were then collected at 0 degrees by inserting an Infrared Polarizer K (Perkin Elmer, Beaconsfield, UK) into the beam path using the same imaging parameters to assess collagen orientation. Spectroscopic images were imported into ISys 5.0 (Malvern Instruments, Malvern, UK) to be processed. The image was preprocessed by removing the background and taking the second derivative with 29 points of smoothing. Collagen orientation was determined by taking the ratio of the amide I and amide II (centered at 1650 and 1540 cm−1, respectively) peak integration, as in a previous study. 37
Histological Analysis
Samples were processed as above for imaging spectroscopy, and paraffin embedded and sectioned to 5 µm thickness. Sections were then placed on Superfrost Plus microscope slides (Fisher Scientific, Waltham, MA) and deparaffinized. Safranin O staining was performed following a standard protocol 38 in order to compare the PG distribution across the depth of articular cartilage. Histology sections were digitized using an Olympus BX53 microscope (Olympus, Tokyo, Japan). Olympus cellSens software (Olympus, Tokyo, Japan) was used with image parameters of 10× zoom and 800 µs exposure.
Statistics
Outlier data from each data set were determined using Tukey’s approach, a standard test used for assessment of outliers in biomedical data sets. 39 A total of 1 sample from the hydroxyproline assay, 5 samples from the SGAG assay, 4 samples from gravimetric water content, 3 samples from NIR spectra, and 2 samples from equilibrium modulus data were removed. Sample normality was tested with a Shapiro-Wilk W-test in JMP Pro 12 (Cary, NC), with a significance level set at P < 0.05. Student’s t-tests were performed in Microsoft Excel to determine statistical significance between LWB and HWB parameters and between moduli from HWB tissues from different animals, with significance set at P < 0.05. A one-way analysis of variance (ANOVA) followed by a Tukey’s HSD (honestly significant difference) post-hoc test was performed in JMP Pro 12 to determine statistical significance among the moduli from the LWB and HWB regions with statistical significance at P < 0.05. Correlations were assessed between spectral data and compositional and mechanical data using a Pearson correlation with significance set at P < 0.05. For mechanical data, only short-term modulus was investigated for correlations, as this parameter had greater regional variation compared with the equilibrium modulus.
Partial Least Squares Model to Predict Mechanical Properties
A partial least squares (PLS) multivariate model was developed to predict the short-term moduli from the NIR spectra. NIR spectra from 58 samples (excludes the data from the two knees that underwent additional freeze-thaw cycles) were analyzed using the Unscrambler X. Spectra were preprocessed with an extended multiplicative scatter correction (EMSC) and 31 points of smoothing. 40 Preprocessed NIR spectra were used to calculate a PLS model in the 4000 to 10000 cm−1 range (optimized based on investigation of several spectral ranges) using leave-one-out cross-validation. 41 Mechanical information obtained from samples were used as the reference content in the PLS model. The PLS analysis approach finds linear combinations of the predictors (factors) to predict the response values. 41 The number of factors for each model was determined by examining loading weights and comparison of the root mean square error of calibration (RMSEC) and cross validation (RMSECV). The quality of the model was evaluated based on the RMSEC or RMSECV (as a percentage of the range of data), and the R2 of actual versus predicted values.
Results
Mid-Infrared ATR Spectroscopy
Based on the PG absorbance (1032 cm−1) in the MIR spectra, the HWB regions had significantly higher PG content compared with the LWB regions (P < 0.0001). No significant differences were found in MIR-determined collagen, based on the 1336 cm−1 absorbance, or in the MIR-determined total protein, based on the 1635 cm−1 amide I peak.
Near-Infrared Spectroscopy
No significant differences were found in NIR-determined collagen, based on the 4610 cm−1 absorbances. There was a significantly greater amount of water based on the NIR absorbance at 8680 cm−1 in LWB compared to HWB regions (P < 0.05).
Mechanical Data
The short-term modulus values of the HWB regions were generally higher compared with LWB regions. No differences were found among the 3 HWB regions (data not shown), while the moduli of the LWB regions tended to increase from regions 1 to 3, but this trend did not reach significance. However, region 1 and region 2 of LWB tissues had significantly lower short-term moduli compared with the moduli from HWB regions (P < 0.05) ( Fig. 3A ). Significant differences were also seen in the short-term moduli values of HWB cartilage from different sets of knees, demonstrating variation in properties across subjects (P < 0.05) ( Fig. 3B ). Both the short-term and equilibrium moduli of the HWB regions were greater compared with the short-term and equilibrium moduli of the LWB regions, respectively (P < 0.05) ( Fig. 3C ). There were no significant differences in equilibrium moduli across the 3 LWB regions.
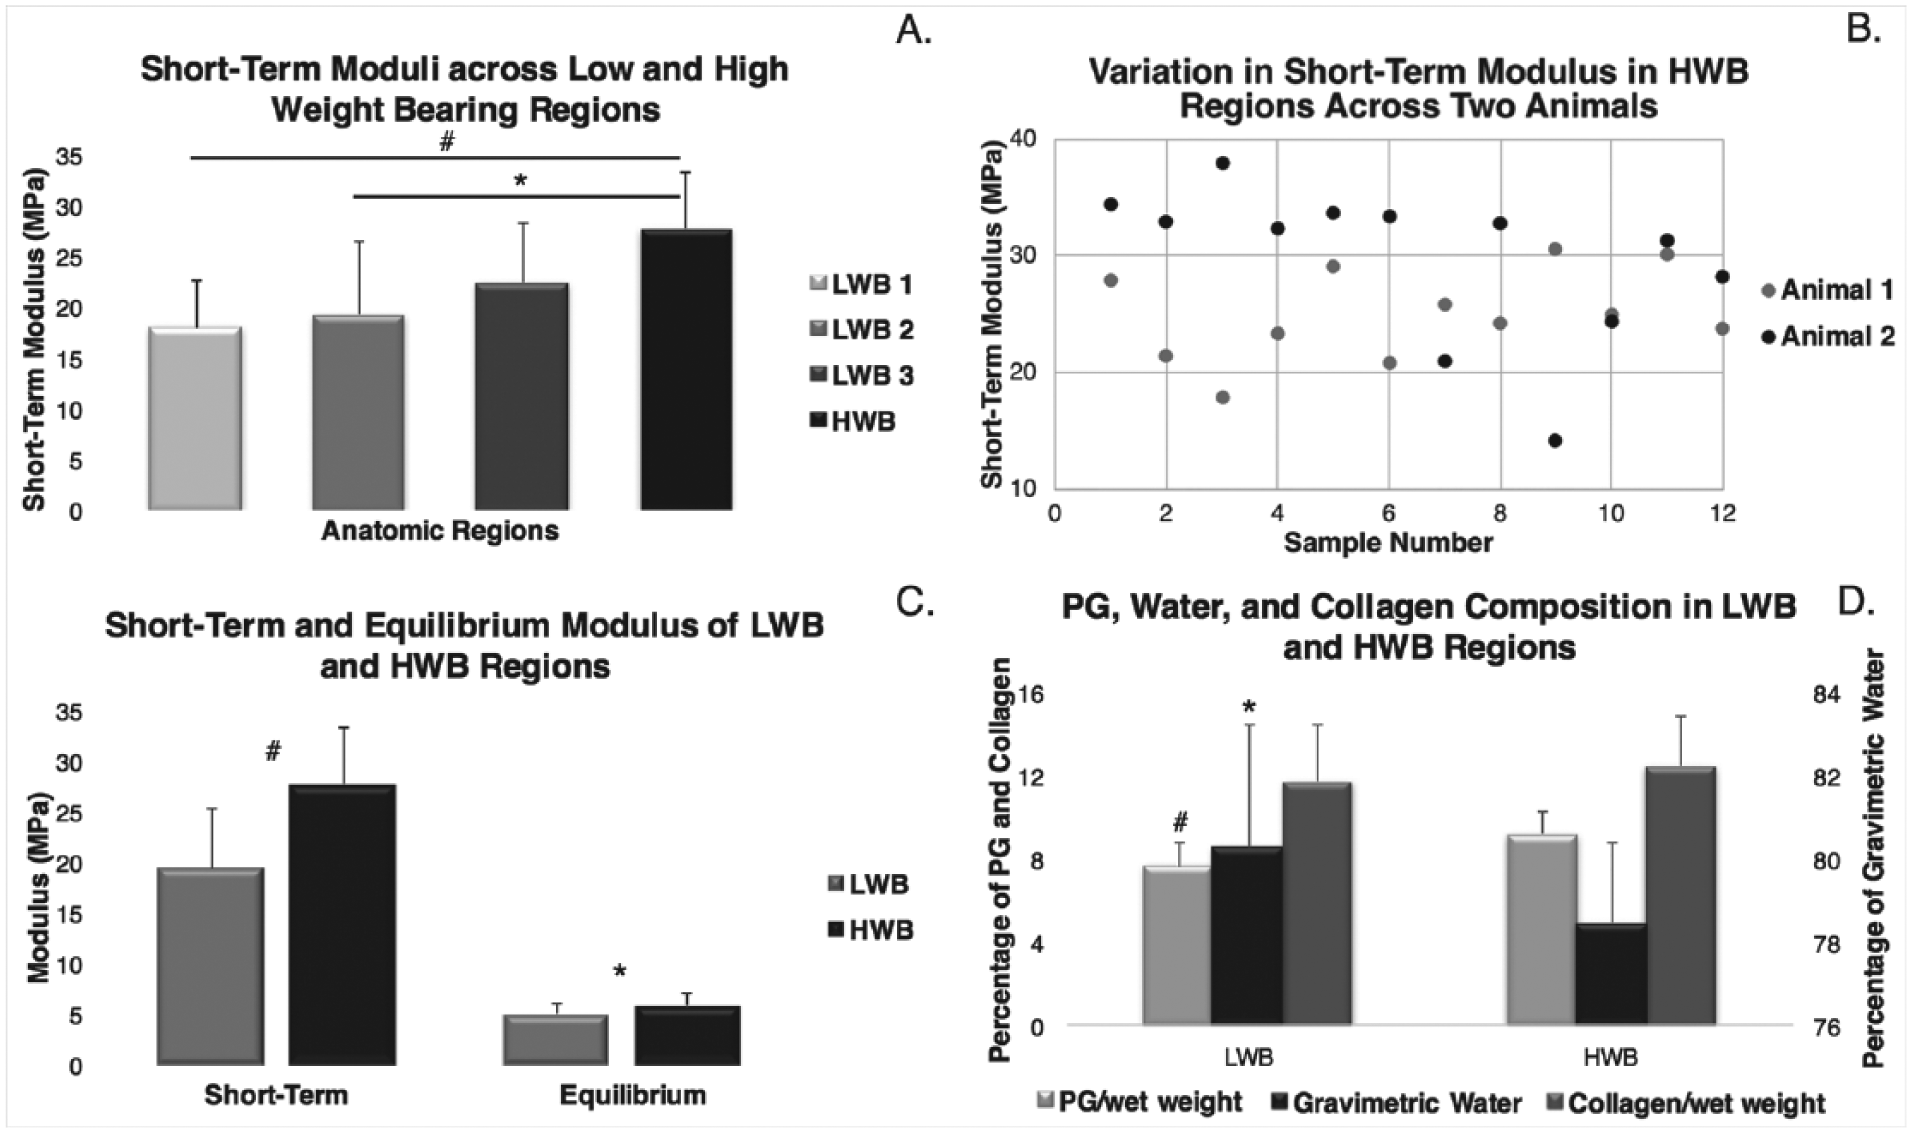
Material and compositional properties: (A) A general trend of increasing modulus was observed in the plugs from the patellofemoral groove toward the condyles. Color coding and location name correspond to Figure 1 (#P = 0.0001, *P < 0.05). (B) Tissues from animal 2 generally have a higher modulus compared with those from animal 1 (P < 0.05). (C) High weight bearing (HWB) tissues showed a significantly higher short-term and equilibrium modulus compared with low weight bearing (LWB) tissues (#P < 0.0001, *P < 0.05). (D) Proteoglycan (PG) content was greater in HWB tissues compared with LWB tissues, gravimetric water content was greater in LWB tissues compared with HWB tissues, and no significant differences were observed in collagen content between the 2 regions (*P < 0.0001 for PG/wet weight, #P < 0.05 for gravimetric water).
Compositional Analysis
Significantly greater amounts of PG/wet weight were found in HWB regions compared to LWB regions (P < 0.0001) ( Fig. 3D ). No significant difference in collagen content was found among all regions. Gravimetric water content was found to be significantly higher in LWB regions than in HWB regions (P < 0.05).
Infrared Imaging Spectroscopy
The distribution of total protein, PG, and collagen can be observed in the spectral images ( Fig. 4 ). Generally, the PG content distribution was similar to that in the Safranin O stained tissues. The collagen distribution appeared to vary across different regions; however, all samples appear to have more collagen just beneath the superficial zone and into the middle zone, compared with the deep zone. Collagen fibers throughout the entire sample were found to be predominantly parallel to the surface of the cartilage, which differs from the collagen orientation in adult bovine articular cartilage, as previously found in another infrared spectral imaging study. 42
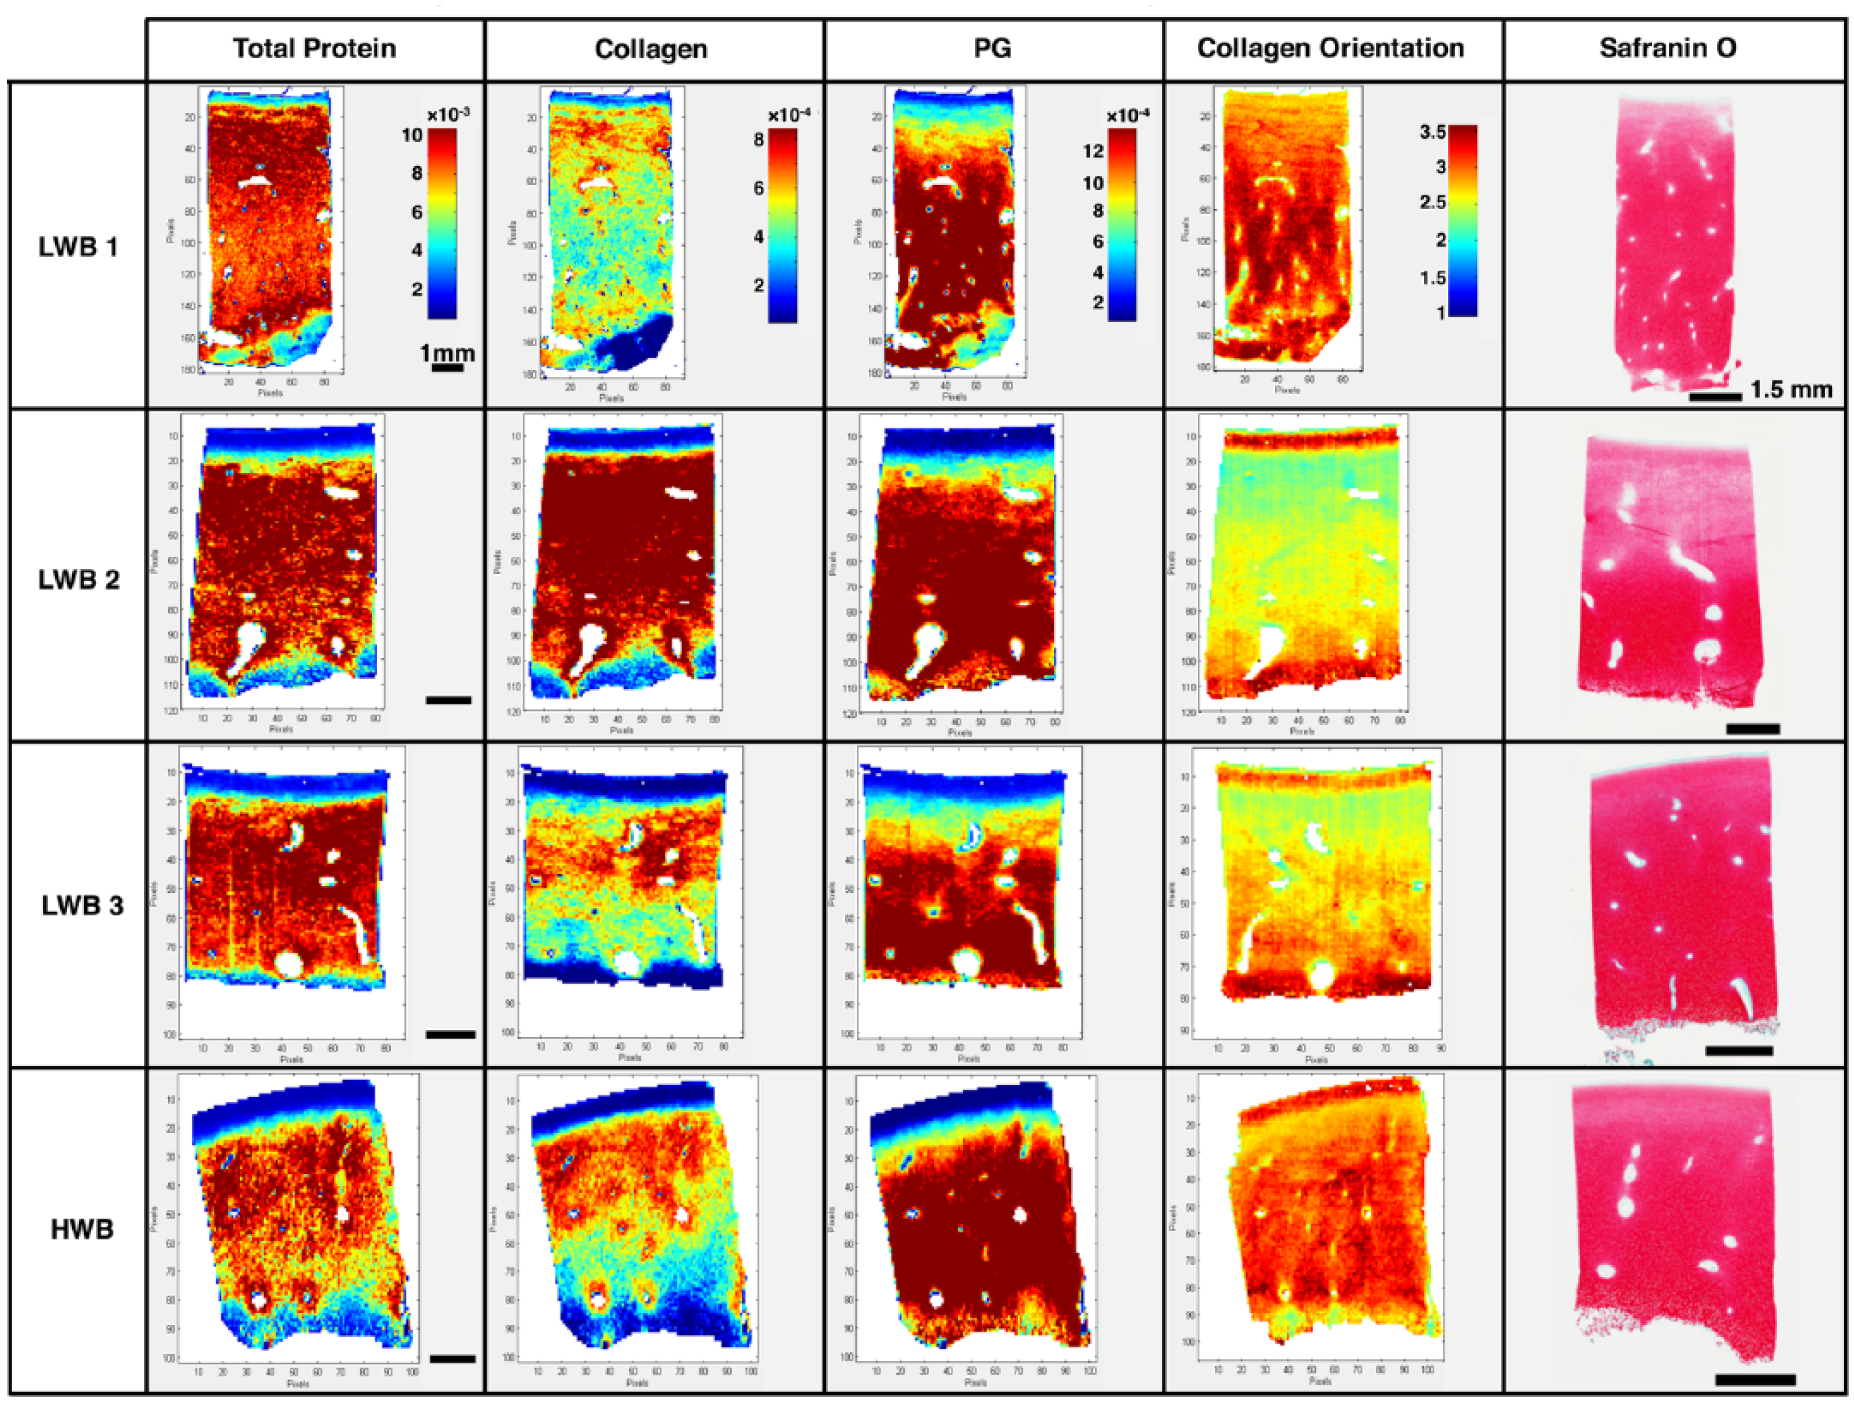
No observable pattern was apparent in the overall distribution of protein and proteoglycan (PG) among tissues from different anatomic regions (data from one section from one plug from each region presented here). A zonal distribution of collagen and PG was present for all tissues, and collagen orientation showed an overall tendency for fibrils parallel to the surface. For total protein, collagen, and PG images, the heat map scale is representative of the relative amount of the protein. For collagen orientation, values from 1 to 1.7 represent collagen fibrils orientated perpendicular to the surface, from 1.7 to 2.7 represents random orientations of fibrils, and from 2.7 to 3.5 represent fibrils oriented parallel to the surface. Scale bars for spectral images are 1 mm, and scale bars for histological images are 1.5 mm. Safranin O images were individually adjusted to optimize brightness and contrast.
Histology
Safranin O is a cationic dye known to bind with the positive SGAGs in cartilage. 43 Staining presented the cartilage as having a higher concentration of PG toward the deep zone, which is in accordance with previous studies ( Fig. 4 ).44,45
Correlations and PLS Model
Correlations are presented in Table 1. Significant correlations to the short-term modulus were found with: NIR-determined water peak height, gravimetric water content, biochemically determined percentage of PG/wet weight, and biochemically determined percentage of collagen/wet weight. The percentage of PG/wet weight significantly correlated to the gravimetric water content. The NIR-determined water peak intensity also significantly correlated to the equilibrium modulus, percentage of PG/wet weight, and gravimetric water content. MIR-determined PG significantly correlated to biochemically determined percentage of PG/wet weight. Further, the NIR spectra PLS model predicted the short-term moduli of articular cartilage with relative errors of calibration and validation of 11% and 15% and R2 values of 0.80 and 0.66, respectively. The PLS model used 7 factors, which was optimized based on the explained Y-variance.
Correlations Between Spectral, Mechanical, and Biochemical Data.
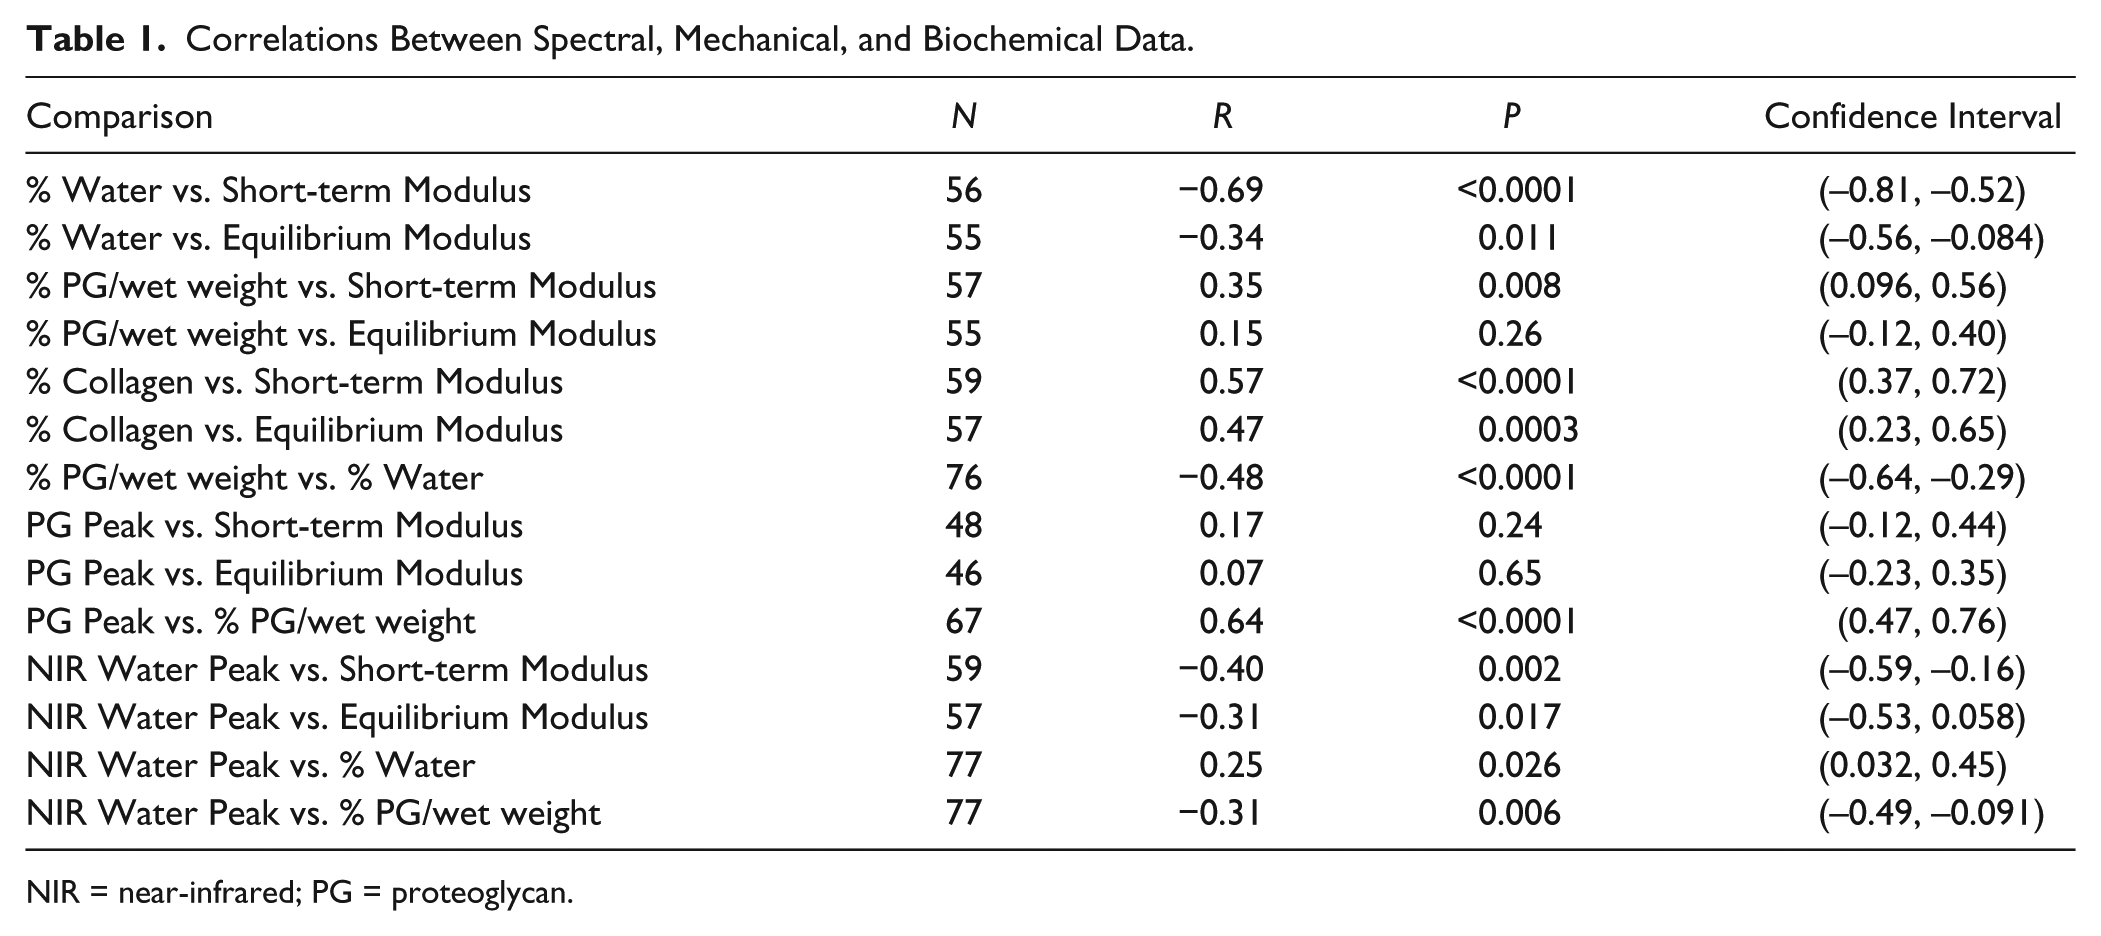
NIR = near-infrared; PG = proteoglycan.
Discussion
Non-destructive assessment of tissues has the potential to improve health care and research outcomes. Here, although the variation in water and PG content between LWB and HWB regions was only a few percent, this was sufficient to affect the mechanical properties of the LWB and HWB regions to a greater degree. Thus, a small change in the composition of cartilage clearly affects the tissue microstructure and influences complex mechanical properties. Interestingly, the equilibrium modulus did not show the exact same trend as the short-term modulus, where variations were observed across different LWB regions. This is likely due to the short-term peak force being affected by a combination of water and matrix properties, whereas the equilibrium force value occurs after the majority of water releases from the sample and thus depends more on matrix composition. Similar to recent studies,19,21,28 these data strongly support the use of non-destructive spectral analysis as tool for evaluation of cartilage compositional and mechanical properties. Although MIR data only arise from the sample surface, with a maximum penetration of 10 µm, the surface compositional data correlated with the full sample depth, which has been previously shown. 46 In contrast, NIR radiation can penetrate deeper into tissues, up to ~3 mm at higher wavenumbers, such as where the water peak evaluated here is located. 30
Recently, it has been shown that infrared spectra-determined composition correlates to healthy and osteoarthritic native articular cartilage and engineered cartilage construct composition in both the MIR and NIR range.15-19,21,22,26,28 NIR fiber optic spectroscopy has been successfully used arthroscopically by Spahn et al.20,47 to nondestructively analyze articular cartilage lesions in studies over the past decade, while further arthroscopic studies with a NIR probe led to the ability to differentiate between degenerative or traumatic lesions. 26 Although these studies support the idea that it could be possible to apply NIR evaluation in clinic and non-destructively obtain properties of articular cartilage prior to graft selection, correlations with mechanical properties had not been performed. Sarin et al. 21 used NIR spectral analysis of equine metacarpophalangeal joints to investigate the functional properties of articular cartilage around lesions on the joint, and they created a PLS model to predict the cartilage thickness and mechanical properties. More recently, they also used NIR spectroscopy to assess biochemical properties of equine cartilage. 48 Thus, it has been shown that NIR spectroscopy has the potential to be used to predict the mechanical and biochemical properties of degenerative articular cartilage. In Brown et al., 27 normal and osteoarthritic bovine tissues were analyzed by NIR and indentation tests were performed. The results indicated that, similar to our study, NIR spectroscopy correlated to mechanical properties, more specifically to the structural elasticity potential. 27 However, biochemical analysis was not performed in that study. Thus, the work presented here is the first to specifically assess how biochemical composition and mechanical properties of healthy articular cartilage vary across LWB and HWB regions of the knee, while also non-destructively assessing the variations with infrared fiber optic spectroscopy. This may be useful in a clinical setting, specifically for matching mechanical and biochemical properties of graft and cell harvest locations with the native cartilage properties of patients. Current gold standards for tissue analysis involve destructive, time consuming, and costly techniques, and thus cannot be performed during surgical procedures. Infrared fiber optic spectroscopy allows molecular composition to be efficiently analyzed without destroying tissues and has the potential to minimize the use of resources and time.
Currently, orthopedic surgeons do not have an ideal method to select osteochondral grafts or articular cartilage when repairing osteochondral defects, which typically occur on the HWB femoral condyles, during procedures such as OATS or mosaicplasty. Two non-destructive techniques to assess the quality of articular cartilage have previously been proposed, including use of a water jet system, 49 or of a tactile sensor, 50 both of which could be used arthroscopically. However, there were concerns regarding the feasibility of these instruments during arthroscopy, due to being bulky, sensitive to accidents, and the fact that they were designed to be used on cartilage that has been mechanically altered. 20 When repairing defects via mosaicplasty, and harvesting cartilage for ACI or MACI, the grafts or cartilage for repair are harvested from non-degenerated LWB tissue regions on the patellofemoral groove. As shown in the current and in previous studies, the compressive modulus and shear modulus of LWB tissue regions are inferior to those of HWB tissue regions.1,51 Recent studies have expressed concerns that such grafts may have inferior compositional and mechanical properties compared with the original properties of the sites being treated. 52 In OATS, although the grafts sites are typically matched between the patient and donor,12,53 there is a possibility that the grafts will not have the same properties as the patients native cartilage, which may be a contributing factor to the lack of optimal outcomes with the current methods of osteochondral defect repair.4-7,9-12,14 Similarly, a concern with the ACI and MACI methodology is that harvested chondrocytes may produce an inferior matrix dependent on the regions they originate from, which has been previously investigated by assessment of aggrecan production, PG synthesis, and cell proliferation.54-56 We envision surgeons probing cartilage spectroscopically to assess composition and mechanical properties, allowing for the identification of the optimal region to use for a graft. It appears that NIR spectra reflect mechanical properties primarily due to water and PG content contributions, potentially allowing the surgeons the ability to also interpret these properties intraoperatively.
In spite of the promising results, there were several limitations to our study. One limitation is that material properties were assessed following a freeze-thaw cycle, which may have caused disturbances in the extracellular matrix of the cartilage; there has been a focus on eliminating freeze-thaw cycles on allografts, leading to improved clinical outcomes.57,58 Another possible limitation is that the majority of samples were only used from 2 animals; however, the additional samples that came from 3 other animals showed the same trend. Furthermore, the primary purpose of this study was to evaluate the variation of different cartilage regions within subjects, as opposed to between subjects. Another limitation is that here, tissues composed of cartilage only were assessed by NIR, while in a clinical setting there would be a concern of contributions from the underlying bone. Nevertheless, it is possible to distinguish NIR absorbances that arise from bone or cartilage based on differences in frequencies, 59 and further studies could confirm correlations with mechanical properties in LWB and HWB regions in intact human tissues. This is beyond the scope of the current study but could be done using cadaver human cartilage from relatively younger subjects. Another limitation is the use of juvenile bovine articular cartilage, which may have a different regional variation in properties compared with human articular cartilage. Lyyra et al. 60 studied the mechanical properties of human articular cartilage in vivo and showed that one vertical region of the patellofemoral groove has significantly inferior mechanical properties compared to the femoral condyles. That study also showed that properties from the lateral side significantly varied compared with the medial side, 60 but it did not investigate differences in properties proximal to distal. Similarly, Afara et al. 19 studied the mechanical properties of healthy human articular cartilage but did not report any variation across the joint from LWB to HWB regions. Therefore, the variation of healthy human articular cartilage properties would need to be further assessed in various regions prior to use of the current method clinically. Additionally, utilization of infrared probes during arthroscopic surgical intervention would need be optimized due to the presence of saline solution, potential challenges in maintaining constant distances from the cartilage surface, length of data collection, and fiber optic size constraints in a limited joint space. One solution would be to create a spacer with glass on the end of it for the NIR probe, which then could be in contact with the tissue, and would also have the advantage of limiting the saline interference between the tissue and the NIR probe. In addition, the spectral data acquisition time will slightly increase the length of the procedure, but the benefit of harvesting donor tissue that is more similar to the tissue surrounding the defect in terms of mechanical and biochemical properties would make this a valuable tradeoff. In the current study, as the tissues were 6 mm in diameter, the same size as the probe, it is possible that a loss of NIR light to the edges of the tissues could have occurred. However clinically, intact tissues would be sampled, and a probe smaller than the 6 mm diameter probe used here would be utilized to fit through an arthroscopic portal.
In conclusion, infrared fiber optic spectroscopy in the NIR and MIR range are useful techniques for non-destructive determination of the variation of compositional and mechanical properties of articular cartilage across LWB and HWB regions. This could be advantageous for clinicians when selecting regions to harvest osteochondral grafts for procedures such as OATS and mosaicplasty, or when harvesting cartilage for cell extraction for ACI and MACI.
Footnotes
Acknowledgments and Funding
The author(s) disclosed receipt of the following financial support for the research, authorship, and/or publication of this article: NIH R01 AR AR056145 (NP), Temple University CARAS grant (JPK), MARC U-STAR grant NIH T34 087239-06 (support to JPK).
Declaration of Conflicting Interests
The author(s) declared no potential conflicts of interest with respect to the research, authorship, and/or publication of this article.
Ethical Approval
Ethical approval was not sought for the present study because there were no human subjects in this study.
Animal Welfare
Guidelines for humane animal treatment did not apply to the present study because live animals were not part of this study.