
Abstract
Objective
To evaluate and characterize the appearance of articular cartilage in the tibiofemoral joint of young professional soccer players using T2-relaxation time evaluation on magnetic resonance imaging (MRI).
Design
In this study, we included 57 male adolescents from the youth academy of a professional soccer team. The MRI scans were acquired of the knee joint of the supporting leg. An “early unloading” (minute 0) and “late unloading” (minute 28) T2-sequence was included in the set of images. Quantitative T2-analysis was performed in the femorotibial joint cartilage in 4 slices with each 10 regions of interest (ROIs). Statistical evaluation, using Wilcoxon signed-rank tests, was primarily performed to compare the T2 values of the “early unloading” and “late unloading.”
Results
When comparing “early unloading” with “late unloading,” our findings showed a significant increase of T2-relaxation times in the weightbearing femoral cartilage of the medial (P < 0.001) and lateral (P < 0.001) compartment of the knee and in the tibial cartilage of the medial compartment (P < 0.001).
Conclusion
In this study, alterations of the cartilage were found with a maximum in the medial condyle where the biomechanical load of the knee joint is highest, as well as where most of the chronic cartilage lesions occur. To avoid chronic damage, special focus should be laid on this region.
Introduction
Soccer is the most popular sport in the world and was played by more than 260 million people in 2006. But, as being a pivoting and high-impact sport, it is associated with an increased number of injuries. The majority of injuries are traumatic and occur in the lower extremities, mainly in the knees and ankles. 1 In the knee, most commonly the meniscus, the anterior cruciate ligament (ACL) and the medial collateral ligament (MCL) are affected. 2 However, especially in professional soccer, there is also a high risk of damage to the articular knee cartilage resulting from high-intensity and long-duration exercise.3-5 Injured cartilage has limited spontaneous ability to heal and so repair tissue with potentially inferior properties compared to hyaline cartilage is developed. 6 Thus, these acute or chronic cartilage defects together with other sports-related knee injuries may progress to osteoarthritis (OA) over time.7,8 Prevention programs such as the FIFA 11+ concept have been used to lower the incidence of soccer-related injuries,9,10 but articular cartilage defects in the knee of young or active individuals remain a problem in orthopedic practice. Hence, studies investigating early cartilage alterations in adolescent soccer players are crucial and will help establish specific concepts to prevent further cartilage damage in young athletes.
Magnetic resonance imaging (MRI) is a reliable and noninvasive technique to determine volume, thickness, and alterations in the cartilage structure. Quantitative T2-mapping is a proven technique to quantify the water content and collagen fiber orientation of cartilage. Elevated T2-relaxation times are closely associated with a loss of collagen fiber integrity and an altered water content.11-13 This has shown to be a sensitive parameter for the evaluation of cartilage degradation. 12 Decreased T2 values have been found immediately after 30 minutes of running and after compressive loading in cartilage areas sharing greater load. This can be explained by a reduction of water content, reflecting the porous, reversible fluid dynamics that naturally occur with exercise and loading.14,15 Consistent with these results, T2 measurements showed an increase of relaxation times in cartilage during phases of unloading. This phenomenon has shown to be most obvious in structurally altered cartilage. 16 Hence, sensitivity to loading effects is linked to the integrity of cartilage. 17 A recently published study that used the presented unloading algorithm in patients with knee OA found a significant higher increase of T2 values in damaged cartilage during unloading. This was not only visible among cartilage defect grades but also in cartilage areas of apparently morphologically normal cartilage adjacent to the defect. 13 Golditz et al. 18 showed comparable results in the ankle joint where increasing T2 values during unloading were detected in patients with functional ankle instability but not in healthy volunteers. Similar application was used in several other studies.19,20 In summary, it can be said that using T2 mapping with an unloading algorithm is a very sensitive method to detect early structural changes in the articular cartilage and an increase in T2 values during unloading can be seen as a biomarker for early cartilage damage.
The aim of this prospective study was to analyze knee joint cartilage of adolescent professional soccer players with regard to early cartilage damage. We investigated the knee joint with quantitative T2-mapping MRI as a biomarker for early changes in the cartilage substructure by using an unloading algorithm. The assumption that structural variations in cartilage of young professional soccer players are detectable by biochemical MR biomarkers was set as a base of our investigation. The study results would be valuable in various fields of sports medicine as it presents an approach to identify “cartilage at risk” and hereby enables preventive treatment.
Materials and Methods
Study Population
The ethics committee of the local university provided ethic approval. Written informed consent was obtained from all subjects for the study prior to enrollment. In this prospective study, we included 57 male volunteers from the youth academy of a professional soccer team that is currently playing in the first national league. The players had a mean age of 16.0 ± 1.8 years (range 13-19 years), a mean weight of 67.9 ± 8.9 kg (range 42-90 kg), a mean height of 1.78 ± 0.1 m (range 1.52-1.92 m), and a mean body mass index (BMI) of 21.4 ± 1.7 kg/m2 (range 17.3-25.7 kg/m2). Quantitative T2-mapping MRI was performed in all players in the knee of the supporting leg (46 left knees, 11 right knees). All soccer players followed an intense practice routine ranging from 3 to 5 times a week for a minimum of 90 minutes per session and participated in 1 or 2 league matches per week. In addition, every player had individual strength training adjusted accordingly to his need.
In this homologous group, the volunteers started playing soccer at the mean age of 5.3 ± 1.1 years (range 3-8 years), joined the youth academy between the ages of 7 and 15 years and at the time of data collection had been playing soccer for 10.8 ± 2.0 years (range 7-15 years). At the time point of MRI examination, all players were questioned on their medical history and physically examined by an orthopedic surgeon with 15 years of experience. Exclusion criteria were history of surgery or any traumatic knee lesion in the past 6 months that led to discontinuation or decreased frequency of soccer practice and any injuries, discomfort, or pain of the lower extremities at the time of image acquisition. Additionally, volunteers with osteoarticular abnormalities or malformations, a history of chronic disease (e.g., diabetes, hypertension, chronic liver disease, rheumatic, cardiac, renal, or neurological disease) and a BMI of greater than 25 kg/m2 were excluded. The 2000 International Knee Documentation Committee (IKDC) subjective knee evaluation form revealed an IKDC score of 100 in all volunteers. Comparably, all participants achieved a Lysholm score of 100. Twenty players had a normal knee alignment, 8 players a genu valgus, 28 players a varus alignment (24 slight varus, n = 24; severe varus, n = 4) and data for 1 player was missing.
Image Acquisition
MRI was performed on a 3-T MR scanner (Magnetom-Verio, Siemens, Erlangen, Germany) with a gradient strength of 45 mT/m, using a dedicated 15-channel, high-resolution knee imaging coil (QED, Quality Electrodynamics, Mayfield Village, OH, USA).
All volunteers were asked to perform daily routine activities prior to the MRI. The appointment for the examination was always in the afternoon from Monday to Friday and before any soccer training or soccer matches. The unloading algorithm was applied for all participants as following: They were asked to stand or walk for 10 minutes prior to the examination in order to avoid preimaging unloading of the cartilage. Because of a strict imaging schedule, there was no further waiting time before the examination. After a set of localizers, this spin-echo (SE) T2-sequence was planned over the supporting leg and was performed at the beginning (“early unloading”) and at the end (“late unloading”) of the MR examination. The mean time gap between the “early-unloading” sequence and the “late-unloading” sequences was 28.2 ± 0.7 minutes. The image protocol consisted of a sagittal, multiecho, SE T2-acquisition with the following parameters: repetition time (TR) 1300 ms; 6 echo times (TE) of 11.9 ms, 22.8 ms, 34.7 ms, 46.6 ms, 58.5 ms, 70.4 ms; field of view (FoV) 140 × 140 mm; pixel matrix 640 × 640 (interpolated 320 × 320); voxel size 0.2 × 0.2 × 3.0 mm; bandwidth 200 Hz/pixel; averages 1; 16 slices; and a total acquisition time of 4:24 minutes. T2-relaxation times were obtained from online reconstructed T2-maps using a pixelwise, monoexponential, nonnegative least squares fit analysis (MapIt, Siemens Healthcare, Erlangen, Germany).
Image Analysis
To ensure high quality and reproducibility of measurements, the “region-of-interest” (ROI) analysis for the quantitative T2 values was performed by 1 senior expert in musculoskeletal MRI (13 years of experience), in consensus with 2 junior experts (3 years of experience). Every analysis was performed separately by each reader on defined slices, saved, and provided identically for every expert. To evaluate “intraobserver” and “interobserver” reproducibility, measurements were repeated on the same slices in different reading sessions. The time period in between the sessions was set to a minimum of 3 months.
For T2-mapping, analysis was performed on a multimodal workstation (Leonardo; Siemens Healthcare, Erlangen, Germany) at the maximum magnification. To cover the whole weightbearing cartilage area of knee joint in the sagittal dimension, 4 slices were selected: one on the medial and lateral part of the knee joint cartilage and the consecutive slice on either side. All readers chose the slices for evaluation in consensus, based on the availability of a full thickness of the cartilage (no cutoffs, no beginning of phasing-out) and sufficient image homogeneity to secure highly differentiated defining of ROIs. Thus, of the 16 sagittal quantitative T2-mapping slices for ROI analysis, 2 medial and 2 lateral slices where chosen (as shown in Fig. 1 ).
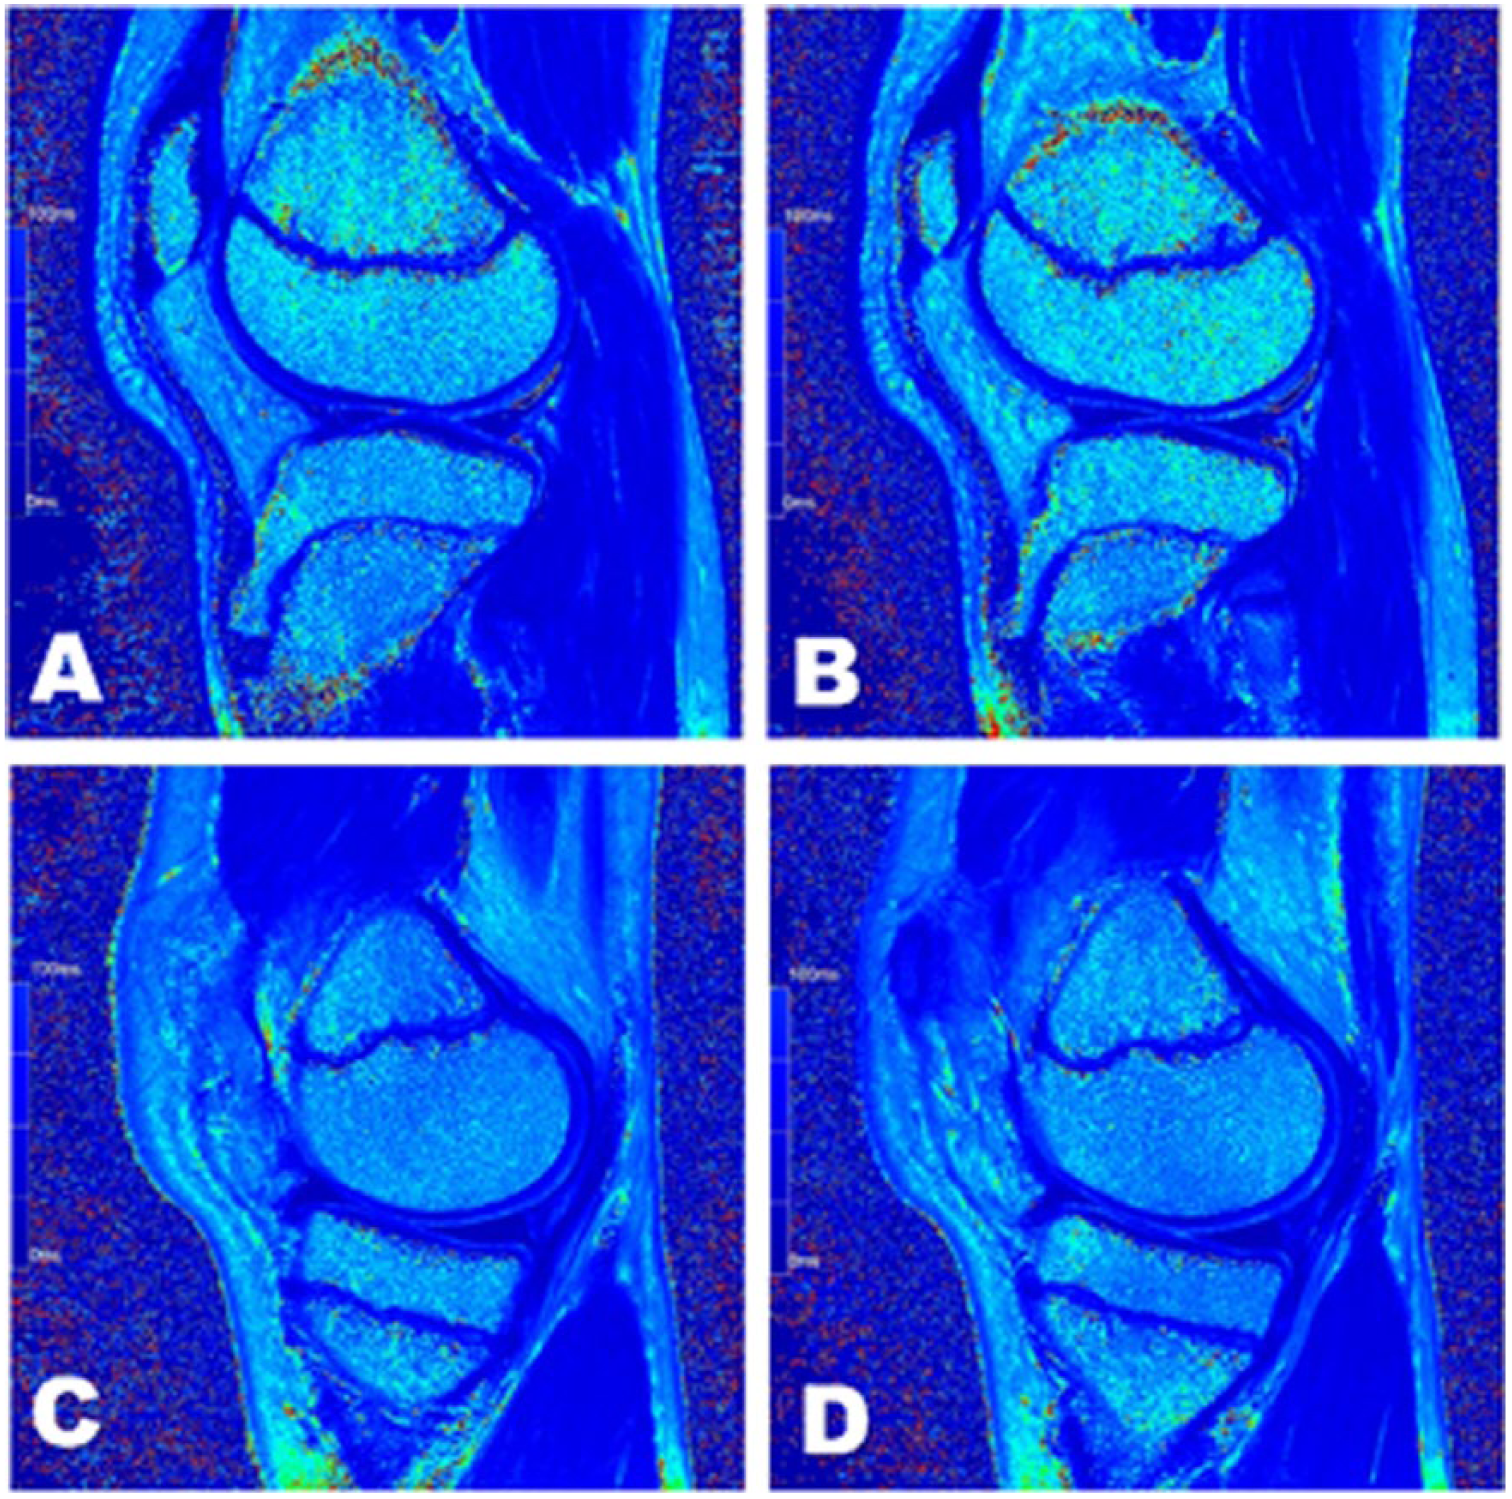
Selection of slices. Sagittal multiecho spin-echo quantitative T2-mapping images of the left knee of a 14-year-old volunteer. Of the 16 sagittal quantitative T2-mapping slices, 2 consecutive lateral (
Zonal evaluation of the cartilage was performed in 3 areas: In the weightbearing part of the tibial and femoral cartilage, the cartilage was divided into 2 equal zones: 1 ventral zone and 1 dorsal zone. The weightbearing part of the cartilage was defined as stretching from the peripheral margin of the anterior part to the peripheral margin of the posterior part of the respective meniscus. 21 The third zone where ROI analysis was performed, was located in the nonweightbearing dorsal femoral cartilage. To cover the whole thickness of the cartilage, each of the 3 zones was subdivided into 2 layers: 1 superficial (from the articular surface to the middle of the cartilage) and 1 deep layer (from the middle of cartilage to the cartilage-bone interface). Biochemical assessment (T2-mapping) was achieved in 10 ROIs by imposing this pattern on the tibial and femoral cartilage ( Fig. 2 ). The pixel count of the ROIs was documented (451.4 ± 141 pixels [minimum 128, maximum 925]).
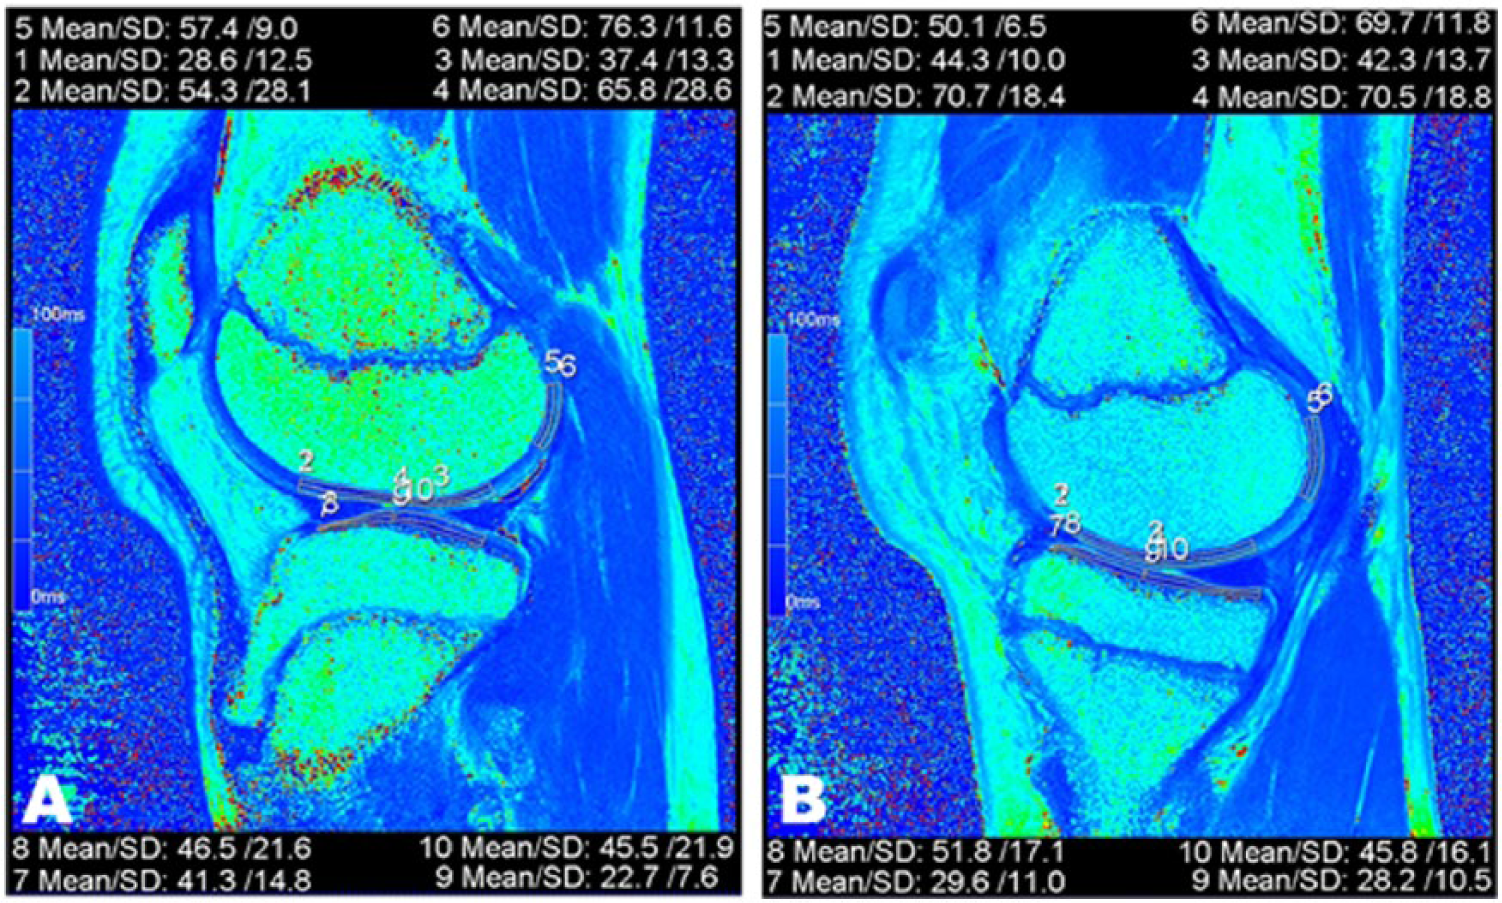
Cartilage regions of interest. Quantitative sagittal T2-map of the left knee of a 15-year-old male volunteer. The zonal region-of-interest (ROI) evaluation of the femoral and the tibial cartilage is visualized in a medial (
To achieve the greatest number of possible identical measurements, and thus, ensure good comparability between the “early-unloading” and “late-unloading” values, assessment was performed by an one-acquisition technique, in which 10 ROIs were placed in the femoral and tibial cartilage as mentioned above. To ensure identical placement, ROIs were copied from the “early-unloading” sequence and pasted onto the identical slice of the “late-unloading” sequence. ROIs were adjusted manually, whenever movement between the two acquisitions was detected. In this study, a total of 5360 ROIs were analyzed.
Statistical Analysis
Mean values, standard deviation of these values and median were calculated for the T2-relaxation times of different regions of the cartilage (“late” and “early” unloading, combined T2) and for age, height, weight, joint alignment and the number of years played. Statistical evaluation was primarily performed to compare the T2 values of the “early-unloading” and “late-unloading” acquisitions of the 3 global cartilage zones and the 10 ROIs. The variables were considered dependent and nonparametric (proved by Kolmogorov-Smirnov test and Shapiro-Wilk test) and therefore evaluated by the Wilcoxon signed-rank tests. Furthermore, the T2 values were tested for differences between the tibial and femoral cartilage and between the deep and superficial cartilage layer. The associations between the T2 values and age, height, weight, and leg alignment were analyzed with Spearman correlations. The association between the T2 values and the number of years played was analyzed with Partial correlation (adjusted for age). T2 values of age, weight, height, and number of years played were only compared with “late-unloading” T2 values, for better comparison with previous studies. The joint alignment was correlated with the change of T2 values during unloading (∆T2 = T2 late unloading – T2 early unloading) and also with “late-unloading” T2 values. The inter- and intraobserver reproducibility was determined as an intraclass correlation coefficient (ICC). SPSS Version 23.0 (IBM Corp, Armonk, NY, USA) for Windows (Microsoft, Redmond, WA, USA) was used. A P value ≤0.05 was considered statistically significant.
Results
Group characteristics were as described above and quantitative T2 times (ms) are provided for all patients together. The intra- and interobserver variability, as assessed by the ICC, was >0.9.
Comparison of “Early” and “Late” Unloading
T2 Values
To get an overview of changes in T2 values and also for simplification of the results we first analyzed changes from “early” to “late” unloading in pooled cartilage zones (global tibial zone, global weightbearing femoral zone, and global nonweightbearing femoral zone). Results are always depicted separately for the medial and lateral condyle. A significant increase of T2-relaxation times was determined in the weightbearing femoral cartilage of the medial (+5%, 50.0 vs. 52.5 ms, P < 0.001) and lateral (+4.1%, 48.7 vs. 50.7 ms, P < 0.001) compartment of the knee and in the tibial cartilage of the medial compartment (+2.5%, 40.3 vs. 41.3 ms, P < 0.001). In the tibial cartilage of the lateral compartment no significant change was assessed (+0.3%, P = 0.805). The nonweightbearing femoral cartilage showed a statistically significant decrease of T2 values in the lateral compartment of the knee (−3.6%, 54.9 vs. 52.9 ms, P = 0.001) but not in the medial compartment of the knee (+1%, P = 0.295). The results of the analysis of the changes that occurred from “early” to “late” unloading in global ROIs are depicted in Figure 3 .
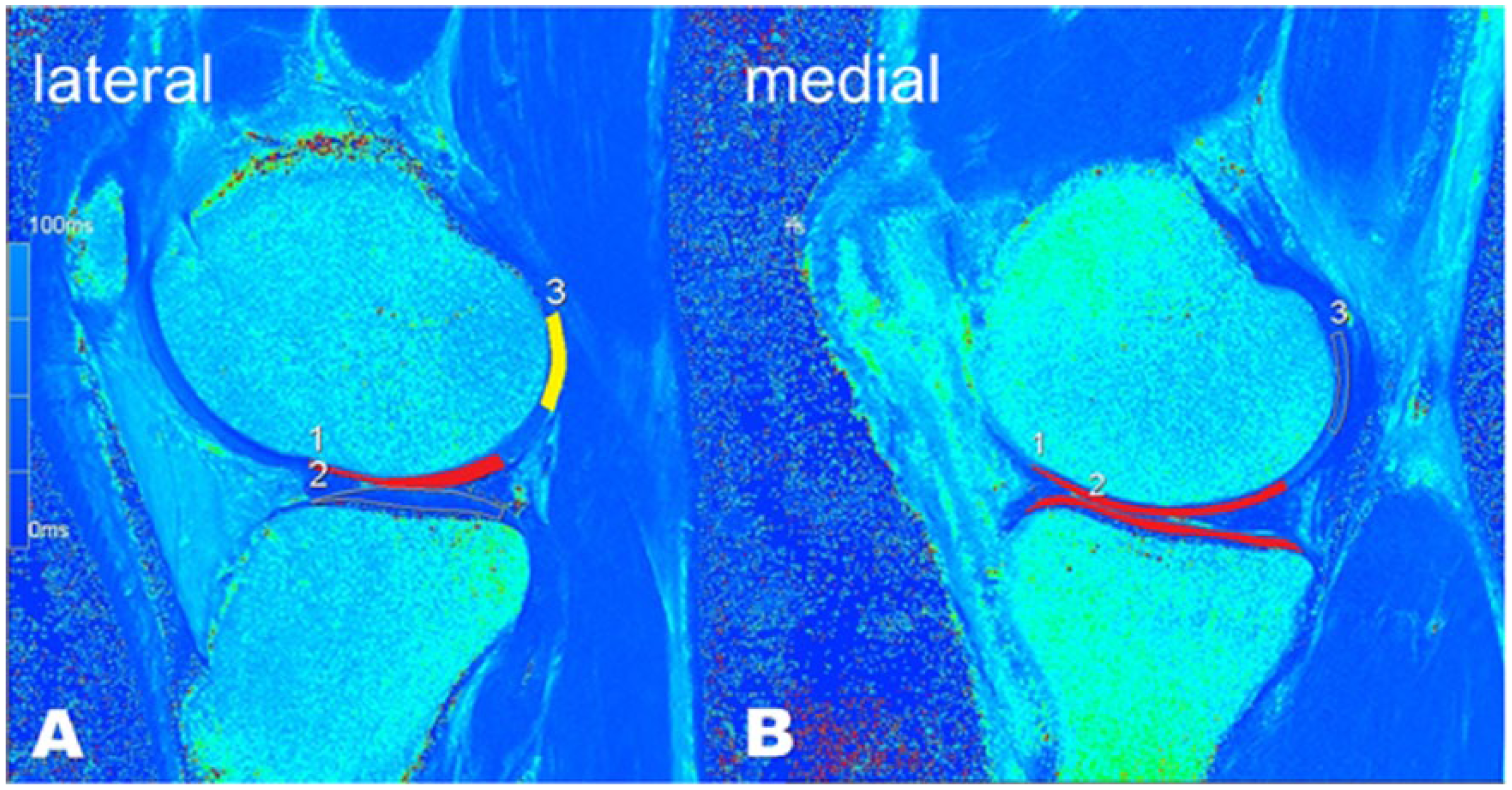
Schematic illustration of changes in global regions of interest (ROIs) from “early” to “late” unloading. Sagittal multiecho spin-echo quantitative T2-mapping images of the left knee of a 18-year-old male volunteer. Areas marked in yellow indicate a significant decrease during unloading, whereas areas marked in red indicate a significant increase during unloading. Changes are visualized in one lateral (
For a more detailed information, we analyzed how T2 values changed during unloading separately for each ROI. In the medial compartment T2-relaxation times increased significantly in 3 of 4 zones of the weightbearing femoral cartilage (anterior deep and superficial femoral cartilage, central superficial femoral cartilage) and also in the central tibial cartilage (deep and superficial zone). No significant change was observed in the central deep femoral cartilage, in the anterior tibial cartilage (deep and superficial zone) and in the nonweightbearing dorsal femoral cartilage (deep and superficial zone). In the lateral compartment, T2-relaxation times increased significantly only in the superficial zone of the anterior and central femoral cartilage. The deep dorsal femoral cartilage layer in the lateral compartment was the only cartilage zone that showed a significant decrease of T2 values. No significant changes of T2 values were found in the tibial cartilage and in the deep femoral layers. The results of the analysis of the changes that occurred from “early” to “late” unloading are depicted in Table 1 and Figure 4 .
Mean T2 Values of Early Unloading (1st) and Late Unloading (2nd) With the Calculated Percentage of Increase (+x%) or Decrease (−x%) Over Time and P Values (Ptime). a
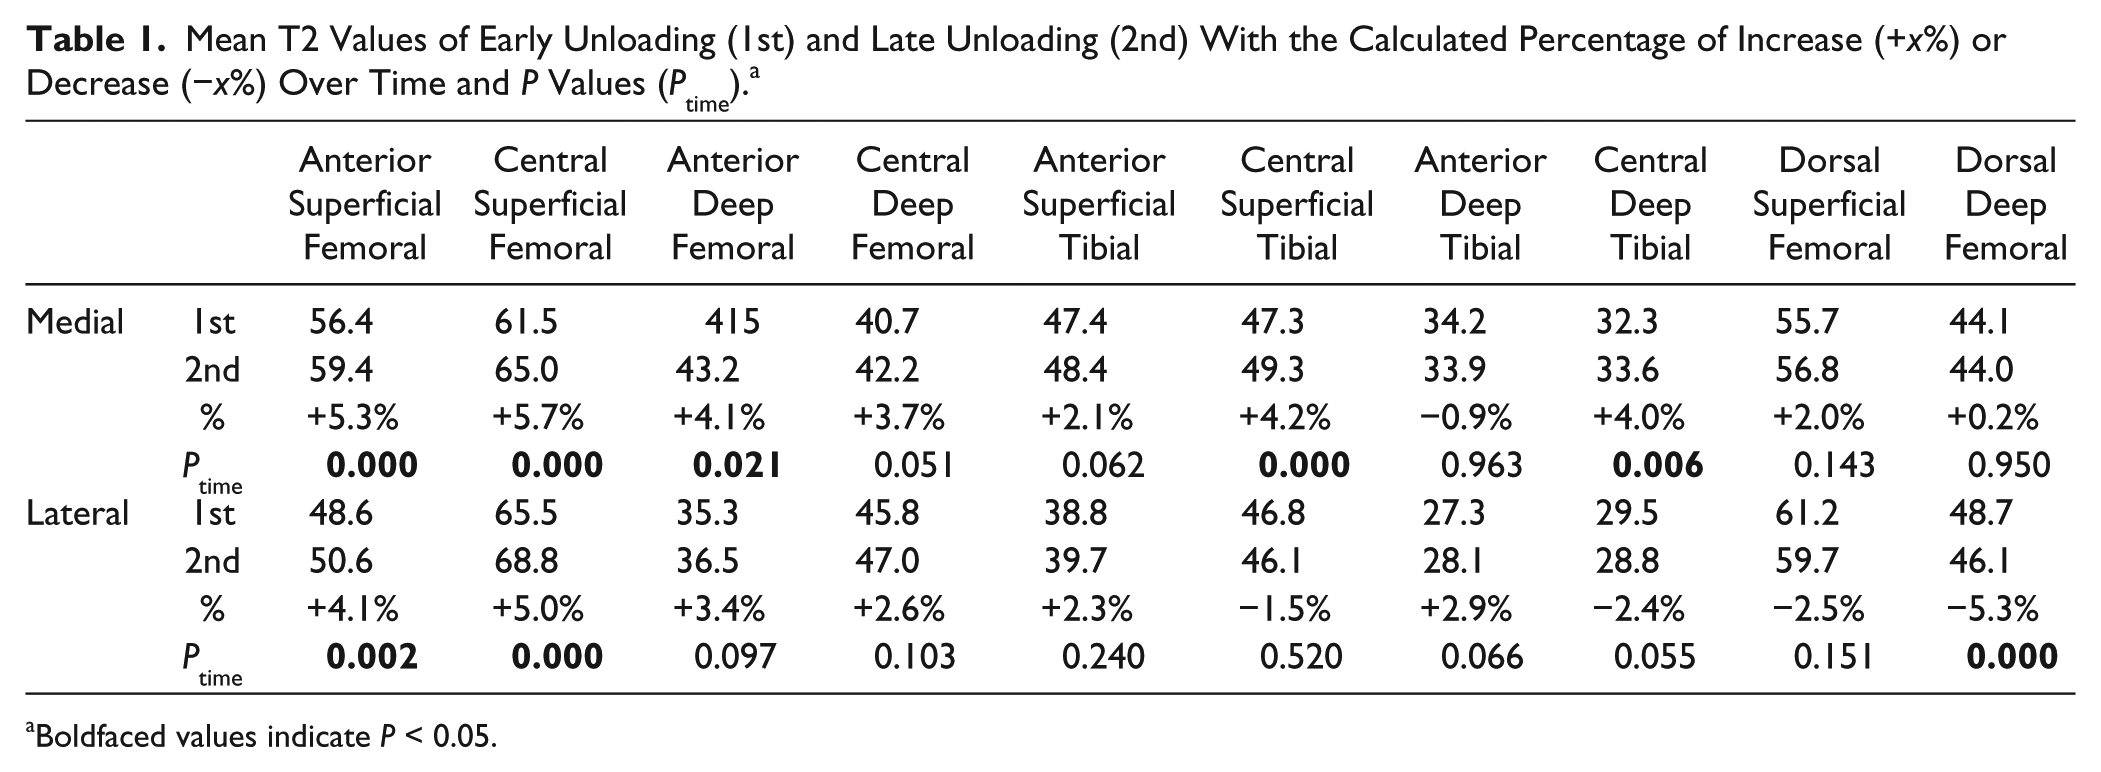
Boldfaced values indicate P < 0.05.
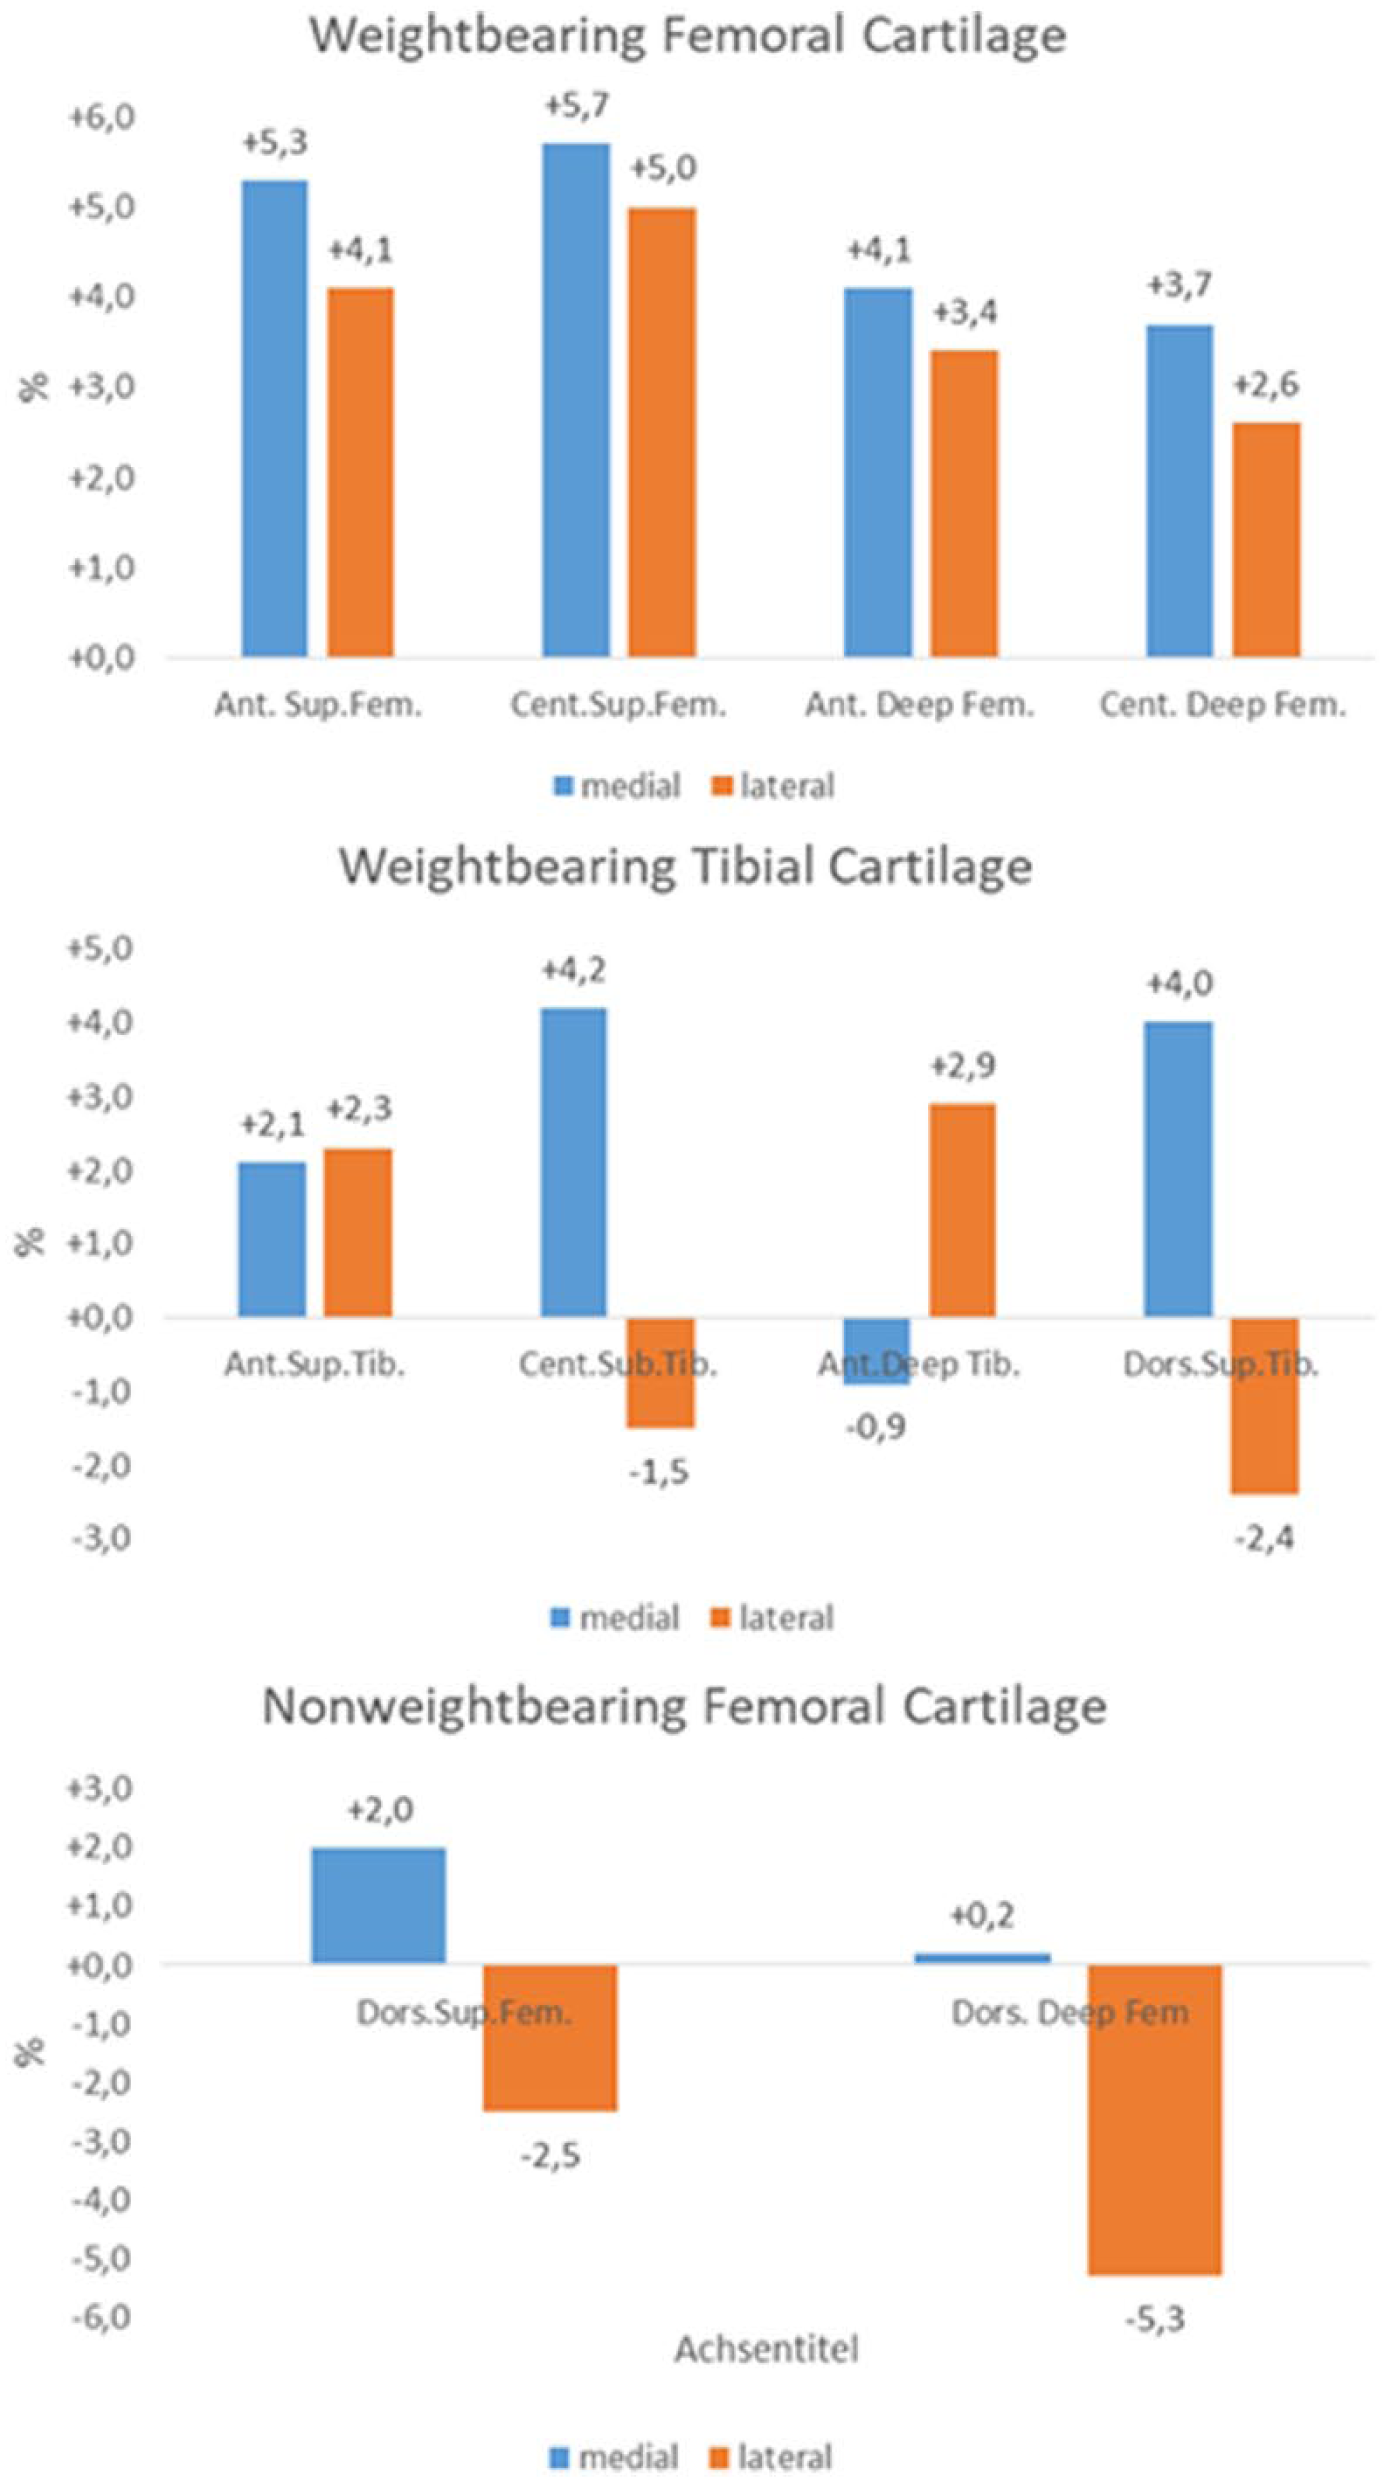
Calculated percentage of increase (+x%) or decrease (−x%) that occurred from “early” to “late” unloading in separate regions of interest (ROIs).
Cross-Sectional (Exploratory and Confirmatory) Findings
A significant difference was observed between the femoral and tibial cartilage. Values were higher in the femoral cartilage when looking at global T2 values of all femoral and all tibial zones (50.5 ± 11.5 vs. 38.2 ± 8.5 ms, P < 0.001).
We also found significant longer relaxation times in the superficial than in the deep layers of the cartilage (P < 0.001 for the comparison of the deep to the superficial layer in all cartilage regions), regardless of the loading state.
Furthermore, a significant difference between the T2 values of the medial and lateral compartment of the knee in all 10 ROIs was observed (P values ranging from <0.001 to 0.048). Overall, T2 values of the tibial and the anterior femoral cartilage were higher in the medial compartment, whereas T2 values of the dorsal femoral cartilage and the central femoral cartilage were higher in the lateral compartment.
Negative correlations of T2 values with age, height, and weight were assessed. Thus, T2-relaxation times decreased with these parameters. For height, this correlation reached significance in all 10 ROIs with correlation coefficients ranging from −0.151 to −0.332 (P values ranging from <0.001 to 0.001). For weight, a negative correlation of T2 values was assessed in 9 out of 10 ROIs with correlation coefficients ranging from −0.137 to −0.429 (P values ranging from <0.001 to 0.003). Similarly, for age, a significant correlation was observed in 9 ROIs with correlation coefficients from −0.137 to −0.510 (P values ranging from <0.001 to 0.003). In both, age and weight, no significant correlation was reached in the deep central femoral cartilage. Furthermore, no significant correlation between the “late-unloading” T2 values and the number of years played after adjusting for age was found.
In this group, 20 players had a normal knee alignment, 8 players a genu valgus, 28 players a varus alignment (24 slight varus, n = 24; severe varus, n = 4) and data for 1 player was missing. For statistical analysis, participants with valgus alignment were excluded due to small group size and data of participants with slight and severe varus was combined. When correlating the change of T2 values during unloading (∆T2 = T2 late unloading − T2 early unloading) of participants with normal knee alignment (n = 20) and varus alignment (n = 28) there was no significant correlation in the medial compartment (pooled ROIs and separate ROIs) and a negative correlation in the deep anterior femoral zone of the lateral compartment with a correlation coefficient of −0.303 (P = 0.003), but not in the pooled weightbearing zone of the femoral condyle. Whereas in normal alignment a significant increase of T2 values was found in the deep anterior femoral zone of the lateral condyle (+9.9%, 33.3 vs. 36.6 ms, P = 0.003), this was not present in varus alignment (−2.4%, 37.5 vs. 36.6 ms, P = 0.346). “Late-unloading” T2 values showed a significant correlation with the joint alignment in the deep and superficial central femoral cartilage of the lateral compartment (correlation coefficient −0.234 and −0.203, P = 0.022 and 0.047).
Discussion
This study investigated the tibiofemoral joint cartilage of adolescent professional soccer players focusing on early cartilage damage. Quantitative T2-mapping with an unloading algorithm was used to assess short-term changes in the cartilage substructure. Our findings showed a significant increase of T2 relaxation times during unloading in the weightbearing femoral cartilage of the medial (P < 0.001) and lateral (P < 0.001) compartment of the knee and in the tibial cartilage (P < 0.001) of the medial compartment.
In many studies, quantitative T2-mapping has been shown to be a valid and feasible parameter for the quantification of ultrastructural changes in cartilage.12,22 Focal increases in T2 relaxation times in cartilage have been associated with matrix damage, in particular with a loss of collagen integrity and an increase in water content. 23 Most of these studies were carried out in patients with OA21,24 or in patients after cartilage repair.11,25,26 In a study conducted by Dunn et al., 21 absolute T2 relaxation times in patients with different stages of OA were compared. In this trial, femoral cartilage T2 values and medial tibial cartilage T2 values were higher in patients with OA than in healthy subjects. 21 Interestingly, in this study no significant difference in mean T2 relaxation times was found between mild and severe OA. It was seen as a possibility that the cartilage changes which lead to a higher T2 value occur early in the development of the disease. 21 This observation was also made in a recently published study by Liebl et al. 27 In this trial, there was an increased likelihood of incident knee OA in volunteers with higher baseline T2 values of the femorotibial joint. These findings underscore that T2 measurements are sensitive to the earliest changes in the biochemical cartilage composition and through early diagnosis may play a role in prevention of OA.
There are also a large number of studies that used T2-mapping as a parameter for loading and overloading situations in the knee cartilage of healthy volunteers. Elevated T2 values were reported in runners within 48 hours after participating in a marathon. In the tibiofemoral joint, the medial compartment showed the highest signal changes, suggesting a higher risk for degeneration in this region. 28 This is no surprise as several study results showed that in normal knees the medial femoral condyle supports higher biomechanical load compared with the lateral condyle.29,30 Consistent with their results, the medial condyle also seems to be more affected in our study population. We found the highest T2 signal changes during unloading in the medial femoral condyle. Values increased by 5.0% (global ROIs) in the medial femoral condyle, whereas they only increased by 0.3% to 4.1% in the other weightbearing regions (global ROIs). The only statistically significant increase of the tibial cartilage was also observed in the medial compartment of the knee. T2-relaxation times of the central tibial cartilage changed by 4.2% in the superficial layer and by 4.0% in the deep layer. What is more, a significant increase was only observed in the superficial layer (anterior, 4.1%; central, 5.0%) of the lateral femoral condyle whereas the medial condyle showed an increase in one deep layer (anterior, 4.1%) and both superficial layers (anterior, 5.3%; central, 5.7%). These results clearly suggest that the cartilage of the medial compartment of the knee reacts more sensitive to repetitive loading how it occurs in marathon running and in soccer.
Furthermore, changes were more pronounced in the superficial than in the deep layer. T2-relaxation times of the weightbearing femoral cartilage increased by 5.0% in the superficial layer whereas they increased only by 3.4% in the deep layer. In the tibial cartilage T2 values increased by 2.0% in the superficial layer whereas they increased only by 1.0% in the deep layer. This more sensitive reaction of the superficial cartilage layer to loading or unloading situations is in agreement with several previous studies.15,26,31 This supports the hypothesis that greater tissue deformation occurs in the superficial layer during exercise and it is compatible with the recognized pattern of development for OA, which begins in the superficial layer of cartilage.
In summary we found, as expected, significantly increasing T2 values during unloading in cartilage areas sharing greater load. Interestingly, in the nonweightbearing femoral cartilage a reduction of T2 signals was observed (P = 0.001). This was only significant in the lateral condyle and can be explained by a reduction of water content during unloading. So far, little focus has been laid on this region in other trials. In a study conducted by Subburaj et al., 15 the cartilage T2 was assessed before and immediately after 30 minutes of running. Whereas all other cartilage regions showed a decrease of T2-relaxation times due to cartilage compression, no signal changes were observed in the nonweightbearing lateral femoral cartilage. 15 These results reflect that the posterior nonweightbearing femoral cartilage is affected differently during phases of loading and unloading than the weightbearing cartilage.
The indicated differences in T2 values between superficial and deep layer have also been described in a study by Smith et al., 32 where T2 increased from the deep zone of femoral cartilage to the articular surface, and from the deep zone of tibial cartilage to the surface. Several other studies confirm these findings for healthy cartilage.15,26,33,34 In our study, T2 values increased from 42.2 ms in the deep layer to 60.9 ms in the superficial layer in the femoral cartilage and from 31.1 ms in the deep layer to 45.9 ms in the superficial layer of the tibial cartilage. As suggested by several studies, we used the T2 values of the unloaded joint (late-unloading T2-relaxation times, minute 28).13,16,35
We found a negative correlation of T2-relaxation times with age, and correspondingly with height and weight, (as both increase with increasing age). Several investigators have studied the age dependency of cartilage T2 maps during the period of skeletal maturation. Consonant with our results, most studies found a sequential decrease in T2 relaxation times with increasing age.36,37 A significant correlation between T2 values and the number of years played after adjusting for age was not found. This might be related to the comparatively similar age when our volunteers started playing soccer (5.3 ± 1.1 years) and similar period of time (10.8 ± 2 years) they have been playing.
In this population of young professional soccer players, a significant correlation of the joint alignment and ∆T2 was assessed in the deep anterior femoral zone of the lateral condyle. “Late-unloading” T2 values showed a significant correlation with the joint alignment in the deep and superficial central femoral cartilage of the lateral compartment. The results might be related to imbalanced loading in the joint in the volunteers with varus alignment. Interestingly, no significant correlation of chance in T2 values was assessed in the medial compartment, where changes in varus alignment would be expected. This might not only be due to the mild severity of the varus (slight varus, n = 24; severe varus, n = 4) but also due to the young age of our volunteers. All in all, this result should be interpreted with caution due to the small group size. Even though in this study we only included volunteers with no history of acute, chronic, or overuse injury, they all participated in high-intensity soccer training and therefore experienced great burden on the knee joint and possible overuse. Especially in adolescent and pediatric sports overuse is one of the most common factors that lead to injuries. 38 These overuse injuries occur when repetitive stress results in microtraumatic damage and adequate time to heal is not given. 39 Injured cartilage has limited spontaneous ability to heal and thus these acute or chronic cartilage defects together with other sports-related knee injuries may progress to OA over time.7,8 The prevalence of knee OA among professional soccer players is higher than in the nonathletic population with preponderance in the nondominant leg.4,40-42 Two studies, which used radiographic examination to diagnose OA, found a prevalence rate of knee OA between 60% and 80% in former elite soccer players. 42 (Apart from previous knee injury, knee OA is accelerated by overuse, misloading, high body mass index, and muscle weakness and is therefore multifactorial.43-45) Therefore, trials with an approach to identify regions with “cartilage at risk” in young soccer players are crucial. Hereby, the development of specific concepts or treatments to prevent further cartilage damage might be enabled and possible consecutive OA might be prevented.
This leads to the limitations of this study. As yet no longitudinal data are available, and thus, no prediction can be made about how T2 values will develop over time. Hence a follow-up study is realized at present. Another limitation is the lack of histological or surgical proof of the presented results. Nevertheless, based on the available literature, quantitative T2-mapping can be seen as an accepted biomarker for early cartilage damage. However, Mosher et al. 31 suggest a multispectral approach to the risk-analysis for cartilage tissue. Therefore, adding a proteoglycan-sensitive technique to the study’s protocol might be interesting. Another limitation of our study is the relatively small cohort and future studies of larger patient groups will be needed to confirm our findings. A further potential limitation is the fact that only young healthy adolescents with a high-risk profile concerning cartilage damage participated in our study, so our results can only be applied on a small cohort.
In this study, alterations of the cartilage were found in the weightbearing femoral and medial tibial cartilage. This might be a result of the high-intensity soccer training. To avoid chronic damage, special focus should be laid on these regions. Above all, chronic overstressing should be avoided, adequate training of the supporting muscle structure should be ensured, consistent support of the training with proprioceptive training should be provided and the sensorimotor control should be optimized. T2-mapping is a feasible biomarker and seems to be a promising, highly sensitive method to detect early alterations of the cartilage. To our knowledge, this is the first study that identified regions with “cartilage at risk” in young, healthy adolescents with high-intensity and long-duration stress on the knee joint.
Footnotes
Authors’ Note
The work was performed at Department of Traumatology, University Hospital Erlangen of the Friedrich-Alexander-Universität (FAU) Erlangen-Nürnberg, Erlangen, Germany. The present work was performed in fulfillment of the requirements for obtaining the degree of “Dr. med.”
Acknowledgments and Funding
We wish to thank all volunteers who took part in this study for their participation. Technical support for MRI acquisition was provided by the Imaging Science Institute, a cooperation of the Department of Radiology, University of Erlangen, Germany, and Siemens Healthcare, Erlangen, Germany.
Declaration of Conflicting Interests
The author(s) declared no potential conflicts of interest with respect to the research, authorship, and/or publication of this article.
Ethical Approval
Ethical approval for this study was obtained from the ethics committee of the local university (4397).
Informed Consent
Written informed consent was obtained from all subjects for the study prior to enrollment.
Trial Registration
Not applicable.