
Abstract
Objective:
Contrast-enhanced computed tomography (CECT) has been introduced for the evaluation of cartilage integrity. Furthermore, CECT enables imaging of the structure and density of subchondral bone. In this laboratory study, we investigate the potential of microCECT to simultaneously image cartilage and subchondral bone for the evaluation of tissue healing.
Design:
Osteochondral lesions (Ø = 6 mm) were surgically created in equine intercarpal joints (n = 7). After spontaneous healing for 12 months, the horses were sacrificed and osteochondral plugs (Ø = 14 mm), including the repair cartilage and adjacent intact tissue, were harvested. The nonfibrillar and fibrillar moduli and the permeability of cartilage were determined using indentation testing. Contrast agent diffusion into the samples was imaged for 36 hours using high-resolution CT. Results from CECT, mechanical testing, and microscopic analyses were compared and correlated.
Results:
The contrast agent diffusion coefficient showed a significant (P < 0.05) difference between the repair and adjacent intact tissue. MicroCECT revealed altered (P < 0.05) bone volume fraction, mineral density, and microstructure of subchondral bone at the repair site. The contrast agent diffusion coefficient correlated with the moduli of the nonfibrillar matrix (R = −0.662, P = 0.010), collagen fibril parallelism index (R = −0.588, P = 0.035), and glycosaminoglycan content (R = −0.503, P = 0.067). The repair cartilage was mechanically and structurally different from adjacent intact tissue (P < 0.05).
Conclusions:
MicroCECT enabled simultaneous quantitative evaluation of subchondral bone and monitoring of cartilage repair, distinguishing quantitatively the repair site from the adjacent intact tissue. As the only technique able to simultaneously image cartilage and determine subchondral bone mineral density and microstructure, CECT has potential clinical value.
Introduction
Clinical diagnosis of osteochondral lesions is challenging. Typically, degenerative lesions are detected during routine arthroscopy. 1 However, cartilage surface lesions may also be detected by means of computed tomography (CT) arthrography2-4 and magnetic resonance (MR) arthrography or various magnetic resonance imaging (MRI) techniques. For local lesions, different treatment options such as autologous chondrocyte transplantation, osteochondral grafting, mosaicplasty, and marrow stimulation are available.5-8 Since untreated cartilage injury may initiate the development of secondary osteoarthritis, 9 it is important to diagnose and delineate injuries as early and accurately as possible. There is a need for less invasive techniques than arthroscopy to aid in decision making before choosing the appropriate surgical treatment and for follow-up of tissue healing after the operation.3,10 Today, MRI is the standard method in the postoperative assessment of tissue repair. However, the limited resolution and availability, together with high imaging costs, limit the use of MRI for screening and follow-up of cartilage injuries.10-12
Conventional MRI and CT have certain limitations concerning imaging of the internal structures of cartilage and detection of the early stages of degeneration.2,5,13 However, MRI methods that enable estimation of biomechanical and biochemical status of cartilage have been introduced.5,14-16 Delayed gadolinium-enhanced MRI of cartilage (dGEMRIC) is a technique proposed for quantitative evaluation of the glycosaminoglycan (GAG) concentration in cartilage. 17 The technique is based on the assumption that negatively charged contrast agent distributes into tissue in inverse relation to the distribution of GAG molecules, which carry a negative charge. Recently, a similar technique to dGEMRIC, contrast-enhanced computed tomography (CECT), was presented.18,19 In addition to its capacity to image the equilibrium distribution of contrast agents in tissue in the laboratory environment,20-23 it can also be used to image the transport (diffusion flux and diffusion coefficient) of contrast agent into cartilage. This has been investigated as a potential indicator of cartilage status.21,22,24
CECT has been suggested to predict biomechanical properties of articular cartilage.20,25 The potential of microCECT to detect acute mechanical injury of articular cartilage has also been investigated. 26 In that study, the integrity of the collagen network was speculated to significantly affect contrast agent diffusion. This is supported by several studies suggesting that not only the fixed charge density (FCD) induced by the GAGs but also other factors affect significantly the diffusion of contrast agent.21,24,26-28 These possible factors include collagen content and the structure of the collagen network. Normal hyaline cartilage is organized into 3 zones according to the preferential direction of the collagen fibrils.29,30 In regenerated cartilage, the arcade-like organization of the type II collagen fibrils is often absent, and the repair tissue can be characterized as fibrous cartilage, rich in type I collagen.31,32 So, this difference in the collagen network can affect the diffusion of contrast agent. We hypothesize that the abnormally organized repair tissue can be distinguished from the adjacent intact tissue with the microCECT technique by imaging contrast agent diffusion dynamics.
CT gives quantitative information on bone microstructure and mineral density. 33 For this reason, simultaneous quantitative evaluation of subchondral bone is possible with microCECT, 25 in contrast to dGEMRIC. As changes in the density and structure of subchondral bone are known to occur during healing of cartilage injury,9,34 we hypothesize that microCECT will enable quantitative detection of these changes in the animal model.
To the best of our knowledge, the microCECT for simultaneous imaging of changes in cartilage and subchondral bone during spontaneous healing of cartilage injury has not been investigated. In this laboratory study, we investigate the ability of microCECT to distinguish spontaneously healed osteochondral lesions from normal tissue in the equine intercarpal joint. More specifically, we compare the healing-related changes in quantitative microCECT parameters (describing cartilage and subchondral bone structure and contrast agent diffusion) with the changes in the reference parameters (describing histological and mechanical tissue properties).
Methods
Sample Preparation
Osteochondral lesions (Ø = 6 mm) were surgically created in the fourth carpal bone of the intercarpal joints of 24-month-old horses (n = 7) through a lateral-dorsal arthrotomy under general anesthesia. A surgical burr was used to create the lesions until a depth of 4 mm under continuous lavage with Ringer’s solution. Afterward, the joint capsule, subcutis, and skin were sutured, and the surgical site was protected with a sterile bandage for 7 days. Analgesia with meloxicam (0.6 mg/kg) was provided orally for 7 days postoperatively. Horses had a 2-week period of box rest until the sutures were removed. While housed in individual boxes for 2 months, horses had daily walking exercise for 20 minutes. Subsequently, horses spent the rest of the experiment together at pasture having free exercise. Importantly, horses seemed to feel comfortable and fully weightbearing from the first day after surgery until the end of the experiment. After 12 months, the horses were sacrificed, and osteochondral plugs (Ø = 14 mm), including the repair cartilage and intact adjacent tissue, were harvested. The procedures were approved by the Utrecht University Animal Experiments Committee. Samples were stored frozen (–20 °C) until the measurements in phosphate-buffered saline (PBS) containing inhibitors of metalloproteinases, 5 mM ethylenediamine tetraacetic acid (EDTA) disodium salt (VWR International, Fontenay, France), and 5 mM benzamidine hydrochloride (Sigma-Aldrich, St. Louis, MO).
Determination of Cartilage Mechanical Properties
A custom-made material testing device was used for the determination of the mechanical properties of the repair and adjacent cartilage. 35 The samples were tested using a stepwise (3 steps) creep indentation protocol with an impermeable, plane-ended indenter (radius 272 µm) ( Fig. 1 ). The step stress was increased by 84 kPa in every step, and the deformation after each step was recorded for 1200 seconds. The first step was considered a prestep to confirm good contact between cartilage and the indenter ( Table 1 ).
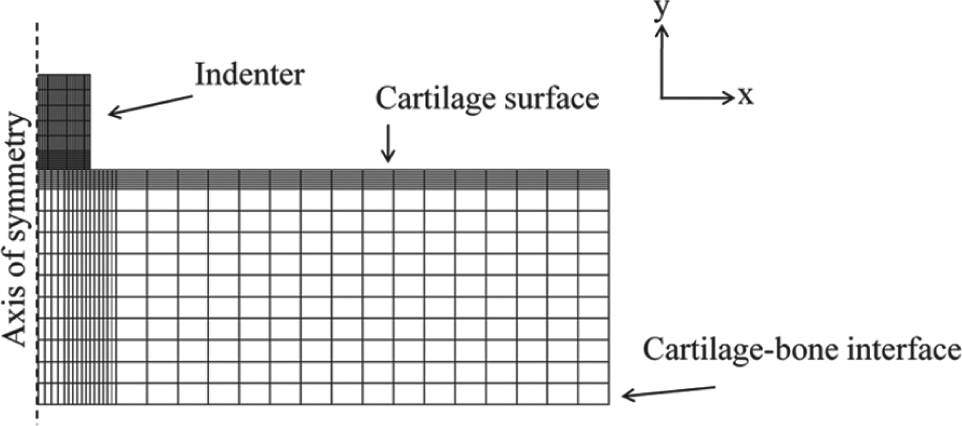
A finite element mesh was generated for cartilage and the indenter (radius 272 µm). Cartilage thickness for each sample was obtained from the micro–computed tomography (microCT) images. Cartilage was modeled as a fibril-reinforced biphasic material, and the models were fitted to sample-specific experimental creep measurements. In this way, the optimized values of material parameters (i.e., E nf , E f , and k) were derived for each sample.
The samples went through mechanical creep testing, CECT imaging, and histological measurements
Collagen fibril orientation angle and parallelism index were obtained by means of polarized light microscopy. Digital densitometry was used to quantify the glycosaminoglycan (GAG) distribution in the samples.
The experimental creep behavior of each sample was simulated using finite element analysis (FEA). A fibril-reinforced poroelastic model36,37 was constructed using Abaqus (versiom 6.9 EF1; Dassault Systèmes Simulia Corp., Providence, RI) ( Fig. 1 ). Articular cartilage in the model was assumed to be a biphasic material consisting of solid and fluid phases. The fluid fraction was adjusted to be 85% in each model.36,37 The solid matrix consisted of a nonfibrillar and a fibrillar part mimicking the mechanical effects of GAGs and the collagen network, respectively. The nonfibrillar matrix was assumed to be hyperelastic (neo-Hookean) with a Young’s modulus E nf and a Poisson’s ratio v (fixed: 0.4236,37). The behavior of the collagen fibrils was expressed with the fibril network modulus E f , and the fluid flow-dependent viscoelasticity was described with the hydraulic permeability k.
Cartilage was modeled using axisymmetric, 4-node, continuum elements with pore pressure (element type: CAX4P), whereas the indenter was modeled as linearly elastic material (element type: CAX4). Cartilage edge and surface (except for the cartilage-indenter contact) were set to be permeable (zero pore pressure). The bottom of the cartilage (cartilage-bone interface) was fixed in x- and y-directions, and horizontal movement (x-axis) was prevented at the axis of symmetry ( Fig. 1 ). Cartilage-indenter contact was assumed frictionless. The step stress (84 kPa), implemented in the model as a contact stress between cartilage and indenter, and creep time (1200 seconds) were the same as in the experiments. Cartilage thickness, obtained from the microCT images ( Table 2 ), was adjusted in a sample-specific manner. The unconstrained nonlinear optimization routine of the Matlab Optimization Toolbox (R2007b; The MathWorks, Inc., Natick, MA) was used to fit the following parameters: E nf , E f , and k. The mean square error between the experimental and simulated displacements was minimized.
Parameters (Mean ± 95% Confidence Interval) Analyzed for Cartilage and Subchondral Bone
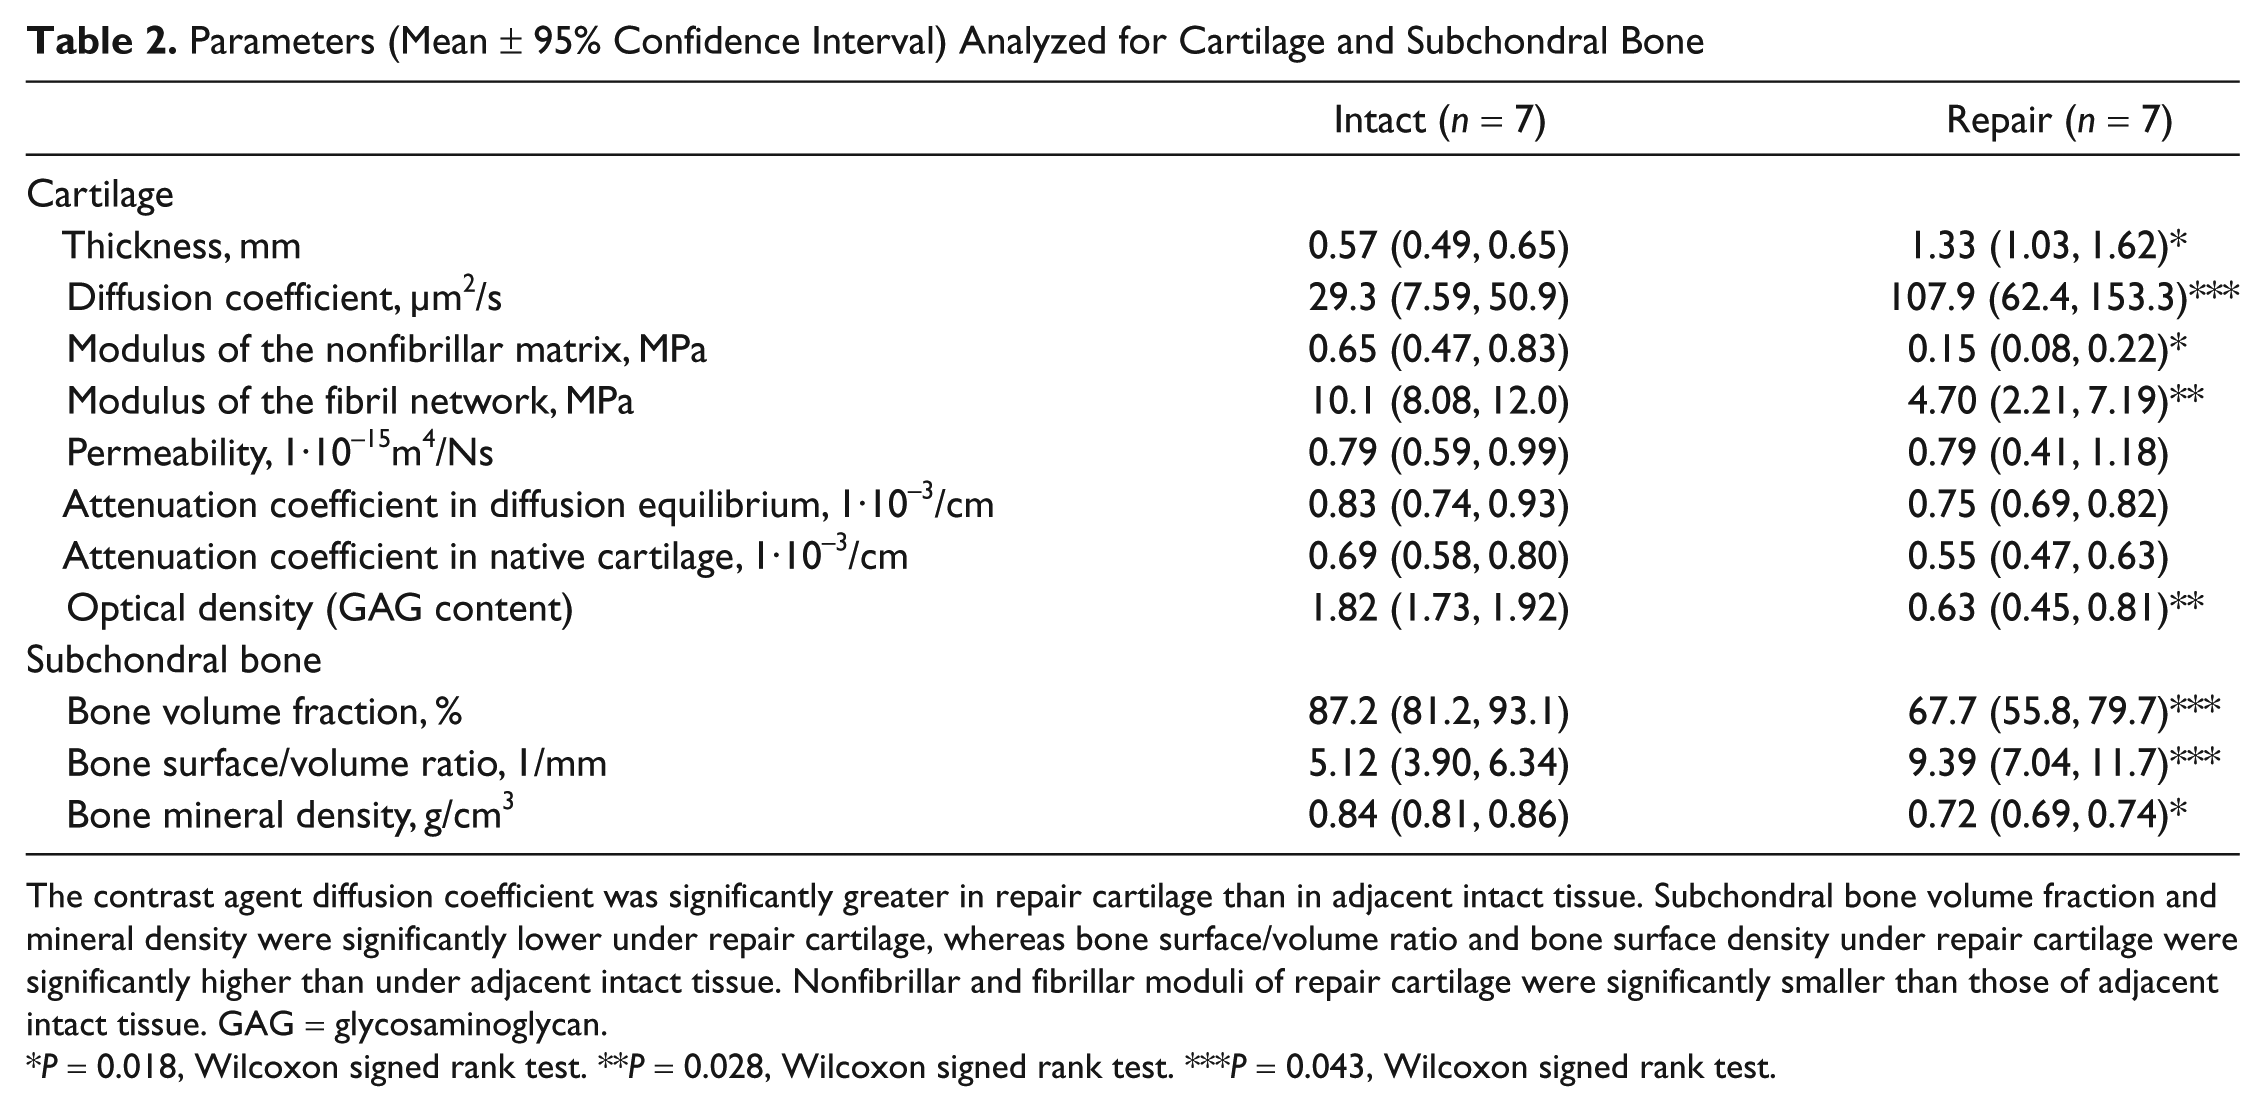
The contrast agent diffusion coefficient was significantly greater in repair cartilage than in adjacent intact tissue. Subchondral bone volume fraction and mineral density were significantly lower under repair cartilage, whereas bone surface/volume ratio and bone surface density under repair cartilage were significantly higher than under adjacent intact tissue. Nonfibrillar and fibrillar moduli of repair cartilage were significantly smaller than those of adjacent intact tissue. GAG = glycosaminoglycan.
P = 0.018, Wilcoxon signed rank test. **P = 0.028, Wilcoxon signed rank test. ***P = 0.043, Wilcoxon signed rank test.
MicroCECT Imaging
Prior to the microCECT measurements, the side of the sample was covered using plastic foil to restrict the contrast agent diffusion across the sides of the osteochondral sample. First, the samples were imaged without contrast agent (10 mM ioxaglate, physiological osmolality [measured using a freezing point depression osmometer]; Hexabrix, Mallinckrodt, St. Louis, MO) exposure using a microCT instrument (SkyScan-1172; SkyScan, Kontich, Belgium). Acquisition of a 3D image stack of one sample with voxel size of 29.8 × 29.8 × 29.8 µm3 required 16 minutes 23 seconds. The x-ray tube voltage was 100 kV. Samples were continuously imaged after immersion into the contrast agent for 2.5 hours and then at the following time points: 3, 4, 5, 6, 7, 8, 9, 10, 11, 12, 24, 26, 28, 30, 32, 34, and 36 hours ( Table 1 ). To prevent degradation of samples, the contrast agent solutions were supplemented with inhibitors of metalloproteinases, 5 mM EDTA disodium salt (VWR International), and 5 mM benzamidine hydrochloride (Sigma-Aldrich). The ambient temperature in the microCT specimen chamber rose from 23.0 ± 0.5 °C (0 h) to 27.7 ± 0.5 °C (36 hours) (mean ± SD) during the measurements.
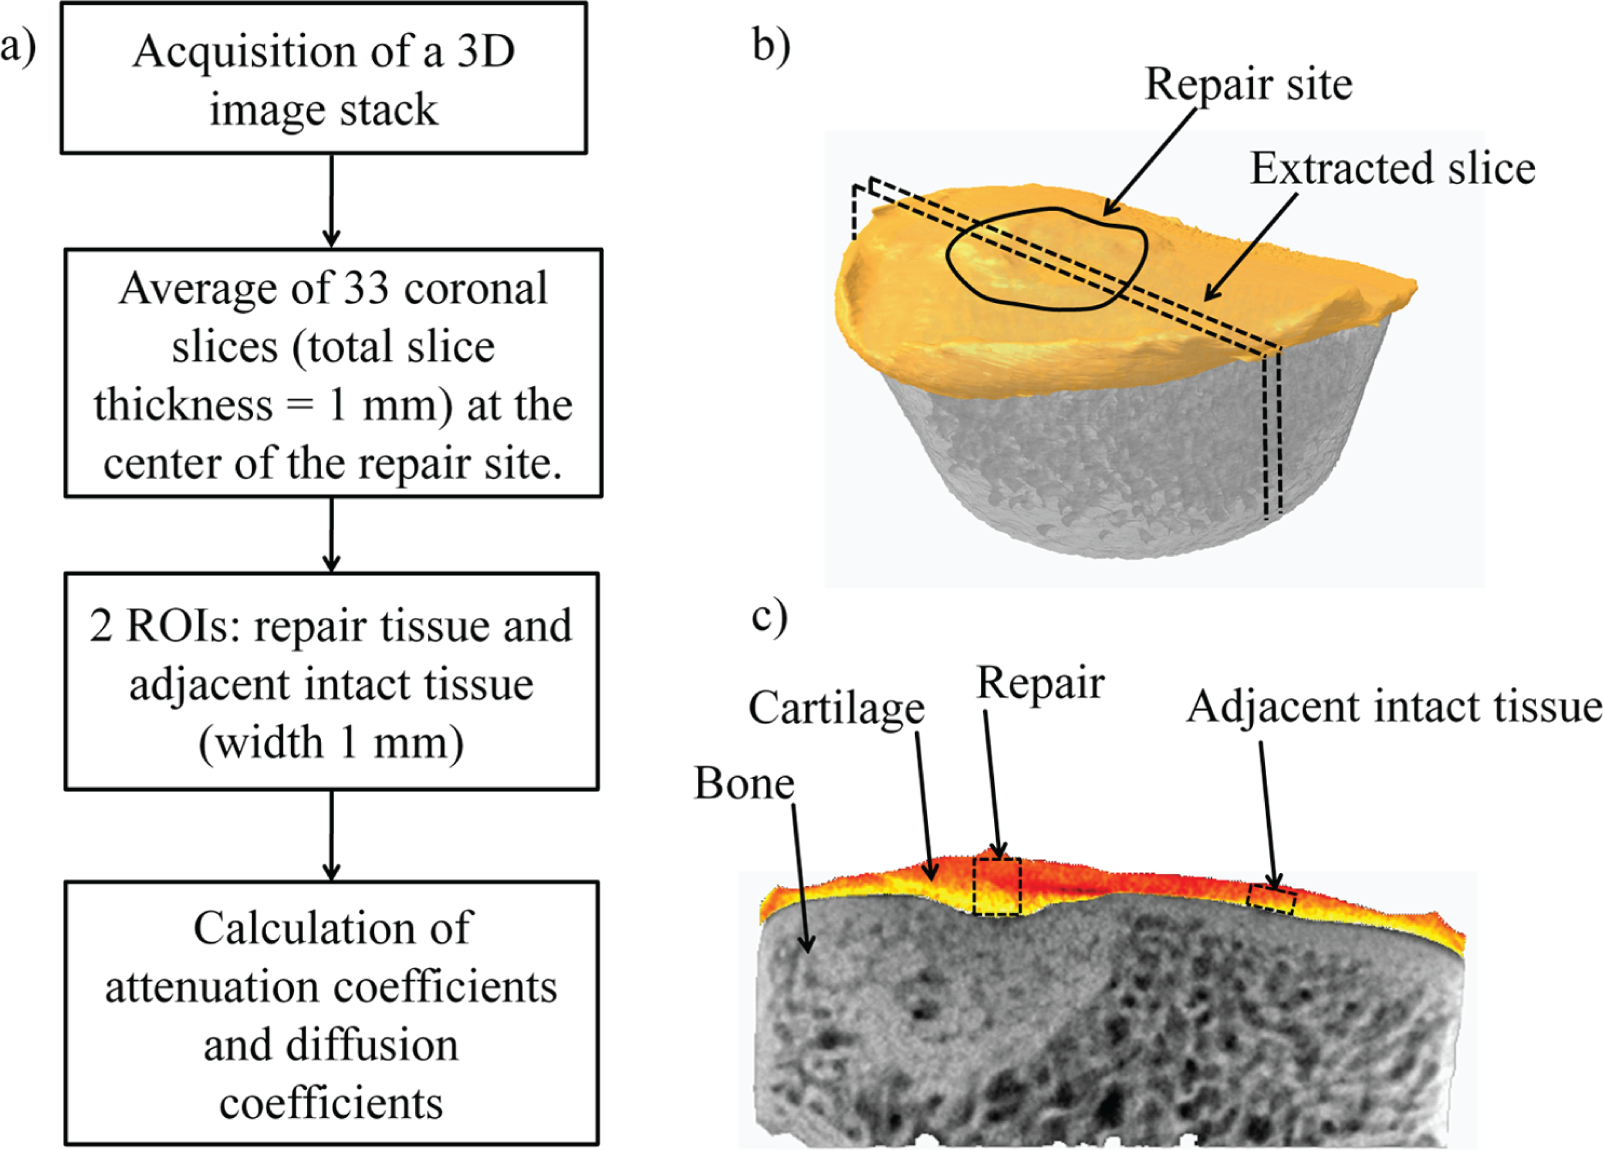
For further analysis, a 1-mm-thick coronal slice at the middle of the lesion was extracted ( Fig. 2 ). Linear attenuation coefficient was measured for two regions of interests (ROIs; height = cartilage thickness, width = 1 mm): one in the middle of the repaired cartilage site and another in the adjacent intact cartilage ( Fig. 2 ). Based on average values of the linear attenuation coefficient at each time point, contrast agent diffusion coefficients were estimated using a protocol described earlier. 24 Analysis was conducted with the CT Analyser (version 1.10.1.0; SkyScan) and Matlab (R2007b; The MathWorks, Inc.) software.
(
For the analysis of the subchondral bone, 2 cylindrical (Ø = 3 mm, height = 2 mm) ROIs were selected immediately below the repair and adjacent intact tissue. A global threshold technique was applied when segmenting bone from other tissues before determination of the structural parameters and mineral density of the subchondral bone. 38 The parameters determined using the CT Analyser software included bone volume fraction (bone volume [BV]/tissue volume [TV], %), bone surface/volume ratio (BS/BV, 1/mm), and bone mineral density (BMD, g/cm3).
Polarized Light Microscopy and Digital Densitometry
After the microCECT imaging, 2 cartilage samples were prepared for histological analyses from each sample plug: one from the middle of the repair site and the other from the adjacent intact tissue area. The samples were fixed in 10% formalin for 48 hours. After decalcification with 10% EDTA and 4% formaldehyde in 0.1 mol/L sodium phosphate buffer (pH 7.4) and paraffin embedding, 3-µm-thick and 7-µm-thick microscopy sections were prepared. Polarized light microscopy (PLM) measurements were conducted for unstained 7-µm-thick sections using a Leitz Ortholux BK II POL microscope (Leitz Wetzlar, Wetzlar, Germany). The average orientation of the collagen fibrils and parallelism index (PI) in each image pixel were determined using a protocol described in our earlier study. 39 The orientation angle is defined as the angle between the articular surface and the long axis of a fibril. PI characterizes the degree of collagen fibril structural anisotropy/parallelism. The highest PI indicates a structure where collagen fibrils are oriented in the same direction, whereas the lowest PI indicates randomly organized collagen fibrils. Altogether, 3 parallel sections per sample were analyzed and averaged. The orientation angles and PIs were determined in 20 equally thick layers within each sample to achieve depth-wise information on the structure of the collagen network.
Digital densitometry of 3-µm-thick, Safranin O–stained sections was used in the determination of GAG distribution in cartilage samples.40,41 A CCD-camera (CH250; Photometrics, Tucson, AZ) was used for the measurements. Three parallel sections for each cartilage sample were analyzed and averaged.
Statistical Analysis
A Wilcoxon signed rank test was applied for comparing the differences between the parameter values determined for the repair tissue and the adjacent intact tissue. Furthermore, Spearman’s correlation coefficients (R) were determined between the material parameters and microCECT parameters. The statistical tests were performed with SPSS software (version 14.0; SPSS, Inc., an IBM Company, Chicago, IL).
Results
The contrast agent diffusion coefficient was significantly higher (P = 0.043) in the repair cartilage than in the adjacent intact tissue ( Table 2 ). However, the attenuation coefficients measured for the native cartilage and for samples immersed in contrast agent showed no significant differences between the repair and adjacent intact tissue at any time point. BV/TV and BMD under the repair cartilage were significantly smaller than under the adjacent intact tissue (P = 0.043 and P = 0.018, respectively). Furthermore, BS/BV under the repair cartilage was significantly greater than under the adjacent intact tissue (P = 0.043).
The contrast agent diffusion coefficient correlated significantly with the modulus of the nonfibrillar matrix (R = −0.662, P = 0.010) and PI (R = −0.588, P = 0.035). However, the attenuation coefficient in the native cartilage or at diffusion equilibrium showed no significant correlations with structural, compositional, or mechanical parameters ( Table 3 ).
Values of Linear Correlation Coefficients (R) for Measured Parameters
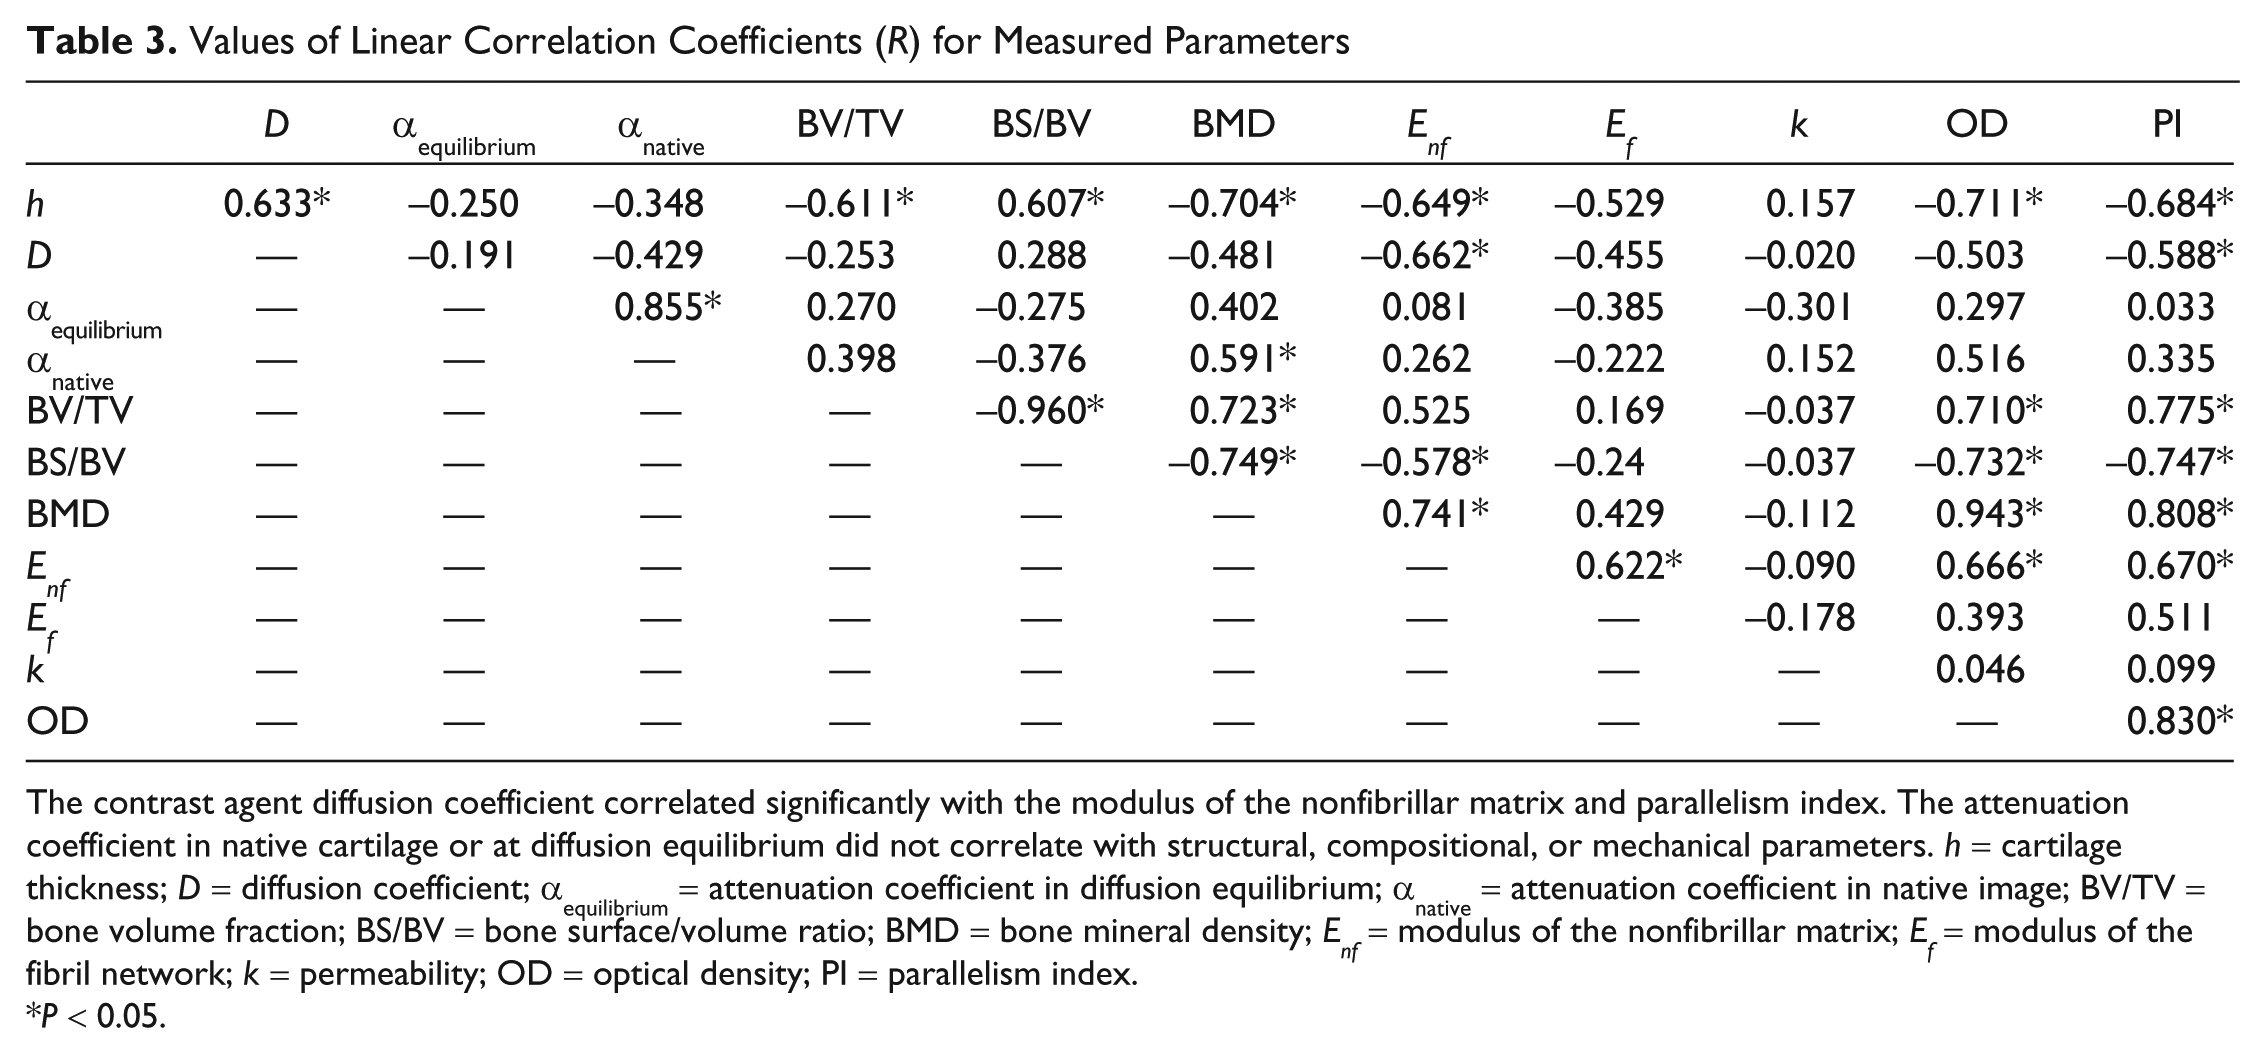
The contrast agent diffusion coefficient correlated significantly with the modulus of the nonfibrillar matrix and parallelism index. The attenuation coefficient in native cartilage or at diffusion equilibrium did not correlate with structural, compositional, or mechanical parameters. h = cartilage thickness; D = diffusion coefficient; αequilibrium = attenuation coefficient in diffusion equilibrium; αnative = attenuation coefficient in native image; BV/TV = bone volume fraction; BS/BV = bone surface/volume ratio; BMD = bone mineral density; E nf = modulus of the nonfibrillar matrix; E f = modulus of the fibril network; k = permeability; OD = optical density; PI = parallelism index.
P < 0.05.
The repair cartilage was mechanically and structurally inferior. Moduli of the nonfibrillar matrix and the fibril network of the repair cartilage were significantly smaller than those of the adjacent intact tissue (P = 0.018 and P = 0.028, respectively) ( Table 2 ). There were significant (P < 0.05) depth-dependent differences in collagen fibril orientation and parallelism ( Figs. 3 and 4 ) between the repair and adjacent intact tissue. Furthermore, the optical density of the Safranin O–stained sections, describing the GAG content of the tissue, was significantly (P = 0.018) lower in the repair cartilage than in the adjacent intact tissue ( Table 2 ; Figs. 3 and 4 ).
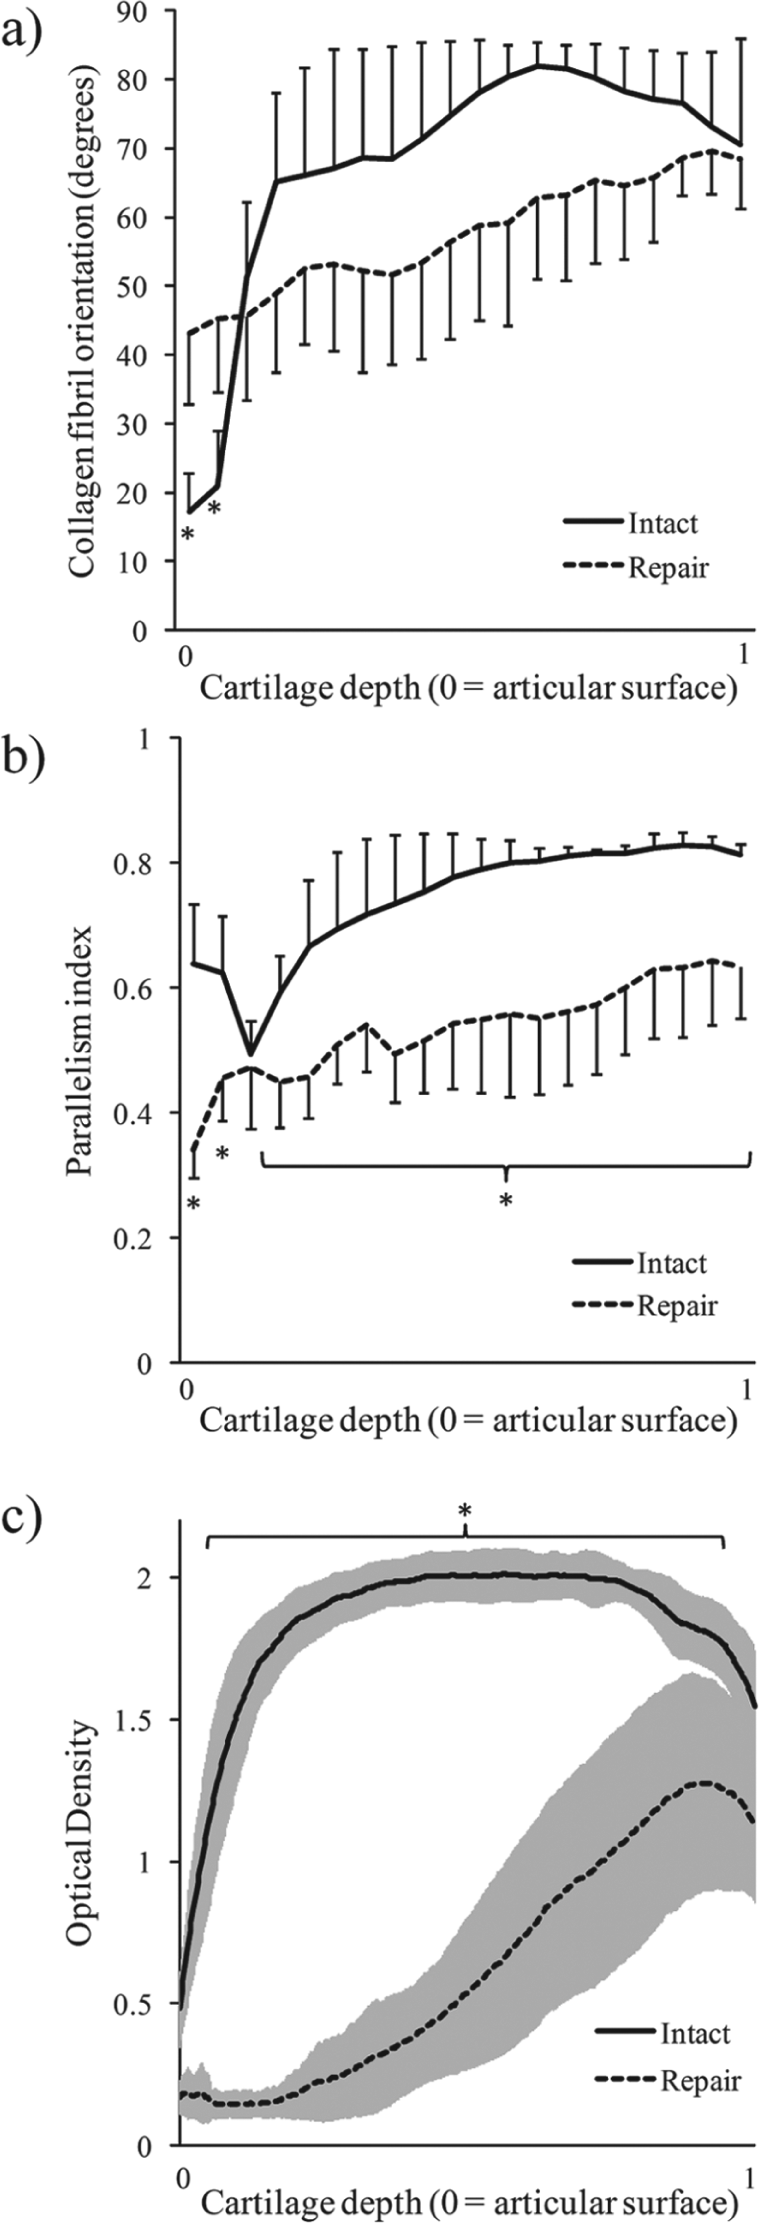
Orientation angle and parallelism index of collagen fibrils and optical density (indicating spatial glycosaminoglycan content) (mean ± 95% confidence interval) of intact and repair cartilage as a function of cartilage depth. (
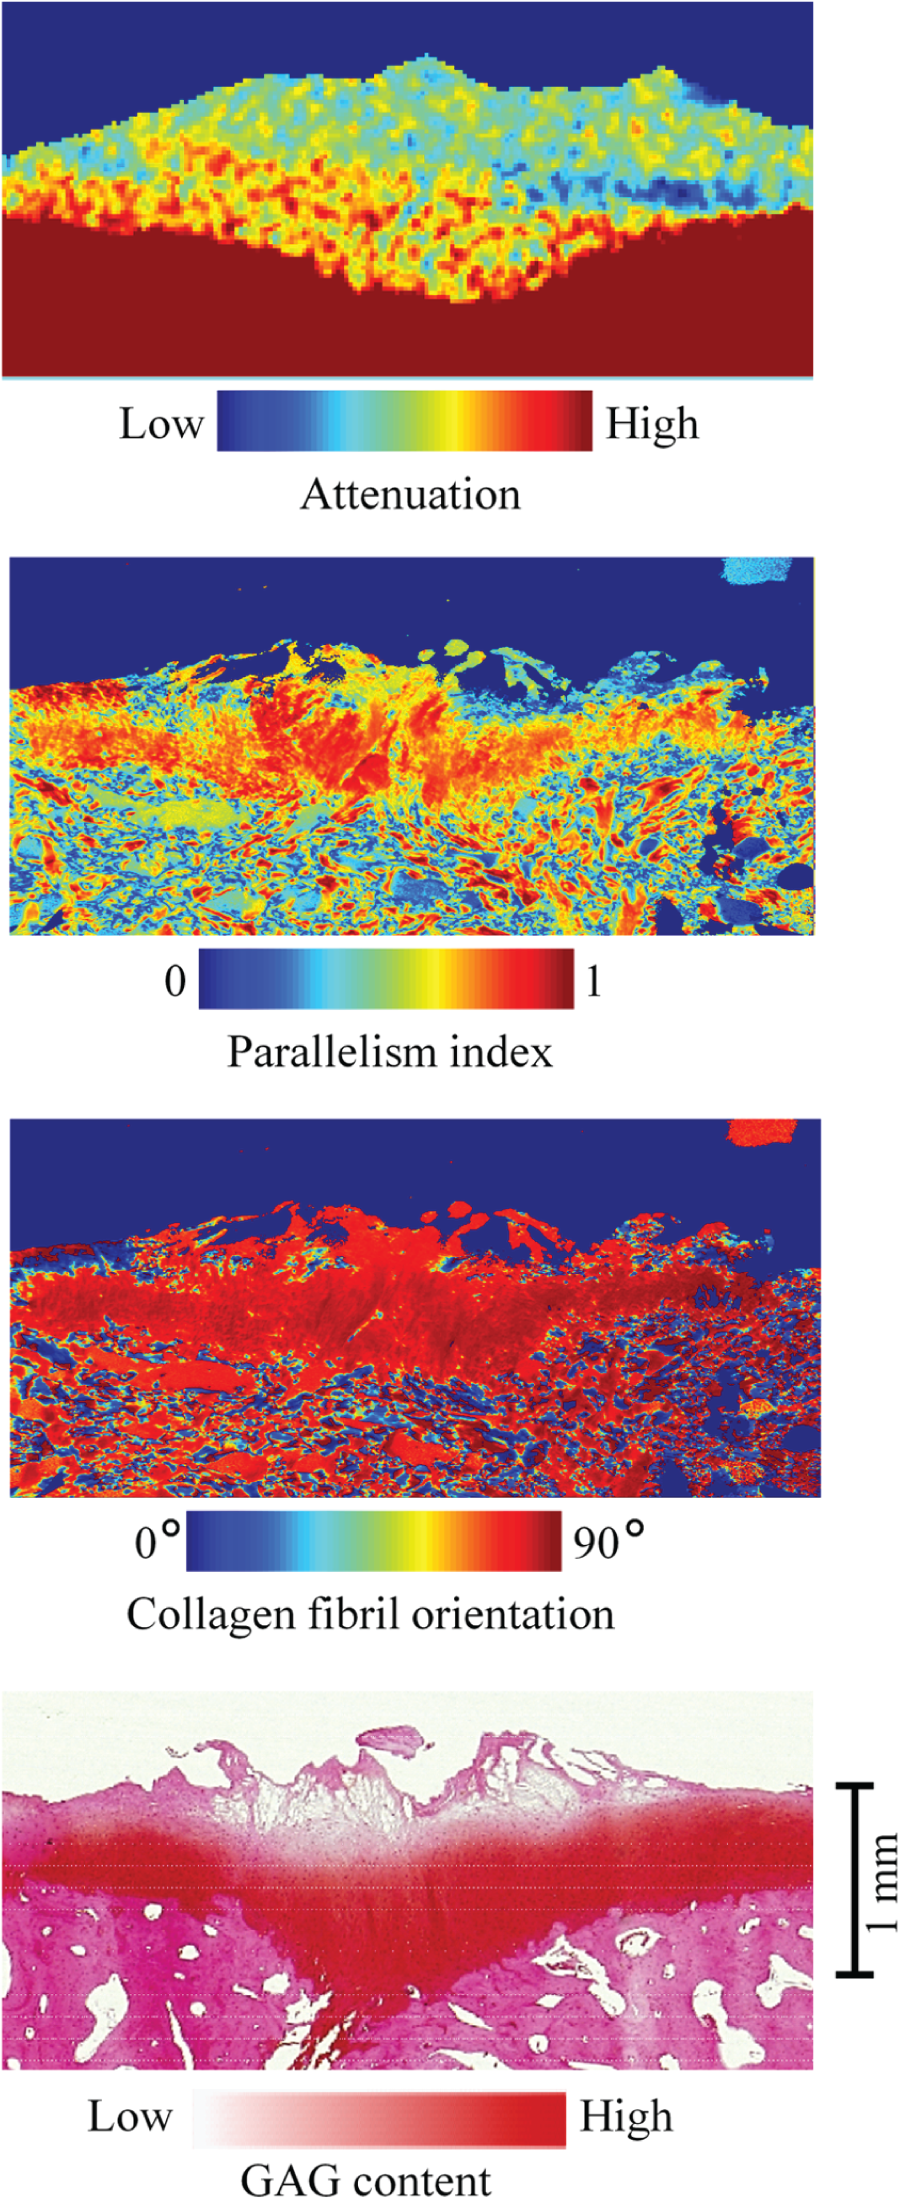
Micro–computed tomography (MicroCT) image (at 2 hours), parallelism index, collagen orientation, and Safranin O–stained section of cartilage at a representative repair site. High contrast and resolution in the microCT image allows accurate delineation of the cartilage from the bone. Abnormal structure of the collagen network in repair tissue is revealed by the parallelism index and the collagen fibril orientation. A superficial layer of collagen fibrils parallel to the articular surface is not present in the repair site. The surface of the repair cartilage is fissured, and glycosaminoglycan (GAG) content is decreased in the superficial tissue.
Discussion
In this study, for the first time to our knowledge, the ability of microCECT to distinguish between spontaneously healed cartilage defects and intact cartilage was investigated ex vivo in an animal model. Furthermore, the biomechanical properties of cartilage were determined using the creep indentation protocol and FEA. Finally, the subchondral bone microstructure was assessed from the microCT images, and the organization of the collagen fibril network and GAG distribution were determined histologically.
Based on microCECT imaging, spontaneously healed tissue could be quantitatively discerned from the adjacent intact tissue. Importantly, the technique allowed simultaneous evaluation of contrast agent diffusion dynamics, cartilage thickness, and subchondral bone microstructure and mineral density. The contrast agent diffusion coefficient showed a significant difference between the repair and adjacent intact tissue. It was higher in the repair tissue than in the adjacent intact tissue, indicating that the diffusion equilibrium was reached faster in the repair tissue. This may be due to the lower GAG content in the repair tissue.28,42 However, the structure and orientation of the collagen network have also been suggested to affect the diffusion of solutes within the cartilage matrix.43,44 In the present work, the structure of the collagen network of the repair cartilage was found to be abnormal: based on the present PLM findings, the collagen fibrils were not tangentially oriented at the superficial layer of the repair tissue. This could partially explain the present findings since the integrity of the superficial cartilage has been speculated to significantly affect the contrast agent diffusion dynamics. 26
The subchondral bone under the repair site included both repair tissue and remodeled bone underneath. However, the region of interest extended only to the repair area. Lower BMD in the subchondral bone underneath the repair cartilage may partly be due to the new mechanical environment of the bone, which affects the healing and remodeling response of bone after an osteochondral injury. 45 Furthermore, reduction in the bone volume fraction and BS/BV are signs of the subchondral reaction, also visually detectable in the microCT images. These findings are in line with earlier studies in goats and pigs.46-48
X-ray attenuation coefficients determined for the repair cartilage and adjacent intact tissue did not show significant differences at any time point. This was surprising since previous studies17,19,49 imply that contrast agent intake should be higher in tissue with lower GAG content. This apparent contradiction could be explained by the possibility that other constituents in addition to the GAGs (e.g., collagen) affect the diffusion and the distribution of contrast agent in the cartilage.24,26,27 Thus, the present microCECT findings may partially be explained by differences in the structure of the collagen network in repair and intact tissues. This is consistent with a recent study 50 in which the influence of enzymatic degradation of collagen and proteoglycans was evaluated by contrast-enhanced MRI. Not only proteoglycan loss but also the alterations in the collagen network were reported to influence the accumulation of the contrast agent in cartilage. In this study, the abnormally organized collagen network could hinder the penetration of the contrast agent molecules into the repair tissue. Possibly for this reason, the contrast agent in the repair cartilage with lower GAG content showed similar x-ray attenuation values as in the adjacent intact tissue.
The modulus of the nonfibrillar matrix was smaller in the repair tissue than in the adjacent intact cartilage. This finding is supported by the optical density measurements showing that GAG content, known to primarily control the modulus of the nonfibrillar matrix, 37 was lower in the repair cartilage than in the adjacent intact tissue. Furthermore, the modulus of the fibril network was smaller in the repair tissue. This may be explained by the abnormal orientation and organization of the collagen fibril network in spontaneously repaired cartilage.
Despite the differences in GAG content, there was no difference in the hydraulic permeability between repair and intact tissue. This is interesting since a decrease in tissue GAG content is usually linked to an increase in permeability.37,51 However, significant differences in the organization of the collagen network can have a significant independent effect on tissue hydraulic permeability.37,52 It has been suggested that the permeability would be higher along the collagen fibril direction than in the direction perpendicular to the fibrils. 52 Since the fluid flows mainly in a horizontal direction in indentation testing, the reduction in permeability in the repair tissue due to the random organization of fibrils in the superficial tissue may compensate the other structural and compositional changes (GAG content) that result in an increase in permeability. Furthermore, permeability of cartilage has been suggested to be strain dependent 53 (i.e., to decrease as a function of compressive strain). Since the creep protocol created larger strains for the softer repair cartilage than for the intact tissue, it may have reduced the permeability of the repair tissue.
Since cartilage and subchondral bone can be considered a functional unit, imaging of cartilage defects or cartilage repair should also focus on the subchondral bone.34,54 Currently, MRI is considered the most sensitive imaging method for the evaluation of cartilage and subchondral bone. 34 Depending on the MRI technique in question, it is possible to detect edema or cysts in the subchondral bone, but direct evaluation of the microstructure or BMD is not possible. 34 In contrast, computed tomography provides direct information on subchondral BMD, and peripheral computed tomography devices, having spatial resolution up to 100 µm, enable imaging resolution sufficient for quantitative evaluation of bone microstructure.
In conclusion, microCECT could distinguish quantitatively between repair tissue and adjacent intact tissue. If successfully developed for in vivo use, CECT with simultaneous acquisition of quantitative information on the properties of cartilage and subchondral bone could be clinically valuable. Currently, no clinical imaging technique simultaneously provides direct information on contrast agent diffusion dynamics in cartilage, cartilage thickness, and subchondral bone microstructure and mineral density.
Footnotes
Acknowledgments and Funding
We thank Mr. Alpi Linjama for conducting the biomechanical measurements. This work was supported by the Sigrid Jusélius Foundation, Finnish Cultural Foundation North Savo Regional Fund, Kuopio University Hospital (EVO 5041715), the strategic funding of the University of Eastern Finland, and Foundation for Advanced Technology of Eastern Finland. CSC–IT Center for Science is acknowledged for providing computing services.
Declaration of Conflicting Interests
The author(s) declared no potential conflicts of interests with respect to the authorship and/or publication of this article.
Ethical Approval
This study was approved by our institutional review board.