
Abstract
Objective:
The main goal of this study was to compare the secretion products derived from human articular chondrocytes established in either long-term monolayer cultures or in scaffold-free 3-dimensional (3-D) cultures.
Methods:
Stable isotope labeling of amino acids in cell culture (SILAC) was applied to investigate quantitatively the differences between proteins secreted from dedifferentiated and redifferentiated chondrocytes. Proteins in cell supernatants were resolved by 1-D gel electrophoresis and analyzed by mass spectrometry. The results from the proteomic analyses were validated by immunoblotting. Additionally, antibody arrays were used to screen culture supernatants for 79 different morphogens.
Results:
Quantitative SILAC showed that some relevant growth factors such as CTGF or GAS6 were elevated in monolayers, along with proteins characteristic of a dedifferentiated phenotype such as collagen type I and tenascin. In spheroids, data showed overexpression of some cartilage-specific proteins such as aggrecan, together with important matrix regulators such as chitinase-3–like protein and stromelysin-1. Antibody arrays revealed that chondrocytes in monolayer secrete higher levels of leukocyte-activating agents such as MCP-1 and GRO, whereas the spheroid configuration favors the production of cell morphogens such as MCSF and VEGF.
Conclusion:
Our results show that some classic dedifferentiation and redifferentiation markers are differentially expressed in 2-D or 3-D culture configurations. Other cell/matrix regulatory molecules are also found to be differentially expressed by chondrocytes in 2-D and 3-D conditions by SILAC and antibody arrays. Our data bring new information for understanding the biology of chondrocytes in general and the process of cartilage tissue reconstruction in particular.
Introduction
Some of the strategies currently used in the clinics for the restoration of cartilage defects and some of the approaches used for engineering cartilage tissue require an initial ex vivo expansion of tissue cells. During the expansion phase, the cells dedifferentiate and gradually shift to a more fibroblastic phenotype, featured by a change in the synthesis of matrix constituents.1,2 Generally, the dedifferentiation process is characterized by a downregulation of cartilage-specific proteoglycans and other cartilage structural proteins such as collagen type II. Concomitantly, the synthesis of matrix proteins characteristic of more fibrous tissues such as collagen type I is induced. Dedifferentiated cartilage cells (chondrocytes) expanded in monolayers (MLs) are able to achieve a certain degree of redifferentiation and upregulate the synthesis of cartilage matrix molecules when placed in 3-dimensional (3-D) structures. Our laboratory has recently demonstrated the redifferentiation capacity of adult chondrocytes cultured for several weeks in ML by combining 3-D spheroid configuration and low oxygen environments. 3 Despite the existence of standard markers as tools for classifying the differentiation status of chondrocytes, at the molecular level, little is known about the progress triggering and guiding dedifferentiation and redifferentiation of adult chondrocytes during ex vivo manipulation. Some efforts have been directed towards the identification of differentially expressed genes in chondrocytes established in ML and 3-D constructs by microarray technologies.4,5 These studies have documented that articular chondrocytes undergo fundamental changes regarding chondrocyte metabolism, growth, and differentiation during cell expansion and 3-D assembly of dedifferentiated cells.
Tissue remodeling is orchestrated, at least in part, by autocrine and paracrine factors released by cells during tissue formation. Thus, the study of secreted proteins represents a rich source of information to understand tissue development and may help to discover candidate molecules that added exogenously would speed up the process and might improve the quality of newly formed tissue. One concern associated with most of the previous secretomic studies was the intricacy to distinguish between chondrocyte-produced proteins and contaminant proteins diffused from plasma, synovial fluid, or even serum elements imported from earlier culture phases. Stable isotope labeling of amino acids in cell culture (SILAC) followed by gel chromatography and mass spectrometry (MS) analysis represents a straightforward, accurate, and promising method to explore comparative expression proteomics in cell culture. This methodology, described by Shao-En Ong et al., enables the identification of functional expression of proteins by administration to the culture medium of nonradioactive isotope-labeled essential amino acids (13C6 arginine and 13C6 lysine) that are incorporated into all newly synthesized proteins.6-8
In this study, we have explored the patterns of soluble proteins expressed by cartilage cells while cultured in ML or in scaffold-free 3-D structures. The data generated represent a good source of information for improving our understanding about chondrocyte physiology in general and more precisely to increase our knowledge on how new cartilage tissue formation is orchestrated.
Materials and Methods
Patient Data and Human Material
All experiments were performed with human articular chondrocytes obtained from surplus cells from patients undergoing autologous chondrocyte implantation (ACI). Chondrocytes were obtained from 3 different patients of similar characteristics regarding joint trauma, cartilage conditions, and age (2 males and 1 female; 45, 48, and 39 years old, respectively), and cell cultures were treated identically throughout all the experimental parts. The patients participated with informed consent, and the Regional Ethical Committee at the University of Tromsø approved the study. Initial biopsies were mainly taken from non-weightbearing areas where macroscopically normal cartilage could be obtained.
Isolation and Culturing of Human Articular Chondrocytes
Cartilage biopsies were kept in 0.9% NaCl for approximately 2 hours and then cut in 1 to 1.5 mm3 pieces. They were kept for 18 hours in 2 to 5 mL Dublecco’s Modified Eagle’s Medium (DMEM)/Ham’s F-12 (Cat. no. T 481-50, BioChrom Labs, Terre Haute, IN) containing collagenase (Cat. no. C-9407, Sigma-Aldrich, Norway AS, Oslo, Norway) at a final concentration of 0.8 mg/mL. The enzyme solution was removed after centrifugation at 200g and by consecutive washing steps with DMEM/Ham’s F-12. Thereafter, the pellet was resuspended in fresh growth medium (DMEM/Ham’s F-12 supplemented with 10% human autologous serum). Cultures were further expanded by trypsinization (Cat. no. T-3924, Sigma-Aldrich), after repeated washing, and resuspended in DMEM/Ham’s F-12 supplemented with 10% human serum from the same patient.
Chondrocytes were grown during 3 to 4 weeks in autologous serum to meet the requirements for ACI treatment (approximately 6-8 population doublings). After the second surgery, surplus cells used for experimentation were collected and maintained in DMEM medium supplemented with heat-inactivated fetal calf serum (Sigma-Aldrich) for a few days until initiation of the experiments. Before the start of the metabolic labeling, cultures were extensively washed with PBS to eliminate most serum remnants and incubated from that time point in SILAC serum-free medium.
Preparation of Conditioned Medium for SILAC
DMEM and amino acids were from the SILAC Protein Identification and Quantitation Kit purchased from Invitrogen (Cat. no. SM10002, Carlsbad, CA). Basal medium was supplemented with ascorbic acid, L-glutamine, dexamethasone, antibiotics, and ITS supplement (Cat. no. I3146-5ML, Sigma-Aldrich). Amino acids [U-13C6] L-arginine and [U-13C6] L-lysine were added to the medium as described in the protocol for the kit. After initial cell expansion, 2 × 10⁶ chondrocytes were seeded in T-175 cell culture flasks. Culture medium was originally supplemented with 10% serum to promote cell adherence during the first 24 hours. After cell attachment, cultures were extensively washed with basal DMEM medium, and thereafter, cells were incubated in 12 mL of [U-13C6] L-arginine and [U-13C6] L-lysine culture medium. Supernatants were removed after 5 days and replaced by new labeled medium. The new supernatants were conditioned during an additional 5 days and collected for analyses ( Fig. 1A ). The cell number was checked both in ML and spheroids at the end of the experiment by trypsinization and collagenase digestion, respectively. Numbers always ranged between 1.5 and 2 × 10⁶. Later in the text, labeled cultures refer to cells maintained in special serum-free medium containing heavy amino acids (13C6 isotopes), whereas non-labeled cultures refer to cells maintained in serum-free media with regular amino acids (12C6 isotopes). Labeled and non-labeled cultures had been run in parallel and handled in the same way ( Fig. 1 ).
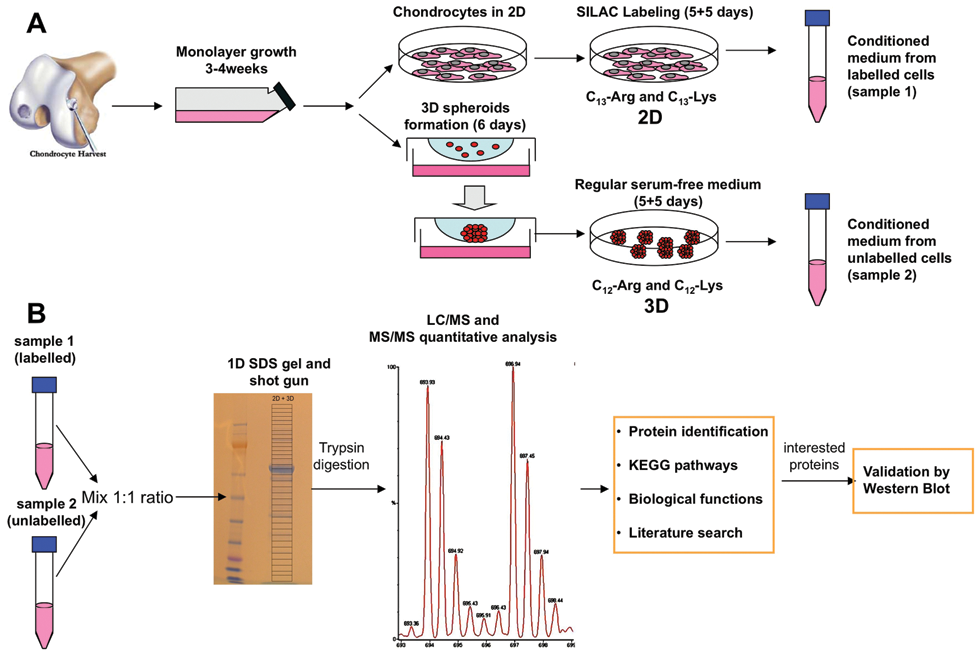
Schematic diagram showing the experimental strategy used in our study. (
3-D Spheroid Formation by Hanging Drop Methodology
Establishment of 3-D cultures by hanging drops was performed as described before in serum-free medium.3,9 Briefly, drops of 400 µL containing 20,000 cells per drop were dispensed into each well of a 96-well plate (Nunc, Roskilde, Denmark) forming a meniscus, and the plate was inverted. Viability of cells at all different time points was monitored by trypan blue exclusion assay. Assembling of chondrocytes was allowed during 5 to 7 days in serum-free medium with regular amino acids. When microtissue formation was completed, spheroids were washed and transferred to SILAC medium. Five days after initiation of the metabolic labeling, the cultures were washed, and the medium was renewed ( Fig. 1A ).
Preparation of Protein Samples and 1-D Gel Electrophoresis
Upon cell culture, 6 mL supernatants were collected from both MLs and spheroids and sterile-filtered to eliminate potential cell debris and particulate material from fluids. Subsequently, the supernatants were concentrated by ultrafiltration (membrane cut-off of 3 kDa, Vivascience, Aubagne, France) at 4500 rpm for 45 minutes, until a final volume of 200 to 500 µL was obtained. Protein quantification was performed for each concentrated supernatant using the Bradford protein assay.
Subsequently, for quantitative analysis, the supernatants from labeled and nonlabeled cultures were mixed together in a 1:1 ratio regarding the protein concentration, solubilized in sample buffer (NuPAGE, Invitrogen) and sample-reducing agent (NuPAGE, Invitrogen), and loaded to the gel (NuPAGE Novex Bis-Tris 4%-12%, Invitrogen). The electrophoresis was performed using XCell SureLock mini-Cell system (Invitrogen). Run conditions were constant voltage of 200 V, current of 100 to 125 mA/gel (start) and 60 to 80 mA/gel (end) in 50 minutes until the dye reached the bottom of the gel. For qualitative analysis, collected and concentrated supernatants from labeled MLs and spheroids were solubilized in sample buffer and sample-reducing agent and loaded into gel for 1-D electrophoresis ( Fig. 1B ).
Gel Fractionation (Shotgun), Trypsin Digestion, and MS
Following electrophoresis, gels were fixed, washed 3 times for 5 minutes in milliQ-water (Millipore, Billerica, MA) under constant shaking, incubated in Coomassie blue for 1 hour, and washed in milliQ-water until optimal contrast of stained bands was obtained. Afterwards, gels were processed by a shotgun approach, 8 and around 15 gel sections were incised from each column. Gel pieces were subjected to in-gel reduction, alkylation, and tryptic digestion using 2 to 10 ng/µL trypsin (V511A, Promega, Madison, WI). 10 Peptide mixtures containing 0.1% formic acid were loaded onto a nanoAcquity Ultra Performance LC (Waters, Milford, MA), containing a 3-µm Symmetry C18 Trap column (180 µm × 22 mm) (Waters) in front of a 1.7-µm Atlantis C18 analytical column (100 µm × 100 mm) (Waters). Peptides were separated with a gradient of 5% to 95% acetonitrile, 0.1% formic acid, with a flow of 0.4 µL/min eluted to a Q-TOF Ultima Global mass spectrometer (Micromass/Waters) and subjected to data-dependent tandem MS analysis. Peak lists were generated by the ProteinLynx Global server software (version 2.1, Waters). The resulting pkl files were searched against the Swiss-Prot 55.5 protein sequence databases using an in-house Mascot server (Matrix Sciences, London, UK). Peptide mass tolerances used in the search were 100 ppm, and fragment mass tolerance was 0.1 Da. Proteins identified in Mascot-containing peptides with bold red peptides containing the Label:13C(6) (K) or 13C(6) (R) were identified as secreted from the chondrocytes. Proteins identified in Mascot with bold red lysine- or arginine-containing peptides were classified as not chondrocyte secreted or newly synthesized ( Fig. 1B ).
Quantitative Proteomic Analyses
Because of isotope labeling, the peptides including labels are heavier than nonlabeled ones. Results of MS analysis reveal a pair of labeled and nonlabeled peaks for each trypsinized peptide present in both labeled and nonlabeled samples. For quantitative analyses, when there was no variance in the intensity of the peak pair, it was an indication of no differences in the abundance of compared proteins. On the contrary, when peak intensity from heavy peptide was higher than peak intensity from light peptide, it was an indication that the protein containing labeled peptide was more abundant.6,8 For quantification, peak lists were produced by Masslynx software version 4.0 (Waters). The peak lists were searched with the Mascot search engine as above. Identified proteins were quantified and validated by the MSQuant open source software (http://msquant.sourceforge.net/). Only proteins with a score higher than 60 and individual peptide scores more than 25 were quantified. The quality of quantifications was further validated by manual inspection of spectra. The MSQuant software was also used to determine efficiency of labeling of proteins. This was done with extracts not mixed with nonlabeled extract. Proteins with less than 75% incorporation and/or too low Mascot score (http://www.matrixscience.com/) were not used for quantification. For 3-D labeled groups, a ratio higher than 0.5 had to be observed in order to assign an upregulated protein. A ratio of 0.25 was the mean in the experiment because of contaminant proteins. For the experiment where proteins from ML were labeled, a ratio of more than 5 was used to assign an upregulated protein. A ratio of 2 was the mean in these experiments. Complete inverse ratios were not observed because of the different amounts of “contaminant” proteins in the different groups. Because of this, only very differently expressed proteins were selected in our study, where “0.2 ratio” indicates 5-fold downregulation, compared to “5 ratio,” which indicates 5-fold upregulation. The 3-D labeling and 3-D/2-D experiment generated 2 datasets for mass spectroscopy. In some cases, the proteins detected in the 3-D/2-D datasets were not detected with good enough confidence in the 3-D labeling dataset. In these cases, fold upregulation was calculated based on one dataset.
Protein Microarray
A commercial antibody-based protein microarray designed to detect 79 growth factors, cytokines, or chemokines was purchased from RayBiotech (RayBio Human Cytokine Array V, Norcross, GA). Experiments were performed as recommended by the manufacturer. Briefly, array membranes were incubated for 30 minutes in 2 mL blocking buffer, further incubated for 90 minutes with 1 mL of the secretion medium of chondrocytes, and washed. A cocktail of 79 biotinylated antibodies diluted 1:250 was added for 90 minutes at 1 mL per array membrane. Membranes were washed, and sandwiched antigens were detected after incubation overnight with 2 mL of 1,000-fold diluted HPR-conjugated streptavidin solution. Protein antigens were detected by enhanced chemiluminescence reaction, and the signals were captured on x-ray films. 11
Western Blotting
Supernatants were solubilized in sample buffer (NuPAGE, Invitrogen) and sample-reducing agent (NuPAGE, Invitrogen), and about 30 µg of total protein was loaded to the gel (NuPAGE Novex Bis-Tris 4%-12%, Invitrogen). The SDS-PAGE electrophoresis was performed using XCell SureLock Mini-Cell system (Invitrogen). Subsequent to electrophoresis, the proteins were transferred to polyvinylidene difluoride (PVDF) membranes with pore size of 0.2 µm (Invitrogen). Western blotting was performed using primary antibodies recognizing human SPARC, metalloproteinase inhibitor 1, osteomodulin, chitinase-3–like protein 2, aggrecan, stromelysin-1 (all from Abcam, Cambridge, UK), growth arrest–specific protein 6 (Tebu-bio, Le Perray-en-Yvelines, France), and connective tissue growth factor (Abnova, Taipei City, Taiwan). The membranes were blocked with 3% dried milk in 10 mM Tris-HCl, pH 7.4, 0.15 M NaCl, and 0.2% Tween, and incubated with the primary antibodies at a 1:1,000 dilution followed by a secondary antibody conjugated to horseradish peroxidase (1:5,000 dilution). Bound antibody was detected by chemiluminescence. 12
Results
Qualitative Analyses of Protein Expression in Secretion Media of Chondrocytes during 2-D and 3-D Culture
Metabolic labeling of newly produced proteins was allowed for 10 days by cells cultured in either 2-D or 3-D environments. A total of 93 proteins were consistently identified in the supernatants of chondrocyte ML from the 3 individuals included in the study, whereas in spheroids, the number of identified proteins was reduced to 62. The cell cultures from all 3 patients were treated identically throughout all the experimental parts. Qualitatively, the data showed only minor variations among the different individuals. In supernatants from ML, over 95% of proteins incorporated 13C-arg and 13C-lys, whereas in spheroids, the proportion of nonlabeled or weakly labeled proteins was approximately 20% of all identified proteins ( Fig. 2 C and D ). Most of the nonlabeled proteins found in the media corresponded to plasma-related proteins stemming from the serum used in early stages of cell expansion. In 3-D conditions, some of the nonlabeled proteins corresponded to chondrocyte-derived components originating from the pre-SILAC period. All labeled (newly produced) proteins found in the supernatants were categorized by their functionality, and the 2 conditions were compared ( Fig. 2 E and F ). Qualitative comparison of the 2 groups show that a larger number of extracellular matrix components were released into the media during ML growth (50% v. 36%); however, chondrocytes in 3-D expressed a lower number of matrix catabolic agents (10% v. 9%), higher number of matrix anabolic agents (5% v. 11%), and higher number of anti-inflammatory and antioxidant proteins (13% v. 24%).
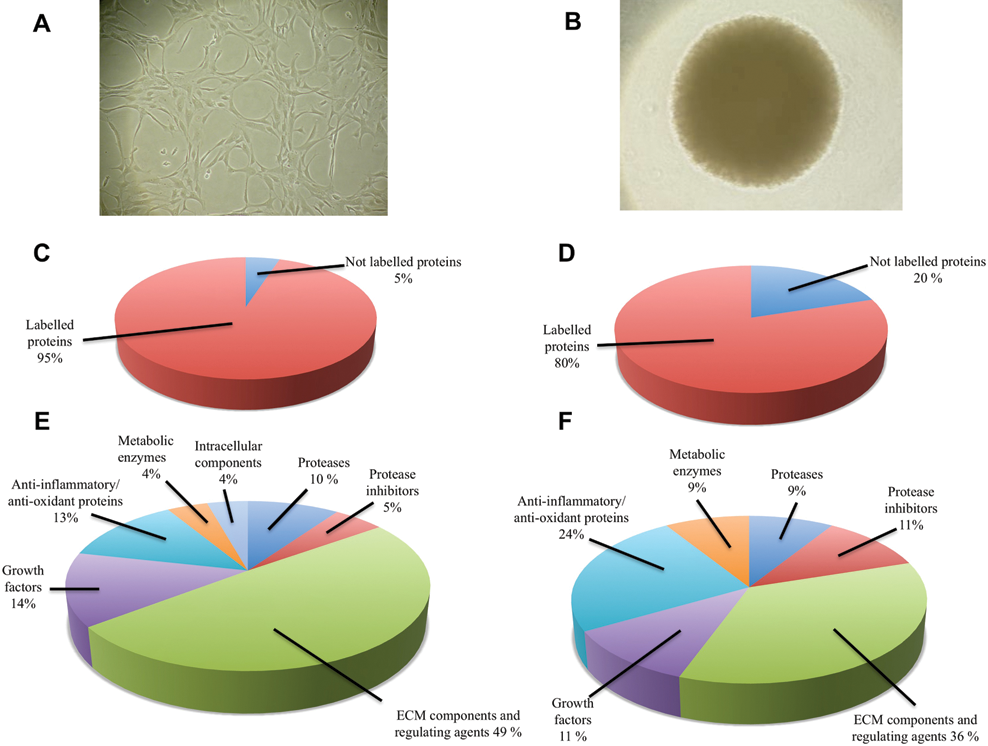
Qualitative analyses of proteins identified in culture media. (
Comparative Measurements of Proteins Found in Secretion Media of Chondrocytes Cultured in MLs and Spheroids
Initially, the pattern of released proteins in the spent medium of chondrocyte cultures from each different patient was determined using both normal medium and medium containing heavy amino acids (data not shown). Qualitatively, the data showed only minor variations among the different individuals, and only proteins found in all 3 patients have been considered for comparative analyses in our study.
The analyses of mixed supernatants for quantitative measurements were done with one of the patients because of the complication inherent to the data generation and analyses. For quantification, labeled samples needed to be mixed with nonlabeled samples in a 1:1 ratio regarding the protein concentration prior to gel chromatography ( Fig. 1 ).
Proteins secreted by chondrocytes in ML showed over 95% incorporation by 13C6 Arg and 13C6 Lys. However, labeling of proteins secreted by chondrocytes in spheroids was more variable. The mean labeling was 80%. Proteins with very low metabolic labeling were considered for the qualitative analyses but not included for the quantitative measurements. To verify quantification by MS-Quant, the percentage of incorporation was checked for each individual protein using the MSQuant software. Initial experiments were already showing that chondrocytes in 2-D and 3-D had a different rate of metabolic labeling of proteins, being considerably lower for chondrocytes in 3-D. Additionally, early on, we could notice that although the spectrum of proteins found in either 2-D or 3-D conditions was relatively similar, the relative abundance of individual proteins was quite different between conditions.
When supernatants were mixed before SDS-PAGE, the protein concentration was determined and used to mix equal amounts of proteins. Unfortunately, the amounts of “contaminant,” nonlabeled, or weakly labeled proteins were different between 2-D and 3-D, obscuring the “real” 1:1 total ratio of secreted proteins. That is why parallel experiments were performed by labeling the groups also in reverse. Comparison of the proteins with around 90% amino acid incorporation in spheroids showed that the 1:1 ratio of these proteins was approximately 4:1 in favor of proteins in ML (0.25 ratio). The real mixing rate for the experiment with 3-D labeled proteins seemed to be 2:1 in favor of ML proteins. After comparison, Table 1 shows that 7 proteins were unambiguously upregulated in ML and 6 proteins were upregulated in 3-D spheroids.
Quantitative Comparison of Proteins Secreted by Dedifferentiated (Monolayers) and Redifferentiated (3-D Spheroids) Human Articular Chondrocytes
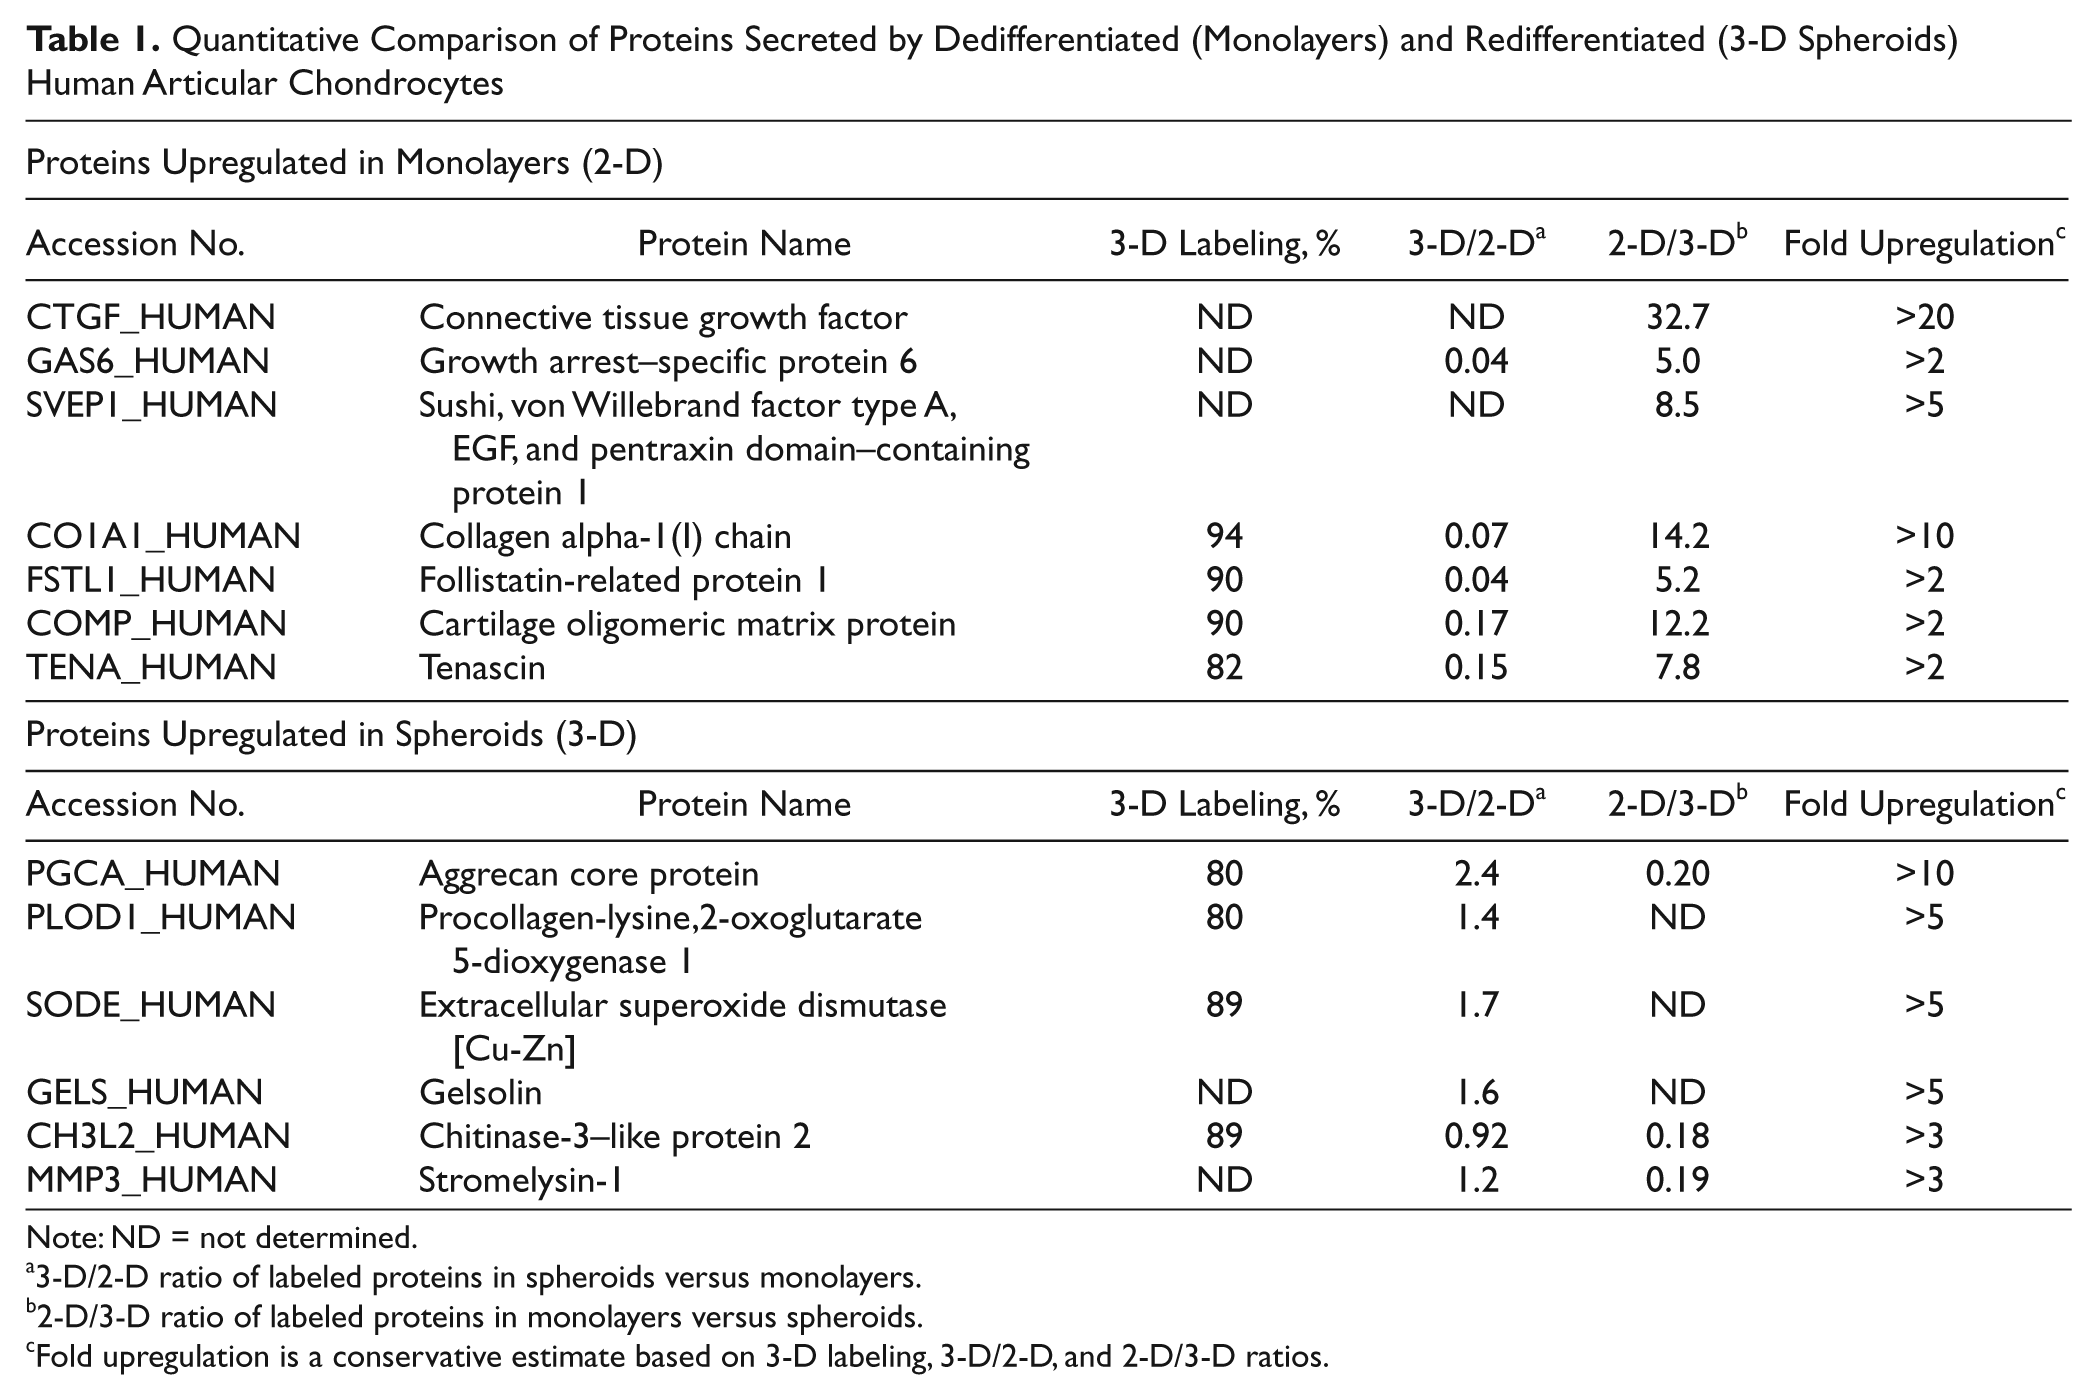
Note: ND = not determined.
3-D/2-D ratio of labeled proteins in spheroids versus monolayers.
2-D/3-D ratio of labeled proteins in monolayers versus spheroids.
Fold upregulation is a conservative estimate based on 3-D labeling, 3-D/2-D, and 2-D/3-D ratios.
Validation of MS Analysis by Immunoblotting
Validation of the MS analyses was done by specific immunodetection of 8 relevant proteins ( Fig. 3 ). Two of the selected proteins for validation analyses were similarly expressed in both conditions corresponding to SPARC and tissue inhibitor of metalloproteinase 1 (TIMP1). Among the differently expressed proteins, osteomodulin (OMD), growth arrest–specific protein 6 (GAS6), and connective tissue growth factor (CTGF) were upregulated in ML and weakly expressed or not found in spheroid supernatants. On the opposite end, aggrecan, CHI3L2 (chitinase-3–like protein 2), and stromelysin-1 (MMP3) were upregulated in spheroids and less expressed in ML. The results obtained by Western blots with all proteins tested confirmed accurately the original findings obtained by quantitative SILAC analyses. The size of the bands revealed in the Western blots corresponded to the expected size of the full-length proteins. Additionally, the intensity of the bands after immunoreaction matched up with the Mascot scores in the proteomic analysis.
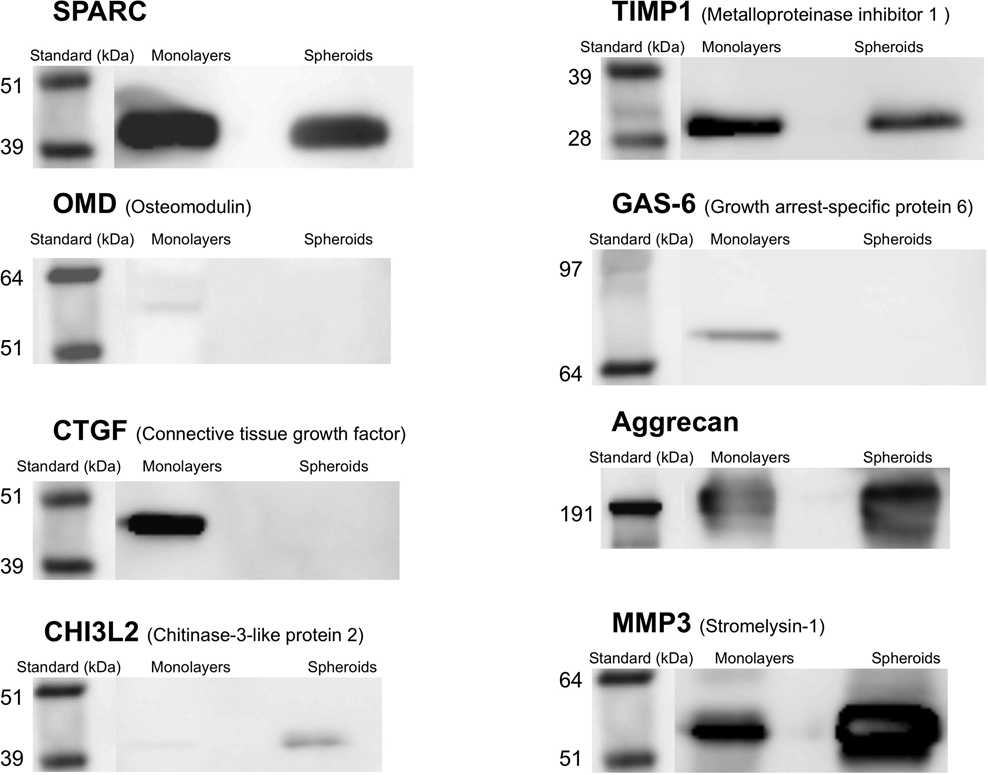
Verification of the protein expression by Western blot. Immunodetection of 8 relevant proteins including some overexpressed in monolayers (OMD, GAS6, CTGF), some overexpressed in spheroids (aggrecan, CHI3L2, MMP3), and some equally expressed in both conditions (SPARC, TIMP1) performed on the same conditioned media used for mixed MS analyses. Molecular weight markers are shown at the left side of each gel. Bands appearing at the predicted molecular weight of each individual protein are shown.
Protein Array Analysis of Supernatants from Chondrocytes Established in ML Cultures and 3-D Spheroids
To ascertain if some relevant cytokines or growth factors, expressed under the detection limit of the SILAC approach, could also be differentially expressed in 2-D and 3-D conditions, our MS analyses were complemented with the use of protein microarrays. Membrane arrays prepared for the detection of 79 different cytokines, growth factors, or hormones were exposed to concentrated culture supernatants from chondrocytes derived from 3 different individuals, which were established in either MLs or 3-D spheroids. Because this approach does not need metabolic labeling of proteins, only conditioned medium generated from nonlabeled cultures was used.
A large number of dots were unambiguously identified after 1-minute exposure of membranes to x-ray films ( Fig. 4A ). Comprehensive location maps for the membranes were prepared by a gray-scale code following the different intensities of the dots obtained after the reaction ( Fig. 4B ). It should be noted that the relative intensities of spots in each array may not reflect necessarily the relative amounts of proteins revealed after each reaction because the affinity of proteins for their respective antibodies may differ substantially. However, this technique allows an accurate comparison between the different experimental groups. The protein microarray results showed similar patterns of proteins produced by chondrocytes established in MLs and 3-D spheroids. However, the intensity of some of the dots in the arrays was significantly different between the 2 experimental groups. Monolayer growth showed enhanced production of growth-related oncogene protein (GRO), monocyte chemoattractant protein-1 (MCP-1), IL- 8, angiogenin, and insulin-like growth factor binding protein-2 (IGFBP-2). After redifferentiation of chondrocytes in spheroids, the arrays showed overexpression of CKb 8-1, macrophage colony–stimulating factor (MCSF), and vascular endothelial growth factor (VEGF) when compared to chondrocytes in MLs.
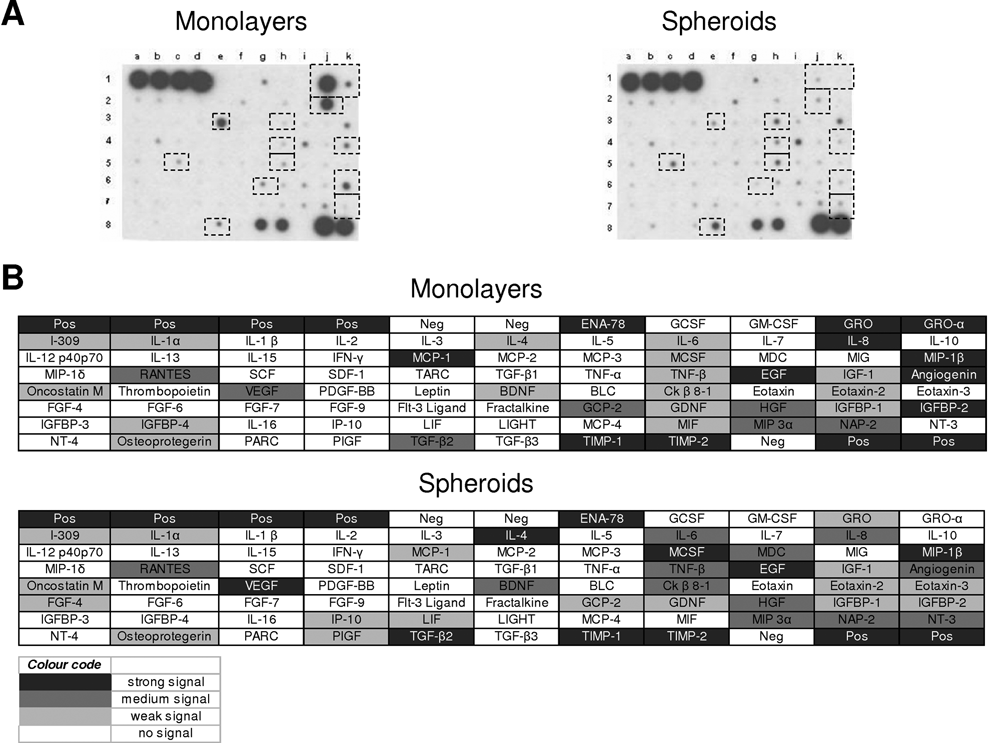
Analysis of cytokine expression in culture media. Human-specific cytokine antibody microarray membranes (RayBio Human Cytokine Array V) were probed with culture media from monolayers and spheroids. (
Discussion
In this study, we have explored the differences encountered in the spectrum of proteins released by chondrocytes during dedifferentiation and redifferentiation by using last-generation proteomic approaches, considering that these data may have important implications with respect to the clinical use of cell-based therapies for the regeneration of cartilage defects. Our data reflect significant changes undergone by chondrocytes upon redifferentiation, and we also present a number of proteins, including some cell morphogens, identified for the first time in the spent medium of chondrocytes.
The genotypic and phenotypic transformation experimented by chondrocytes during cartilage reconstruction or during cell redifferentiation is still poorly investigated. In a recent study from our laboratory, we have described the redifferentiation of adult chondrocytes upon culturing a small number of cells in scaffold-free 3-D spheroids by hanging drops. 3 The process of cell redifferentiation in this experimental model was comparable to the one observed by using the standard pellet culture system. 4 In this study, we have also used the hanging drop model to explore the differences in the secretome of chondrocytes in 2-D and 3-D configurations. Our MS analyses clearly reveal the presence of dedifferentiation markers in the supernatants of ML such as collagen type I and tenascin, whereas the expression of cartilage signature molecules such as aggrecan was elevated in spheroids.
In general, a longer list of proteins was detected in the supernatants of chondrocytes established in ML, along with a higher degree of protein labeling. This observation is most likely a direct consequence of the culture configuration. Chondrocytes in ML present a more extended phenotype; basically, all cells are more exposed to the medium than cells in spheroids, and the lack of tissue structure during ML growth favors that newly produced proteins are directly released into the culture medium. On the opposite end, cells in 3-D configuration slow down their proliferation, and the cells allocated in internal layers of the construct are being less exposed to the medium. Additionally, since there is an active synthesis of new matrix during 3-D growth, many of the newly produced proteins are directly incorporated into the developing matrix and not or only partly released to the culture media.
Redifferentiation of articular chondrocytes cultured in 3-D aggregates has been studied by gene expression microarray analyses. 4 Interestingly, some of the relevant genes that were found to be upregulated and downregulated during cell redifferentiation are in accordance with the results that we have obtained after analyzing the secretome at the protein level. Thus, molecules such as tenascin or COMP were overexpressed in less differentiated phenotypes, whereas other factors such as ECM component aggrecan and other important matrix regulators like chitinase-3–like protein 2 (Chi3L2) and stromelysin-1 (MMP3) were augmented in matured spheroids, indicating the transition from proliferation to tissue formation during 3-D growth. The function of chitinase-3–like proteins is still not completely understood in the context of cartilage pathophysiology, although it has been suggested that these proteins are important mediators of cartilage reformation by controlling the growth of connective tissue cells and regulating their response to inflammatory cytokines. Additionally, Chi3L1 seems to have a positive effect on proliferation and proteoglycan synthesis of normal articular chondrocytes. 13 Chitinase-3–like protein 1 is one of the major secreted proteins of ex vivo cultured human articular chondrocytes, also found in synovial fluids from patients with active rheumatoid arthritis, but downregulated in osteoarthritic chondrocytes.14,15
SVEP1 or Sushi (von Willebrand factor type A, EGF, and pentraxin domain–containing protein 1) was found to be overexpressed by chondrocytes in MLs. Our study is the first one to identify Sushi in the spent media of human articular chondrocytes. SVEP1 is a recently identified protein containing several different structural domains and is involved primarily in cell adhesion processes. The expression of SVEP1 has been demonstrated in vivo in several tissues like bone, periosteum, and bone marrow. In vitro, the protein was found to be expressed by mesenchymal stromal cells but not by cartilage cells. 16 The function of Sushi in the context of cartilage formation remains to be clarified, but it could constitute an important factor regulating cell-cell and cell-matrix interactions during ex vivo growth.
The pattern of growth factors and hormones secreted by articular chondrocytes unveiled by antibody microarrays has been addressed in the past. 11 In our study, we found similar patterns of secreted cytokines, even though certain interpatient differences in the expression were observed. Some factors gave strong immunoreaction on array membranes of both ML and spheroid groups, including epithelial-derived neutrophil-activating peptide ENA-78, macrophage inflammatory proteins MIP-1β, epidermal growth factor EGF, transforming growth factor TGF-β, and tissue inhibitors of metalloproteinases TIMP1 and TIMP 2. Interestingly, some cytokines were differentially expressed in 3-D spheroids and MLs. Monolayer growth had elevated production of growth-regulated oncogene (GRO), monocyte chemoattractant protein-1(MCP-1), IL-8, angiogenin, and insulin-like growth factor binding protein-2 (IGFBP-2). MCP-1 and GRO are primarily involved in leukocyte chemotaxis. Both factors exert proinflammatory reactions, promote oxidative metabolism, and activate matrix degradation. 17 IGFBP-2 increases proteoglycan production by mediating TGF-β effect on proteoglycan synthesis. 18 Enhanced expression of this factor in MLs and not in spheroids could have connections with the high proliferation rate of cells in ML. On the other hand, spheroids showed enhanced expression of vascular endothelial growth factor (VEGF), CKb 8-1, and macrophage colony–stimulating factor (M-CSF). M-CSF induces gene expression and production of connective tissue growth factors (CTGF/CCN2) that are found to be a potent signal to regenerate damaged cartilage by promoting the growth and differentiation of articular chondrocytes. 19 Furthermore, M-CSF directly promotes the proteoglycan synthesis. 20 VEGF is a potent proangiogenic factor. It has an important role in endochondral bone development and could be triggered by the decreasing oxygen gradient generated during formation of 3-D structures. 21 The biological relevance of the differentially expressed proteins identified in this work remains to be explored. In a pilot experiment, we have analyzed the effects of 3 proteins differentially expressed by chondrocytes (GAS6, Chi3L2, and CTGF). Recombinant proteins were added separately to the incubation medium at the time the 3-D culture was initiated. After 1 week, no significant differences were observed regarding size and/or composition of the 3-D structures. Although these observations are still very preliminary and not thoroughly checked, they could indicate that if some effect is to be expected, the factors may need to be added in the right combination.
In conclusion, the combination of SILAC and protein microarray used in this study allowed us the identification of secretion products derived from dedifferentiated and redifferentiated chondrocytes, some of them identified for the first time by proteomics. Our results show some commonality in the spectrum of secreted proteins by chondrocytes in 2-D and 3-D. However, the analyses also reveal important differences between the 2 groups; thus, chondrocytes in MLs acquire a more proinflammatory leukocyte-activating phenotype, while pushing the metabolic functions of the cells towards cell proliferation. On the other hand, chondrocytes in spheroid configuration favor the establishment of a more matrix-producing phenotype, induced by the autocrine activation of pathways that contribute to extracellular matrix synthesis and remodeling, but with limited nutritional and oxygen supply. Although the differentially expressed proteins identified in this study could be considered as potential players in the context of cartilage reconstruction, a more precise definition of their functions remains an open area of investigation.
Footnotes
Acknowledgments and Funding
This project was partially supported by funds from the University of Tromsø (Norway). Financial support from MyJoint project (EU project) and Orthogenics AS (Tromsø, Norway) is gratefully acknowledged. The authors thank the excellent technical assistance of Toril Anne Grønset in running the samples for the MS analyses and Kirsti Rønne in running the Western blots.
Declaration of Conflicting Interests
The authors declared no potential conflicts of interest with respect to the authorship and/or publication of this article.