
Abstract
Objective:
We investigated whether surface smoothness of articular cartilage in the medial tibiofemoral compartment quantified from magnetic resonance imaging (MRI) could be appropriate as a diagnostic marker of osteoarthritis (OA).
Method:
At baseline, 159 community-based subjects aged 21 to 81 with normal or OA-affected knees were recruited to provide a broad range of OA states. Smoothness was quantified using an automatic framework from low-field MRI in the tibial, femoral, and femoral subcompartments. Diagnostic ability of smoothness was evaluated by comparison with conventional OA markers, specifically cartilage volume from MRI, joint space width (JSW) from radiographs, and pain scores.
Results:
A total of 140 subjects concluded the 21-month study. Cartilage smoothness provided diagnostic ability in all compartments (P < 0.0001). The diagnostic smoothness markers performed at least similar to JSW and were superior to volume markers (e.g., the AUC for femoral smoothness of 0.80 was higher than the 0.57 for volume, P < 0.0001, and marginally higher than 0.73 for JSW, P = 0.25). The smoothness markers allowed diagnostic detection of pain presence (P < 0.05) and showed some correlation with pain severity (e.g., r = −0.32). The longitudinal change in smoothness was correlated with cartilage loss (r up to 0.60, P < 0.0001 in all compartments).
Conclusions:
This study demonstrated the potential of cartilage smoothness markers for diagnosis of moderate radiographic OA. Furthermore, correlations between smoothness and pain values and smoothness loss and cartilage loss supported a link to progression of OA. Thereby, smoothness markers may allow detection and monitoring of OA-supplemented currently accepted markers.
Osteoarthritis (OA) is one of the leading causes of pain and chronic disability worldwide due to deteriorating cartilage integrity and loss of articular cartilage, as well as changes in the underlying subchondral bone. 1 Clinically, it would be important to develop a treatment that, if applied at the early stages of the OA, might prevent the disease progressing to painful and disabling stages. A prerequisite for developing such a therapy—the first disease-modifying drug for OA (DMOAD)—is the identification of a mode of action that modifies the structure of cartilage and possibly the underlying bone. Such a drug development program would also require a clinical trial design that monitored disease progression. However, this is problematic as progression of OA in some clinical settings has been absent.2-5 This has initiated a discussion on which clinical phenotypes could allow for progression in clinical settings and whether these subtypes would only respond to one specific type of intervention. Identification of common denominators for OA progression will be important. Several attempts have been made to identify the underlying causes and risk factors for progression in OA, including by the European TREATOA consortium6 and the American Osteoarthritis Initiative.7,8 Body mass index (BMI), subchondral bone turnover, misalignment, and meniscectomy are among the currently accepted risk factors for progression of OA.9,10 However, the variation in these factors has served to spur further discussion on whether OA may indeed be a heterogeneous disease with a common end stage characterized by progressive cartilage loss and joint failure. This poses the question of whether, independent of demographics, quantitative techniques may identify common parameters of cartilage biology and phenotype with a high-risk progression. This would eliminate the need for segregation of patients into individual subtypes of OA. Such quantitative biomarkers may be highly important for clinical trial design. Several frameworks for characterization of biomarkers have been proposed. Recently, the BIPED categorization (Burden of disease, Investigatory, Prognostic, Efficacy of intervention, and Diagnostic) has aided in understanding the individual potential of different markers. 11
The current requirement for acceptance of a DMOAD is to demonstrate efficacy in terms of joint space width (JSW) measured from radiographs and joint function investigated by questionnaires (such as the WOMAC scale 12 ). Selection criteria could typically be based on the Kellgren and Lawrence (KL) score 13 and age (e.g., KL 2 or 3 and age 50-70 years). This poses potential disadvantages. First, as selection currently is based on radiographs, this implies that subtle difference in cartilage pathology may not be accounted for as cartilage is not visible on radiographs. Second, studies may be designed to follow patients at relatively later stages of OA, as inclusion criteria are done by radiograph analysis in which bone sclerosis and osteophytes are evaluated. Since the later stages of OA are quite likely irreversible, 14 new treatments focused at the earlier stages may have a higher chance of preventing progression or even curing the disease. 15 Novel biomarkers may aid in the identification and assessment of interventions in early OA. Some of the central processes during the early stages of OA are illustrated in Figure 1. Healthy cartilage has a smooth lubricated surface (i.e., the superficial layer; Fig. 1A ). The superficial layer is lost in early OA, and the upper articular cartilage layer is exposed, which results in surface irregularities such as deamination, fibrillation, fissures, and erosions ( Fig. 1B ). These irregularities can be detected by arthroscopy but not by radiographs. As OA progresses to later stages, erosions become deep and sclerosis is observed ( Fig. 1C ). It is at this stage that OA can be detected by radiographs as joint space narrowing (JSN).15,16 It would be of high value to be able to measure the early surface irregularities and thereby identify and treat OA at a stage where there is still articular cartilage left.
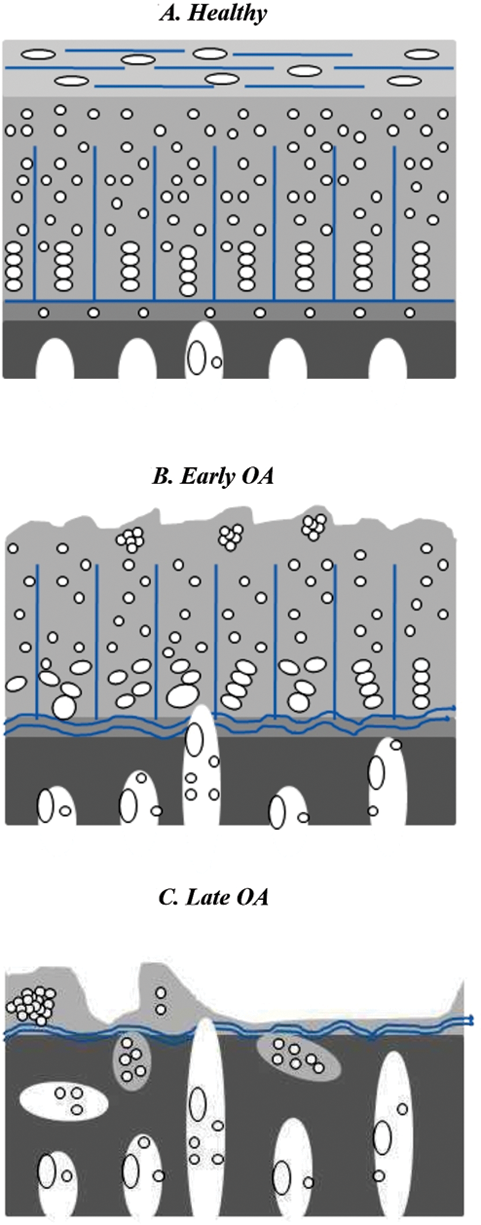
In early osteoarthritis, loss of the interior cartilage structure and loss of cartilage surface integrity occur before cartilage loss, sclerosis of underlying bone, and joint space narrowing.
Radiographs may be well suited for capturing late-stage JSN and the associated bone phenotype. However, magnetic resonance imaging (MRI) allows direct visualization of articular cartilage in 3D. 17 Quantification of cartilage from MRI is required particularly when diagnosing middle-aged patients with medial pain, as radiographs do not show any remarkable changes in JSW. 18 The cartilage volume and thickness are the typical OA markers quantified from MRI. Knee cartilage volume declines at a faster rate with increasing age, as revealed in a longitudinal study.19,20 Mean cartilage thickness change of −0.5% was observed in the medial tibial cartilage in a 1-year longitudinal study using the Osteoarthritis Initiative data. 21 In the present study, we investigated whether quantification of the surface smoothness of articular cartilage may provide candidate markers for clinical studies targeting early OA. Cartilage smoothness was estimated in the medial tibial and femoral knee compartments by a fully automatic computer-based method using MRI scans. The methods estimated the cartilage surface curvature at the smallest, effective spatial scale, implicitly limited by the MRI voxel size. We evaluated the diagnostic ability of cartilage surface smoothness against the status of radiographic OA as assessed by KL score. We investigated the ability of smoothness to separate subjects with pain from those without pain in a cross-sectional manner and correlations between smoothness values and pain scores at follow-up. We compared with efficacy markers; JSN, which is currently accepted as a surrogate marker of joint replacement surgery; and loss of cartilage volume.
Materials and Methods
Study Population
The population of 159 subjects was recruited from the greater Copenhagen area and had even distributions of age, gender, BMI, and varying degrees of OA symptoms at baseline. Subjects with inflammatory arthritis, any contraindication for MRI examination, or previous knee joint replacement were excluded from the study. The range of the interval between baseline and follow-up visits was 15 to 21 months with an average of 18 months.
Image Acquisition
A total of 318 MRI scans of both knees were taken at baseline from the 159 subjects. Five of 318 scans were removed from the study due to insufficient image quality in either MRI or x-ray, which left out 313 scans at baseline for the study. For 37 representative knees, both MRIs and x-rays were reacquired at baseline 1 week later to allow evaluation of scan-rescan precision.
Digital x-rays of both knees were acquired simultaneously in the posterior-anterior position for every subject using SynaFlex from Synarc, and the KL index was determined for each medial tibiofemoral joint. The 3D images of the knee were acquired using an Esaote C-span 0.18T scanner specifically developed for depicting the extremities with a scan time of approximately 10 minutes. The scanner parameters were as follows: 40° flip angle, 50-ms repetition time, and 16-ms echo time. The voxel in-plane resolution was 0.7 × 0.7 mm with slice thickness between 0.7 and 0.94 mm.
Manual and Automatic Cartilage Segmentation
For a subset of 114 scans from the above baseline 313 scans and for all the scans that were rescanned after 1 week, manual segmentations were performed by slice-wise outlining by an expert radiologist. The same radiologist also assessed the KL score and determined the JSW from radiographs. The radiologist had 6 years of experience in reading knee radiographs and MRI prior to the study.
The 3D MRI scans of the tibial and femoral cartilages were segmented using a fully automatic supervised learning technique in which each voxel was assigned a probability of being tibial cartilage or femoral cartilage or background based on prior knowledge using k-nearest-neighbors (kNN) classifiers. 22 The training of the classifier and feature selection used the manual segmentations for 25 representative scans selected from the baseline 313 scans. The selected features for the classifiers were the cartilage position, intensities, and local geometric features based on Gaussian derivatives.
JSW, Volume, and Pain Quantification
JSW was determined in millimeters from radiographs by the expert radiologist as the narrowest gap between the femur and tibia within the medial tibial plateau.
The volume of the binary segmentations (includes tibial-femoral, tibial, femoral, femoral anterior, femoral central, and femoral posterior) was quantified by counting the number of voxels in each segment and the volume of each voxel in mm3. The quantified cartilage volume values were normalized by the width of the knee. The normalized volume is the actual volume multiplied by the ratio of the corresponding tibial bone width cubed to the mean tibial bone widths cubed. The JSN was quantified as the difference in JSW at baseline and follow-up.
Pain value in each knee was recorded at follow-up using a visual analog scale quantifying the knee-related pain level during the last 24 hours in the range 0 to 100 mm.
Smoothness Quantification
Intuitively, a “smooth” cartilage surface is free from irregularities, lesions, and protrusions. We estimated the smoothness of the cartilage as the inverse of the curvature (i.e., the curvature was computed at every location in the segmentation); smoothness then was the inverse of curvature. The mean curvature is the local mean of the minimum and maximum curvatures, and it measures how quickly the curve changes its direction. The smoothness of a compartment was computed as the mean local smoothness over the entire articular cartilage surface facing the synovium (disregarding the surface bone-cartilage interface).
The surface curvatures were quantified from either the manual or automatic cartilage segmentations. Before curvature evaluation, we regularized the cartilage segmentations, represented as binary volumes, to avoid voxellation effects by super-sampling them followed by Gaussian blurring and finally by mean curvature flow. In the level set formulation, the mean curvature flow is described by
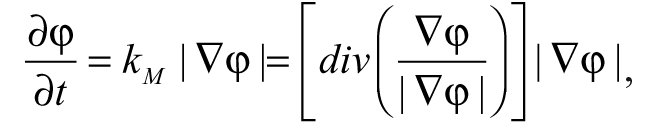
where ∇φ is the gradient of the level set representation φ, and k M is the mean curvature. As the flow progresses, the cartilage surface with higher curvature values moves toward lower curvatures. From the curvature map, the smoothness is then measured in millimeters on the superior and inferior surfaces for the tibial and femoral compartments, respectively. This basic methodology was previously described and evaluated as a diagnostic marker in the tibial compartment.23,24
The key parameters in the automatic curvature quantification methods were super-sampling factor, Gaussian blurring, step size, and the number of iterations in the curvature flow. Most important among these is the number of curvature flow iterations that defines the regularization needed to avoid voxellation effects while still retaining the ability to quantify fine-scale curvature. The performance of the method has been shown to be insensitive to the choice of the number of iterations for a very large parameter interval. For additional details on the choice of parameters, see Tummala and Dam. 25
Cartilage Compartments
We focused the analysis on the medial compartments because OA is typically observed there.26,27 The femoral compartment was divided into anterior, central, and posterior subcompartments. The femoral compartment was divided into subcompartments to examine if the load-bearing and nonload regions of the compartment had different diagnostic ability compared to the whole femoral compartment. The division was based on the anterior-posterior width of the femoral compartment, which was divided into three thirds. The first third was denoted as the posterior femoral subcompartment. The central femoral subcompartment included the area between the first to last third, and the last third was denoted as the anterior femoral subcompartment. The splitting of femoral cartilage into subcompartments was validated to be sensible and robust by visual inspection on several scans, including healthy and diseased. The medial tibiofemoral joint with the tibial compartment and femoral subcompartments is shown in Figure 2 .
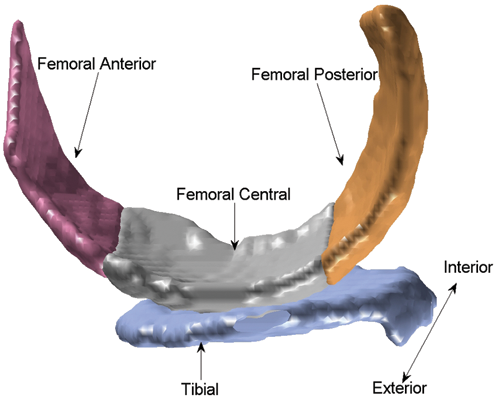
The medial tibiofemoral joint and the cartilage compartments visualized from a sample knee from the study. The compartments (and femoral subcompartments) were automatically segmented by the framework. The “interior” denotes the center of the knee.
Statistical Methods
We evaluated the marker precision by the root mean squared coefficient of variation (RMS CV) on markers quantified on the scan pairs acquired with 1 week in between at baseline.
To avoid assumptions on the distributions of the markers, we evaluated the diagnostic performance using both parametric and nonparametric methods. We evaluated the P value from an unpaired t test (P) between the healthy subjects (defined as KL 0 or 1) and those with radiological OA (KL > 1) and the corresponding required estimated sample size (ESS) derived from power analysis at a significance level of 0.05 and power of 0.8. 28 We further evaluated the diagnostic separation of subpopulations by the area under the receiver operator characteristic curve (AUC). Delong’s nonparametric approach was used to test the statistical significance of AUC values. 29
The responsiveness of the markers was calculated as standardized response means (SRMs). The SRM for the cross-sectional study is calculated as the ratio of change in mean between OA and healthy to the standard deviation of all, whereas for the longitudinal study, SRM was calculated as the ratio of mean change to the standard deviation of change between follow-up and baseline values.
The effect of potential confounders such as age, gender, and BMI on smoothness was evaluated by linear correction if they were significantly associated with the tibiofemoral smoothness values.
The potential appropriateness of an efficacy marker was investigated by the linear correlation coefficient. It was quantified between the change in the smoothness marker and the change in either JSW or cartilage volume. These were computed as follow-up minus baseline scores.
We investigated the associations of JSW, volume, and smoothness markers with pain scores at follow-up in a cross-sectional manner. The ability of these imaging markers to separate the groups with pain and without pain was tested by the same t test used for the diagnostic performance. Furthermore, linear correlations between all marker values and pain scores were computed for the subpopulation with some level of pain.
Finally, the diagnostic performance of the smoothness scores from manual and automatic segmentations was compared using the above statistical analysis, including RMS CV, P, ESS, and AUC.
Results
The study population statistics are given in Table 1 by age, BMI, gender, and distribution across degrees of radiographic OA. Of the 159 subjects, 140 concluded the longitudinal study and contributed 280 scans at follow-up. Three scans were ignored at follow-up due to inadequate image quality in x-ray and 7 due to MRI. The remaining 270 scans were used for the longitudinal study.
Description of the Study Population with knee Count, Listing Minimum-Maximum (Mean) Values of Age, BMI, Gender, and the Distribution across the Degrees of Osteoarthritis Given by the KL Index (0-4)
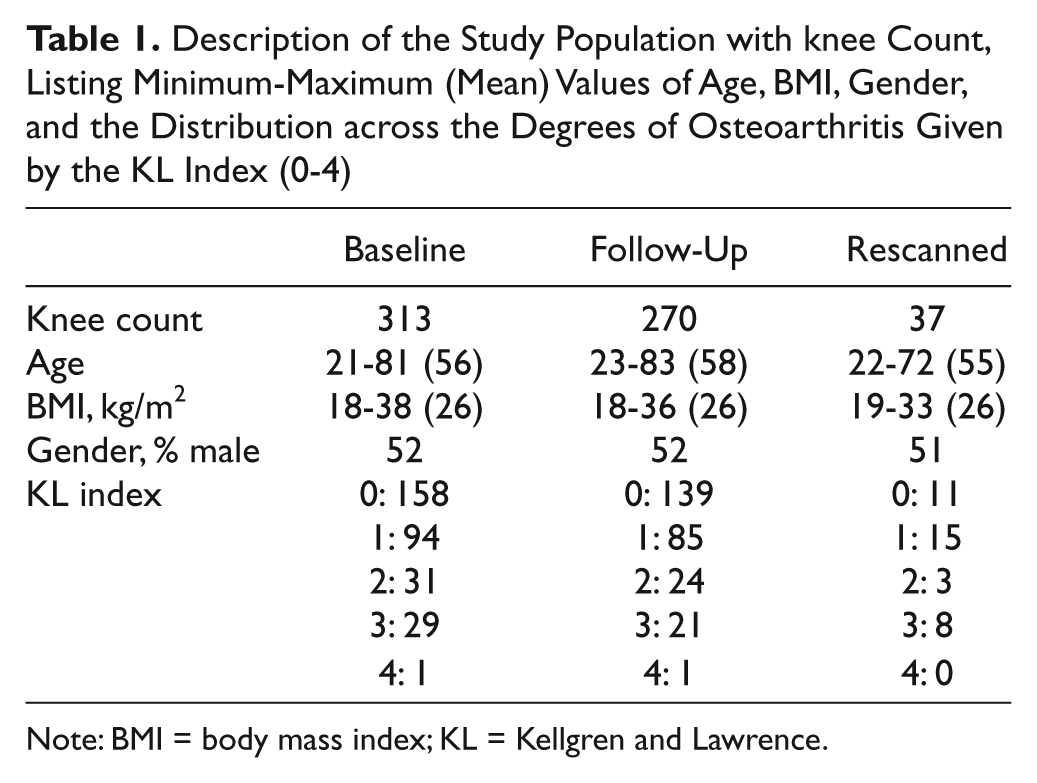
Note: BMI = body mass index; KL = Kellgren and Lawrence.
Both age and BMI were correlated negatively to smoothness at baseline (P < 0.0001), whereas no significant gender differences in smoothness values were found (P > 0.49), for all compartments.
Marker Precision
The precision of each marker (volume, smoothness, and JSW) in each compartment quantified as RMS CV is shown in Table 2 . Smoothness had equal or improved precision compared to volume for all compartments.
RMS CV, Mean, and SD Values for the Markers JSW, Volume, and Smoothness in Each Medial Compartment
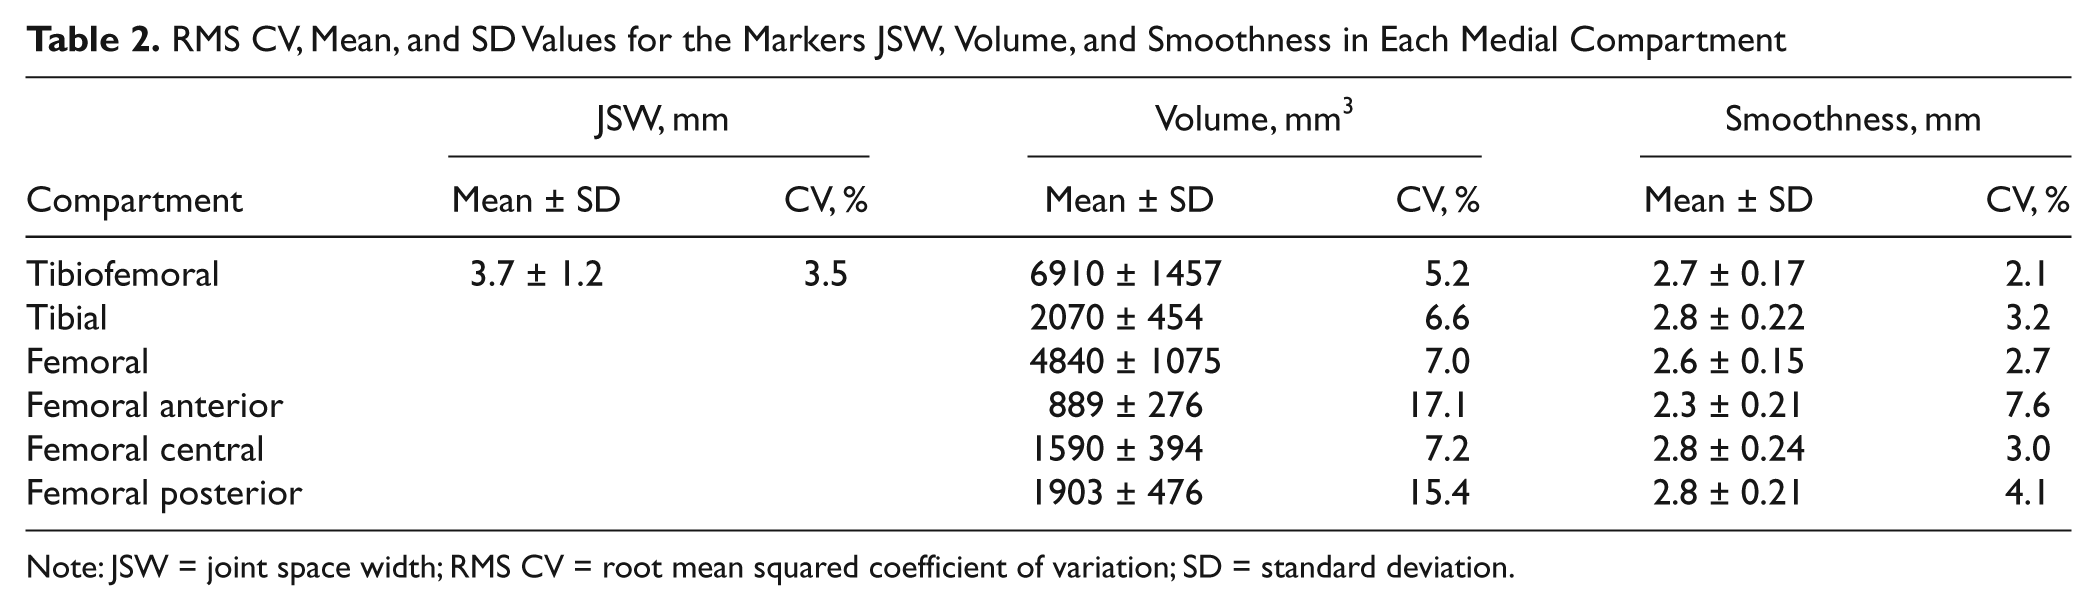
Note: JSW = joint space width; RMS CV = root mean squared coefficient of variation; SD = standard deviation.
Smoothness as Diagnostic Marker of OA
The accuracy of the smoothness marker for separating the population into healthy subjects (252 knees with KL 0 and 1) or those with OA (61 knees with KL 2, 3, and 4), compared with the conventional markers, JSW, and cartilage volume, is shown in Table 3 . JSW allowed diagnostic separation (P < 0.0001, AUC 0.73), whereas cartilage volume allowed separation best in the central femoral compartment (P < 0.0001, AUC 0.65). The smoothness markers were superior cartilage volume in all compartments, particularly in the tibiofemoral compartment (P < 0.0001, AUC 0.82) and in the central femoral compartment (P < 0.0001, AUC 0.79). The increased performance of the smoothness markers compared to volume was statistically significant (e.g., the AUC for tibial smoothness of 0.79 was higher than 0.60 for volume, P < 0.0001).
Diagnostic Scores for JSW, Cartilage Volume, and Smoothness Quantified in the Medial Compartment for Separating KL ≤1 and KL >1 Subpopulations
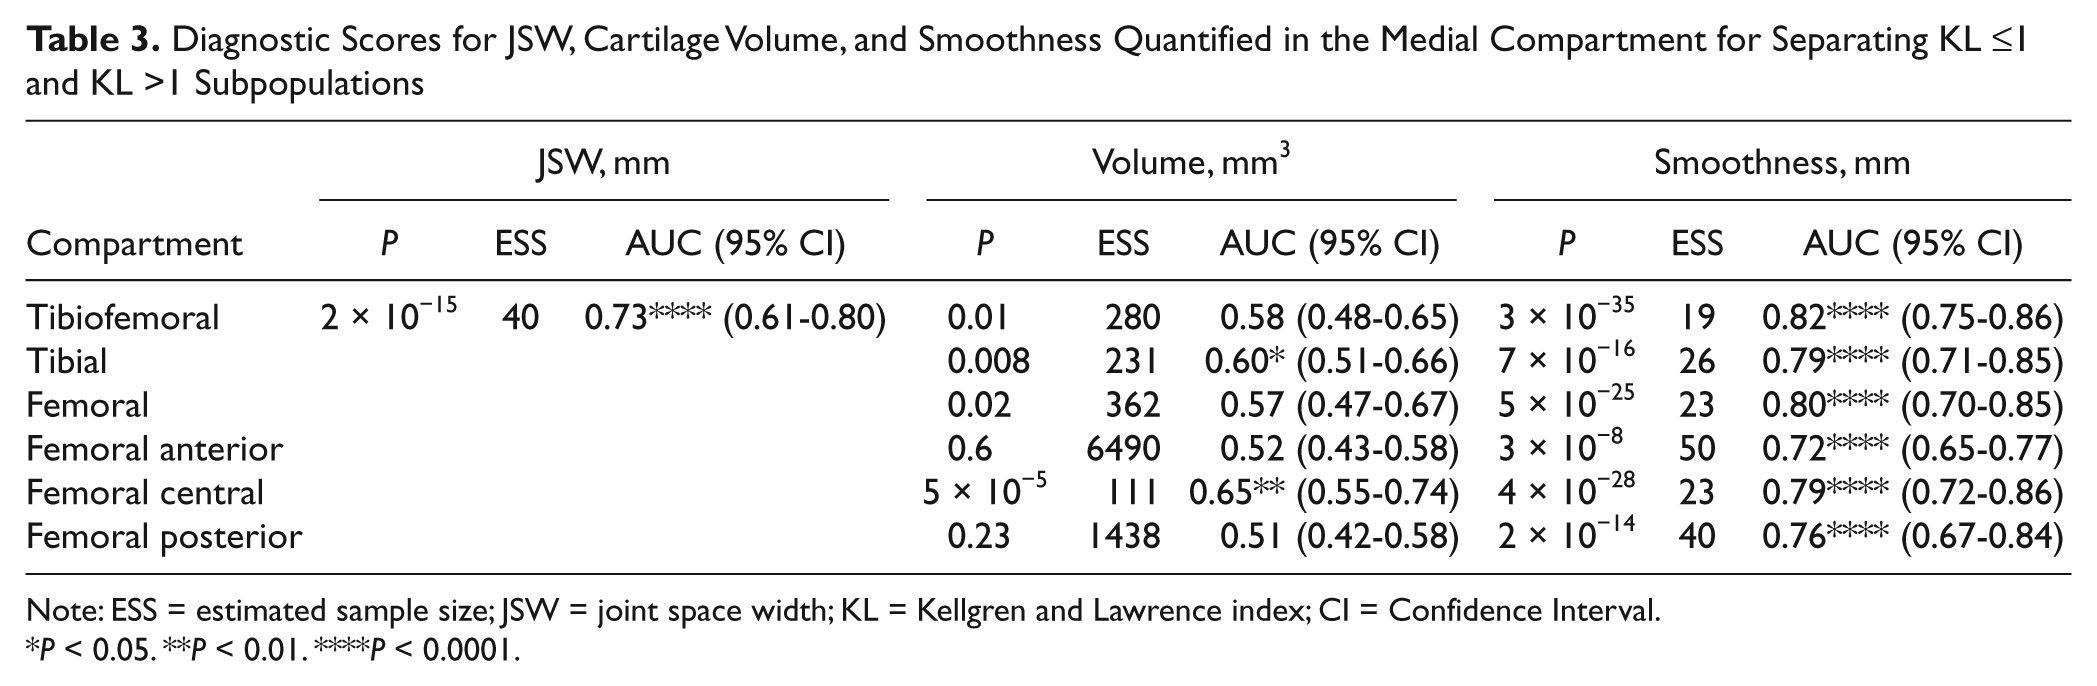
Note: ESS = estimated sample size; JSW = joint space width; KL = Kellgren and Lawrence index; CI = Confidence Interval.
P < 0.05. **P < 0.01. ****P < 0.0001.
The AUC values for smoothness markers were slightly lower after adjustment for age and BMI but showed similar statistical significance. For instance, the AUC value was 0.74 (P < 0.0001) in the tibiofemoral compartment after being adjusted for age and BMI (compared to 0.82, P < 0.0001, unadjusted). This trend was observed in all compartments.
The cross-sectional SRMs for the JSW/volume/smoothness markers were −1.0/−0.35/−1.30 in the tibiofemoral compartment.
The potentiality of the smoothness marker in diagnosing different degrees of radiographic OA, indicated by KL score, is illustrated for the tibial ( Fig. 3A ) and femoral ( Fig. 3B ) compartments. The smoothness marker allowed cross-sectional separation of KL levels above 1.
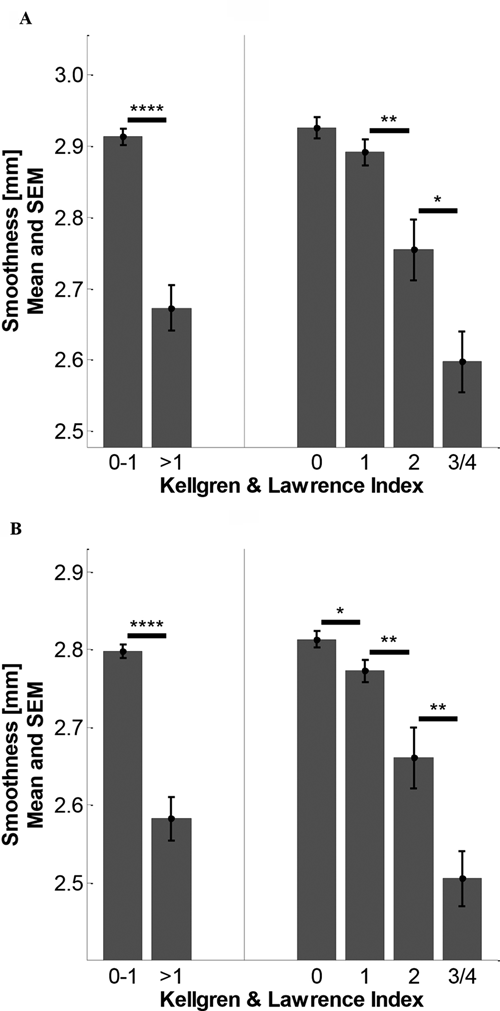
The smoothness markers at each level of osteoarthritis for the (
Association of Imaging Markers with Pain
JSW allowed borderline separation between the groups with and without pain (P = 0.02) and showed borderline correlation with level of pain (r = −0.16, P = 0.07). Volume did not allow separation of pain and no pain but showed correlation to the level of pain, particularly in the femoral posterior compartment (r = −0.32, P < 0.0001).
Finally, smoothness separated subjects with pain from no pain in all compartments (P < 0.05), particularly in the full tibiofemoral compartment (P = 0.006). Smoothness scores were correlated to pain scores in most compartments (except for femoral anterior and femoral central, where P > 0.05); for example, in femoral posterior compartment, the correlation coefficient was −0.32 (P < 0.0001).
Smoothness as Potential Efficacy Marker
The sensitivity to change was higher for the smoothness marker in most of the compartments. For instance, in the tibiofemoral compartment, the mean changes were 0.11 mm/−87 mm3/−0.07 mm, and the SD changes were 0.90 mm/831 mm3 / 0.24 mm for JSW, volume, and smoothness markers, respectively. The longitudinal SRMs were 0.14/−0.10/−0.30 for JSN/cartilage loss/smoothness in the tibiofemoral compartment.
The longitudinal changes in smoothness were correlated with the change in volume for each compartment. These correlations are shown in Table 4 . For all compartments, loss of smoothness was significantly correlated to volume loss but not to JSN. The strongest correlation was 0.60 (P < 0.0001) between smoothness loss and volume loss in the posterior medial femoral compartment.
Linear Correlation Coefficients between Change in Cartilage Surface Smoothness and JSN and Cartilage Volume Loss for Each Compartment
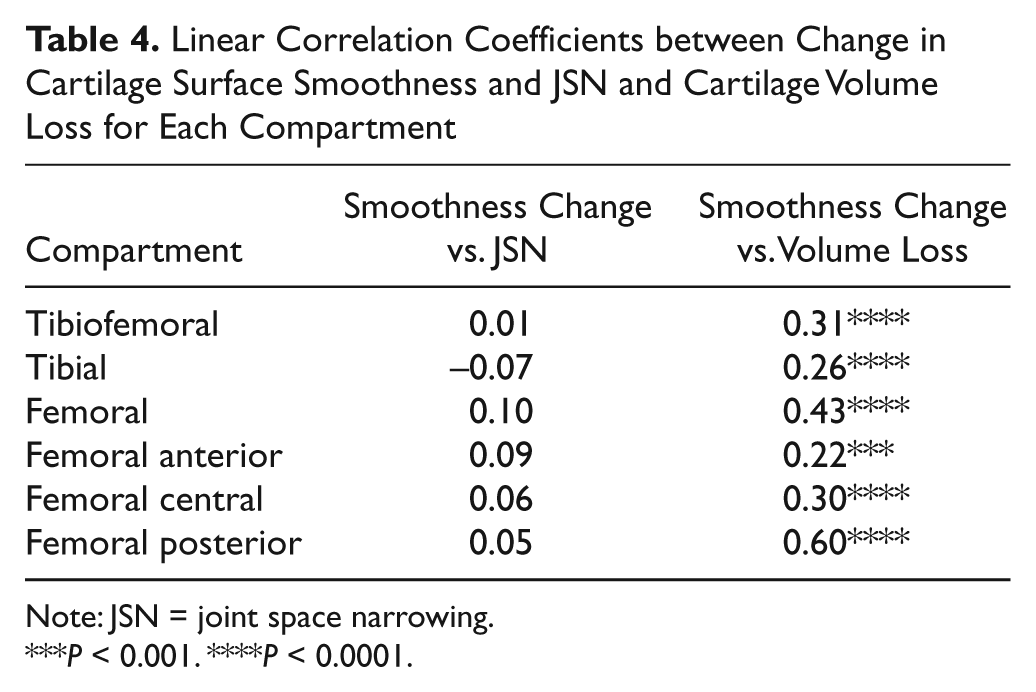
Note: JSN = joint space narrowing.
P < 0.001. ****P < 0.0001.
Smoothness Quantification from Manual and Automatic Segmentations
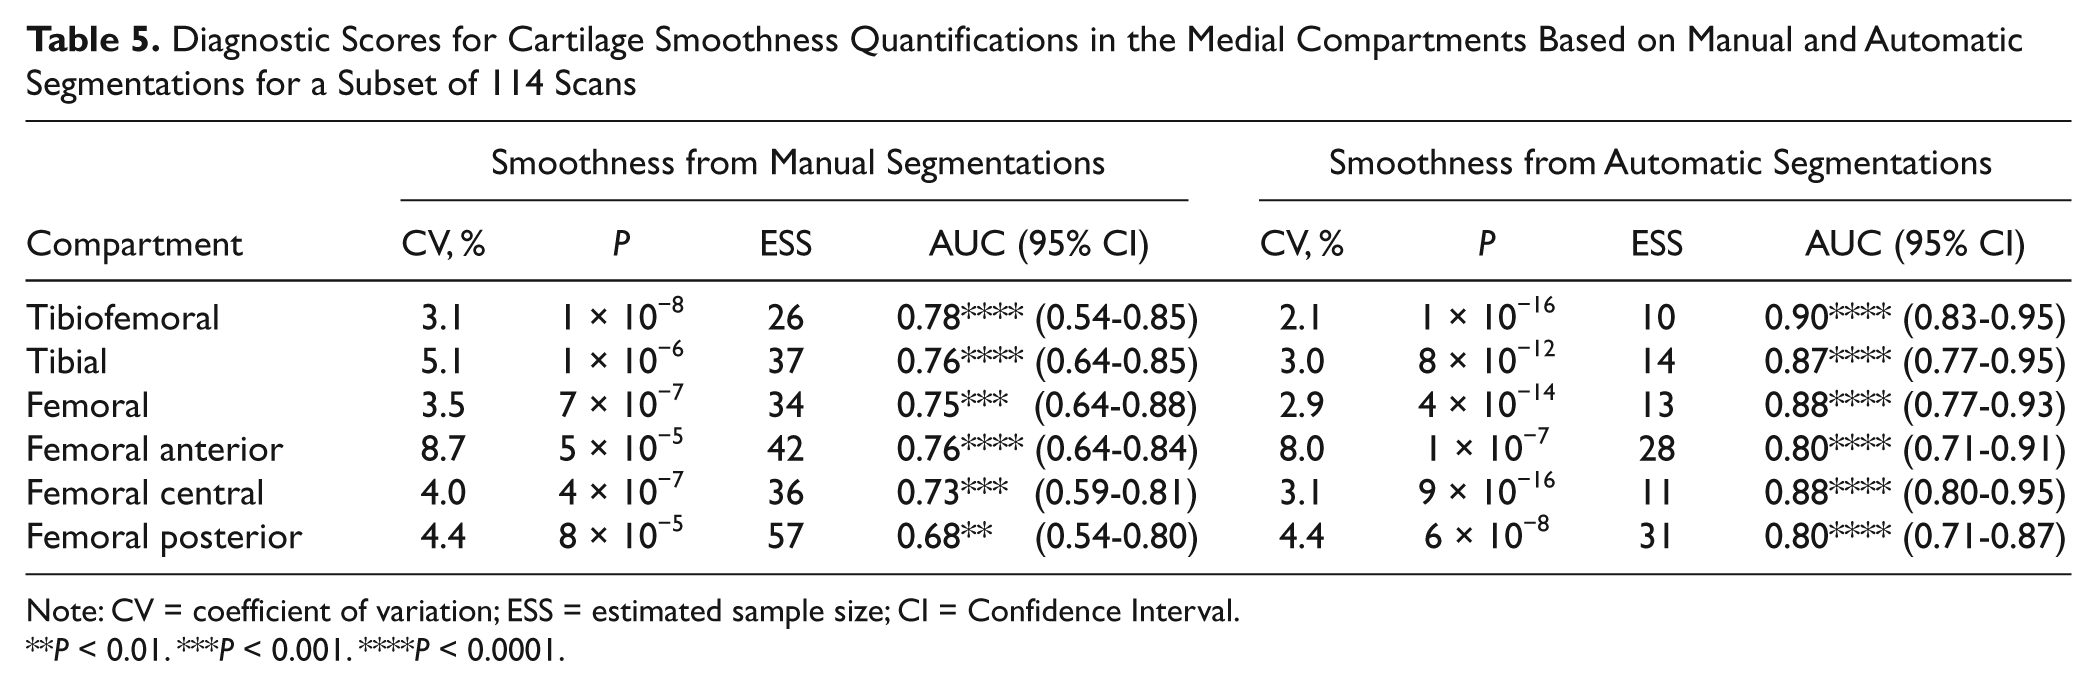
The diagnostic performance of the smoothness markers evaluated on the subset of 114 scans, in which both manual and automatic segmentations were available, is shown in Table 5 . The smoothness markers allowed diagnostic separation of the healthy and diseased (defined by KL ≤1 and KL >1, respectively) subpopulations regardless of whether the quantification was based on manual or automatic segmentations. For all compartments and all performance criteria, the performance of the markers based on automatic segmentations was equal to or higher than those based on manual segmentations.
Diagnostic Scores for Cartilage Smoothness Quantifications in the Medial Compartments Based on Manual and Automatic Segmentations for a Subset of 114 Scans
Note: CV = coefficient of variation; ESS = estimated sample size; CI = Confidence Interval.
P < 0.01. ***P < 0.001. ****P < 0.0001.
Discussion
Loss of smoothness may be a common, early denominator for the heterogeneous paths leading to cartilage degeneration and may in addition capture the roughening of the surface that is associated with increased disease progression.
The presented cartilage smoothness marker may biologically be understood as targeting an early to medium stage of OA. Importantly, whereas a histological assessment focuses on local cartilaginous pathologies, the present computation provides a representation of the degree of pathology in the knee cartilage overall. The earlier stages of OA may be appropriate to evaluate the efficacy of many of the current treatment development projects. Thus, the present data may have important implications for clinical trial design.
Early cartilage damage is associated with extensive activities of proteases within the articular cartilage such as matrix metalloproteases (MMPs) and aggrecanases. 30 These enzymes are currently the target of many treatment strategies and consequently may best be evaluated in a selected OA population in which cartilage is still present and can be treated, rather than in the later stages of OA where cartilage is lacking. 10 We suggest that the present technology may be suited for short-term proof-of-concept studies for selected treatments targeting the mild stages of OA.
Although many approaches to measure cartilage quantity from MRIs have been published, the literature contains few attempts to quantify cartilage quality from its surface curvature. Large-scale curvature analyses were performed both by Hohe et al. 31 and Terukina et al. 32 on the cartilage surface shown by MRI. However, these large-scale measurements were related to joint congruity rather than smoothness. Efforts have been made to evaluate surface roughness from ultrasound by Chiang et al. 33 and most recently by Kaleva et al. 34 The surface roughness index was estimated acoustically for diagnosis of early OA. Ateshian et al. 35 used stereophotogrammetry to collect data from human thumb carpometacarpal joints, and curvature maps were calculated by taking the inverse of the osculating circle fitted at every surface point. However, due to the invasiveness, these methods are not feasible for clinical practice or for clinical studies. The smoothness marker used in the current study relies on fully automated quantification from noninvasive low-field MRI.
The noninvasiveness of the MRI-based smoothness quantification complicates a physical validation of the estimated surface curvatures. In the present study, a physical validation of cartilage quality, for instance, by histology, would have been impractical in such a large general population of subjects. In addition, low-field MRI has been validated less than high-field MRI for cartilage morphometry. The main limitations of low-field MRI are a low signal-to-noise ratio and a low spatial-temporal resolution compared with high-field MRI. However, low-field MRI has advantages of low costs for installation, scanning, and maintenance, and in some settings, low-field MRI has the potential to reduce overall cost with little loss of diagnostic performance. 36 This is of interest for large clinical studies.
The lack of physical validation of both the imaging modality and the smoothness markers limits the strength of the results. Furthermore, by quantifying the surface smoothness, we may be measuring the surface irregularities such as fibrillation, fissures, or erosions. In particular, the smoothness quantification could be biased by segmentation artifacts not directly related to the desired pathologies (e.g., fibrillation). Previously, the accuracy of the smoothness quantification method was validated using digital phantoms. 24 Here, the evaluating comparing the quantifications based on manual and automatic segmentations was performed to investigate this. The fundamentally different nature of slice-wise 2D manual outlining and 3D automatic segmentation creates fundamentally different segmentation artifacts. The fact that similar results were obtained based on these two segmentation sources indicates that the smoothness quantifications are indeed given by the cartilage surface rather than segmentation artifacts. The RMS CVs of 4.6% to 5.8% between automatic and manual baseline smoothness values in all the compartments support that the estimated values are due to smoothness and not due to algorithmic artifacts. Interestingly, the smoothness markers quantified from the computer-based automatic segmentations performed better than those based on the manual segmentations. We attribute this to the between-slice artifacts that arise from manual, slice-wise outlining. Although each slice typically looks smooth, a 3D visualization will reveal jagged edges from slice to slice. The finding demonstrates that for some markers, such as surface smoothness, operator artifacts can be avoided by automatic methods. However, even in the light of these positive validation results, a physical validation would be desirable.
In the present study, the smoothness markers demonstrated promising results. The precision of the smoothness markers in all compartments—tibial, femoral, and femoral subcompartments—was equal or superior to that of the volume markers. Thus, even if the smoothness markers are algorithmically complex, the quantification is at least as robust as the simple volume measurement. For most compartments, the smoothness RMS CV scores were around 3% (see Table 2 ). The smoothness markers also allowed diagnostic separation of healthy and early OA in all compartments with AUC scores between 0.72 and 0.82. These scores were superior to the cartilage volume scores for reliably diagnosing OA by KL score (e.g., the AUC for femoral smoothness of 0.80 was higher than 0.57 for volume, P < 0.0001). The AUC values for diagnostic smoothness markers in all the compartments after adjustment for age and BMI support that the accuracy was not confounded significantly. Interestingly, no significant gender difference was found in smoothness values. A comparison with the diagnostic performance of JSW is less interesting since JSW is a criterion in defining the KL score. As Figure 3 illustrates, in addition to the diagnostic separation between healthy knees and those with the higher KL scores, the smoothness markers also allow separation at later stages of OA.
Furthermore, smoothness showed better SRM than the other imaging markers. This may be because the follow-up interval may be small to detect any significant changes in JSW and cartilage volume. Furthermore, the results demonstrated that longitudinal progression in smoothness was related to longitudinal cartilage loss (see Table 4 ). For instance, the correlation coefficient calculated for yearly change in smoothness versus volume (0.43) in the femoral compartment showed a strong relation (P < 0.0001). Finally, the correlations between perceived pain and smoothness markers indicate that roughing of the cartilage surface may eventually lead to more pain in the joint. These strong associations indicate that smoothness markers may be appropriate not only to measure cartilage quality at a given point of time but may also be useful indicators of longitudinal disease progression and thus could potentially become markers of efficacy in clinical studies of OA.
In general, we observed that smoothness markers measured in the tibial and the central femoral compartments, which are also the most load-bearing compartments, were the most reliable indicators of the presence of OA. This supports an intuitively reasonable relationship between biomechanical stress and initiation of OA. In conclusion, cartilage surface smoothness quantified automatically from MRI may provide markers for future clinical studies with a particular focus on earlier stages of OA.
Footnotes
Acknowledgments and Funding
Radiographs and MRIs were acquired at the Center for Clinical and Basic Research, which also sponsored the study. We sincerely thank Paola Pettersen for performing the manual MRI cartilage segmentation and for providing radiograph readings. The authors gratefully acknowledge the funding from the Danish Research Foundation (Den Danske Forskningsfond), which supports this work.
Conflicts of Interest
Sudhakar Tummala has received a PhD scholarship partly funded by Nordic Bioscience Imaging. Erik Dam is an employee of Nordic Bioscience Imaging. Anne-Christine Bay-Jensen is an employee of Nordic Bioscience. Morten Karsdal is employee and shareholder of Nordic Bioscience. The intellectual and commercial property rights to the investigated MRI markers belong to Nordic Bioscience Imaging.