
Abstract
Cellular heterogeneity is a well-known feature of human neuroblastoma tumors and cell lines. Of the 3 phenotypes (N-, I-, and S-type) isolated and characterized, the I-type cancer stem cell of neuroblastoma is the most malignant. Here, we report that, although wild-type N-Ras protein is expressed at the same level in all 3 neuroblastoma cell phenotypes, activated N-Ras–GTP level is significantly higher in I-type cancer stem cells. When activated N-Ras levels were decreased by transfection of a dominant-negative N-Ras construct, the malignant potential of I-type cancer stem cells decreased significantly. Conversely, when weakly malignant N-type cells were transfected with a constitutively active N-Ras construct, activated N-Ras levels, and malignant potential, were significantly increased. Thus, high levels of N-Ras–GTP are required for the increased malignancy of I-type neuroblastoma cancer stem cells. Moreover, increased activation of N-Ras results from significant down-regulation of neurofibromin (NF1), an important RasGAP. This specific down-regulation is mediated by an ubiquitin-proteasome–dependent pathway. Thus, decreased expression of NF1 in I-type neuroblastoma cancer stem cells causes a high level of activated N-Ras that is, at least in part, responsible for their higher tumorigenic potential.
Introduction
Neuroblastoma is the most common extracranial solid tumor of childhood. One clinically important feature is its cellular heterogeneity. Histologically, stroma-rich neuroblastoma tumors are associated with good prognosis, whereas stroma-poor neuroblastomas are associated with poor patient outcome. 1 From neuroblastoma tumors and cell lines, 3 major cell types have been cloned and characterized. Of these, the cancer stem cell (tumor-initiating or I-type cell) is the most malignant. 2 I-type cell lines exhibit characteristic stem cell properties: self-renewal, bidirectional differentiation capacity, and expression of stem cell markers. 2 By contrast, neuroblasts (N-type cells) are weakly tumorigenic, whereas glial/melanocytic precursors (S-type cells) are nontumorigenic. More importantly, a higher frequency of I-type cells in tumors correlates with poor patient survival. 2
Our studies have been directed towards identifying the factor(s) underlying the high malignant potential of the I-type cancer stem cells. In neuroblastoma, N-myc is amplified in approximately 30% of tumors and is one of the most common genetic abnormalities of this cancer. 3 Moreover, this abnormality correlates with the aggressiveness of the tumor and is widely used as a clinical marker for poor patient outcome. Our previous studies showed that 1) large amounts of N-myc protein are present in both weakly malignant N-type and highly malignant I-type cells and that 2) malignancy correlated not with N-myc level but with cellular phenotype. Thus, additional factors are required for the increased malignant potential specific for the I-type cancer stem cells.
One protein often implicated in cancers and shown to cooperate with myc for malignant transformation is the oncogene Ras. Activating mutations of Ras are found in 20% to 40% of all human cancers.4,5 Interestingly, in neuroblastoma tumors and cell lines, Ras mutations are rare, and Ras levels have been reported to be relatively low.6,7 However, differences in Ras isoforms, activation state, and/or regulation have not been examined in neuroblastoma with regard to cell phenotype.
The 3 predominant Ras genes—H-Ras, K-Ras, and N-Ras—encode highly similar approximately 21-kD monomeric G proteins that are key regulators of signaling pathways controlling normal cell growth and malignant transformation. 8 Wild-type Ras is activated by guanine nucleotide exchange factors (GEFs), which replace bound GDP from Ras with GTP, and is deactivated by GTPase-activating proteins (GAPs), which stimulate the intrinsic Ras GTPase activity to hydrolyze GTP back to GDP. 9 A major RasGAP previously reported in neuroblastoma is the approximately 260-kD protein neurofibromin, encoded by the neurofibromatosis type 1 (NF1) gene. 10 Altered neurofibromin function in NF1 patients leads to increased risk of benign and malignant cancers. 11 A recent study also reported that 1) decreased neurofibromin expression is present in a proportion of neuroblastoma primary tumors and cell lines and that 2) neuroblastomas with low levels of NF1 have a worse clinical outcome. 12 Thus, alterations in Ras activation and/or neurofibromin expression in I-type cancer stem cells, compared to their less or nonmalignant N- and S-type counterparts, could enhance malignancy.
In the present study, we show that N-Ras activation differs markedly among the phenotypes, being significantly higher in the malignant I-type cancer stem cells compared to N- and S-type cells. This increase results from a >3-fold decrease in the amount of neurofibromin. Most importantly, changes in N-Ras–GTP levels significantly alter the malignant potential of neuroblastoma cells. Thus, we have identified a significant factor underlying the enhanced malignancy of neuroblastoma cancer stem cells. This could lead to new, more effective therapies for the treatment of this often fatal childhood cancer.
Results
N-Ras is the major Ras isoform expressed in neuroblastoma
The expression of Ras protein in neuroblastoma cells was first examined by immunoblotting with a pan-Ras antibody. As shown in Figure 1A, Ras protein amounts are nearly the same in all 3 cell phenotypes, consistent with a previous study that showed Ras protein amounts are similar in neuroblastoma cell lines. 7 The 3 Ras isoforms, H-, N-, and K-Ras, play different roles in many human cancers. 13 To determine which Ras isoform is important in human neuroblastoma, protein lysates from neuroblastoma cell variants were immunoblotted with antibodies specific to H/N-Ras or K-Ras isoforms (Fig. 1B). (The specificity of the antibodies was first verified using cells transfected with N-Ras– or K-Ras–expressing constructs [data not shown].) H/N-Ras protein is detectable at similar high amounts regardless of phenotype. By contrast, K-Ras protein, which is readily detected in the K-Ras transfectant (positive control, lane 9), is not detected in any neuroblastoma cell line. Thus, K-Ras protein appears to play little, if any, role in neuroblastoma. Two methods were used to determine the relative levels of the N-Ras and H-Ras isoforms: mRNA analysis and Western blotting. First, relative levels of H- and N-Ras mRNA were assessed by RT-PCR. As shown in Figure 1C (lane 12), amplification efficiencies of the H- and N-Ras primers are similar when H- or N-Ras–containing plasmids are used as templates. However, N-Ras mRNA levels are significantly higher than those of H-Ras in all cell variants regardless of phenotype. These findings were validated by quantitative real-time RT-PCR, which showed that N-Ras mRNA levels are significantly, 10- to 40-fold, higher than H-Ras in neuroblastoma cell lines (Fig. 1D). Finally, antibodies specific to either H-Ras or N-Ras were used for Western blotting. As shown in Figure 1E, N-Ras protein is abundant in all phenotypes and at a much higher level than that for H-Ras, confirming our mRNA results. Thus, as measured at both mRNA and protein levels, the major Ras isoform expressed in all neuroblastoma cells is N-Ras.
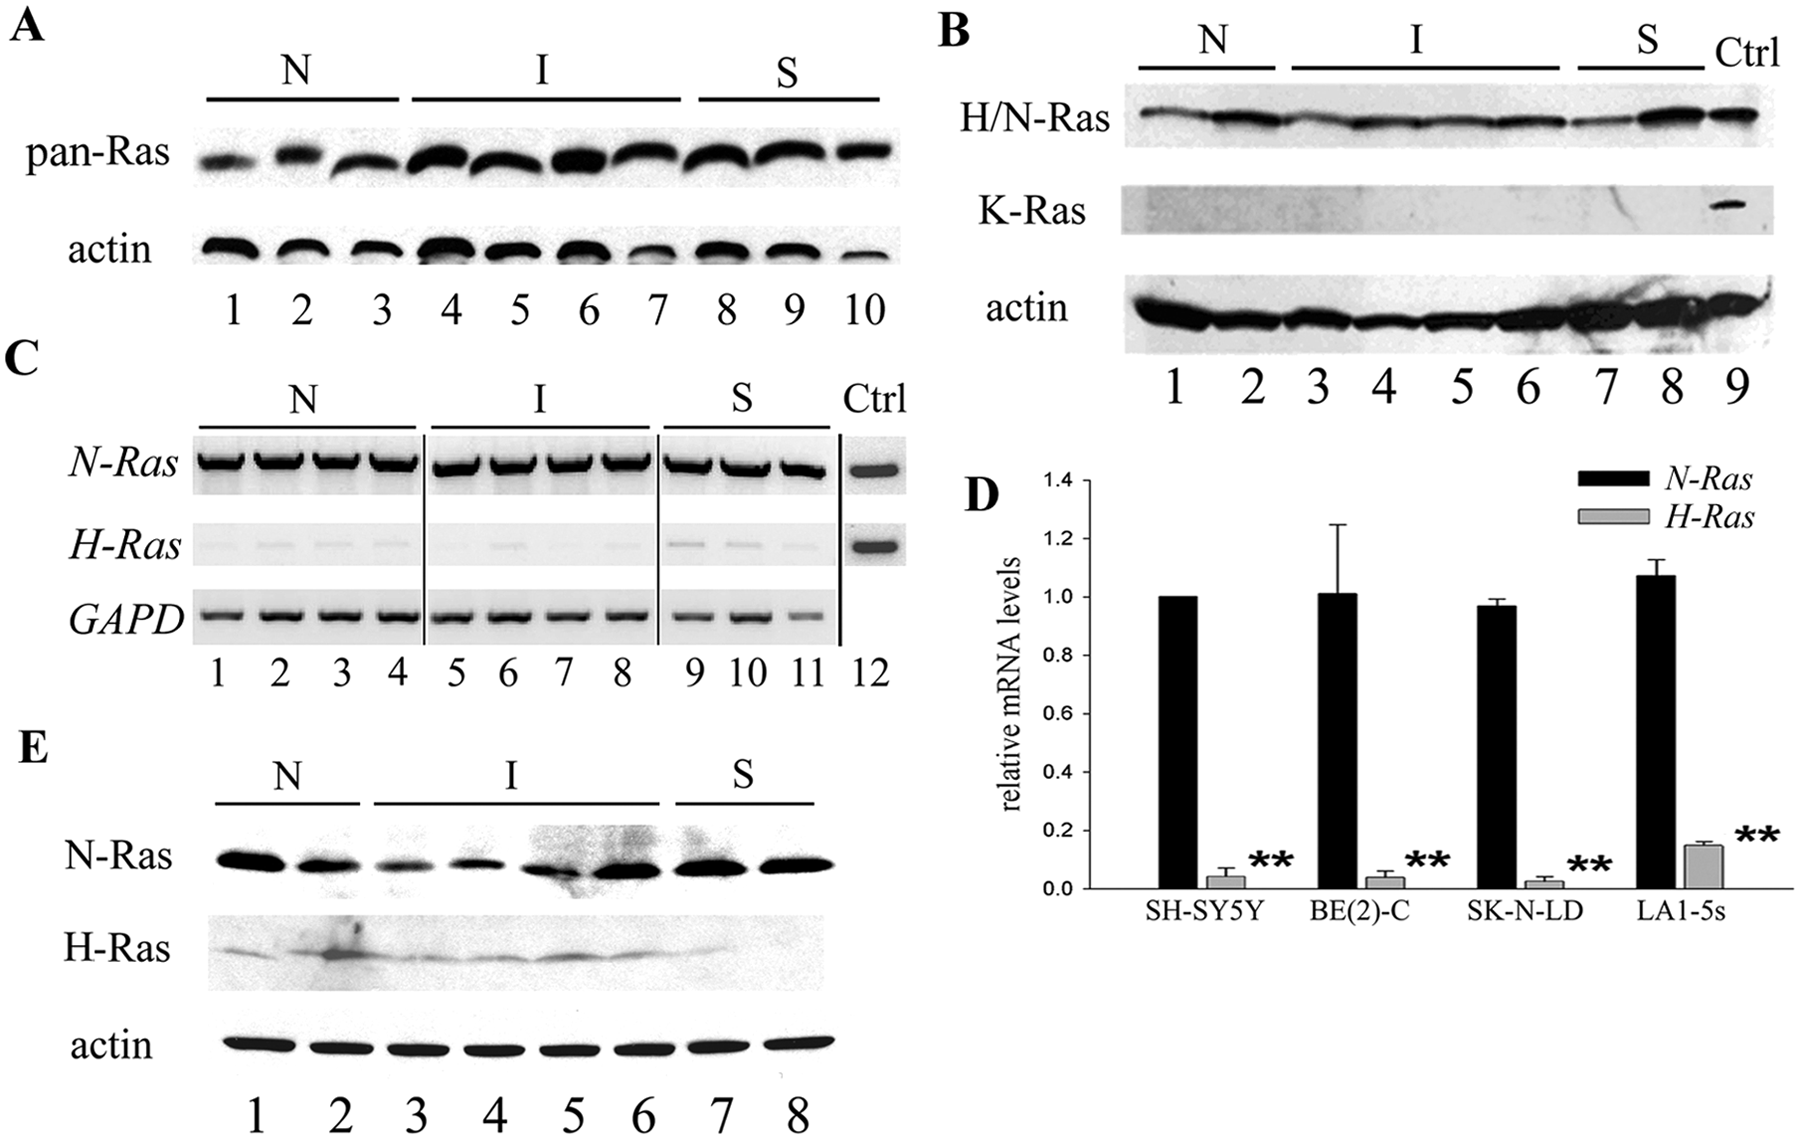
Ras isoforms expressed in neuroblastoma cell variants. (
I-type neuroblastoma cancer stem cells contain high levels of activated Ras
Ras is present in cells in both active (Ras-GTP) and inactive (Ras-GDP) states. To examine whether Ras activation differs among the phenotypes, activated Ras-GTP levels were measured using a Raf1 precipitation assay (Millipore Corp., Billerica, MA), followed by immunoblotting using the H/N-Ras antibody (Fig. 2A) or pan-Ras antibody (data not shown). Total ras protein of the original lysate was determined by Western blot analysis and the ratio of Ras-GTP/total ras determined for all lines. Results showed that levels of activated Ras-GTP/total ras differ significantly, being 5.7-fold higher in I-type cancer stem cells compared to N- and S-type cells (Fig. 2A and 2B).
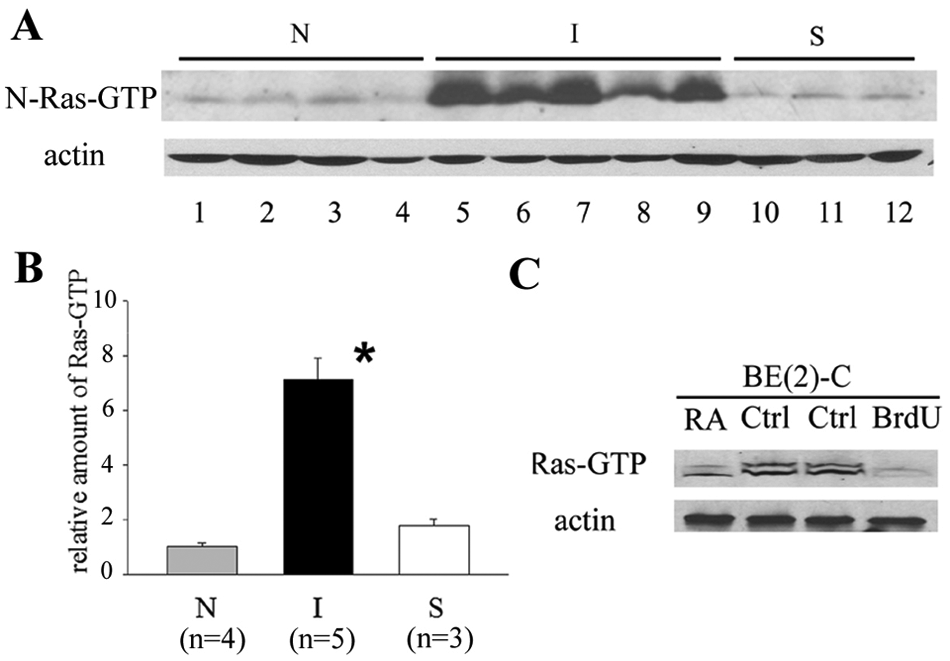
Activated Ras-GTP levels are high in I-type neuroblastoma cells. (
To confirm that high levels of activated Ras are specific to the stem cell phenotype, I-type BE(2)-C cells were induced to differentiate into either N-type cells (with all-trans retinoic acid [RA]) or S-type cells (with 5-bromo-2-deoxyuridine [BrdU]). 14 Differentiation along either pathway led to significant decreases (2.3- and 3.8-fold, respectively) in Ras-GTP levels (Fig. 2C). Thus, in human neuroblastoma cells, Ras activation is phenotype specific, with highest levels in I-type cancer stem cells.
Changes in Ras-GTP levels alter neuroblastoma cell malignancy
Next, we determined whether changes in Ras-GTP levels could affect the malignant potential. Two constructs were used: 1) a dominant-negative N-Ras (DN-N-Ras) construct (S17N) to decrease Ras-GTP levels, and 2) a constitutively active N-Ras (CA-N-Ras) construct (G12V) to increase Ras-GTP levels. 15
Three stably DN-N-Ras–transfected clones of the I-type BE(2)-C cell line showed >2-fold decreases (P < 0.01) in Ras-GTP levels (Fig. 3A). These same transfectants have 3.8- to 5.0-fold decreases in colony-forming efficiency (CFE) (8.0% ± 1.5%; P < 0.001) in soft agar compared to vector-transfected controls (40.5% ± 2.5%) (Fig. 3B and 3C). The morphology of the cells was not changed. The same effects were also found in a second I-type cell line, CB-JMN (data not shown). Thus, lowering the level of Ras-GTP can significantly reduce the high malignant potential of I-type cancer stem cells.
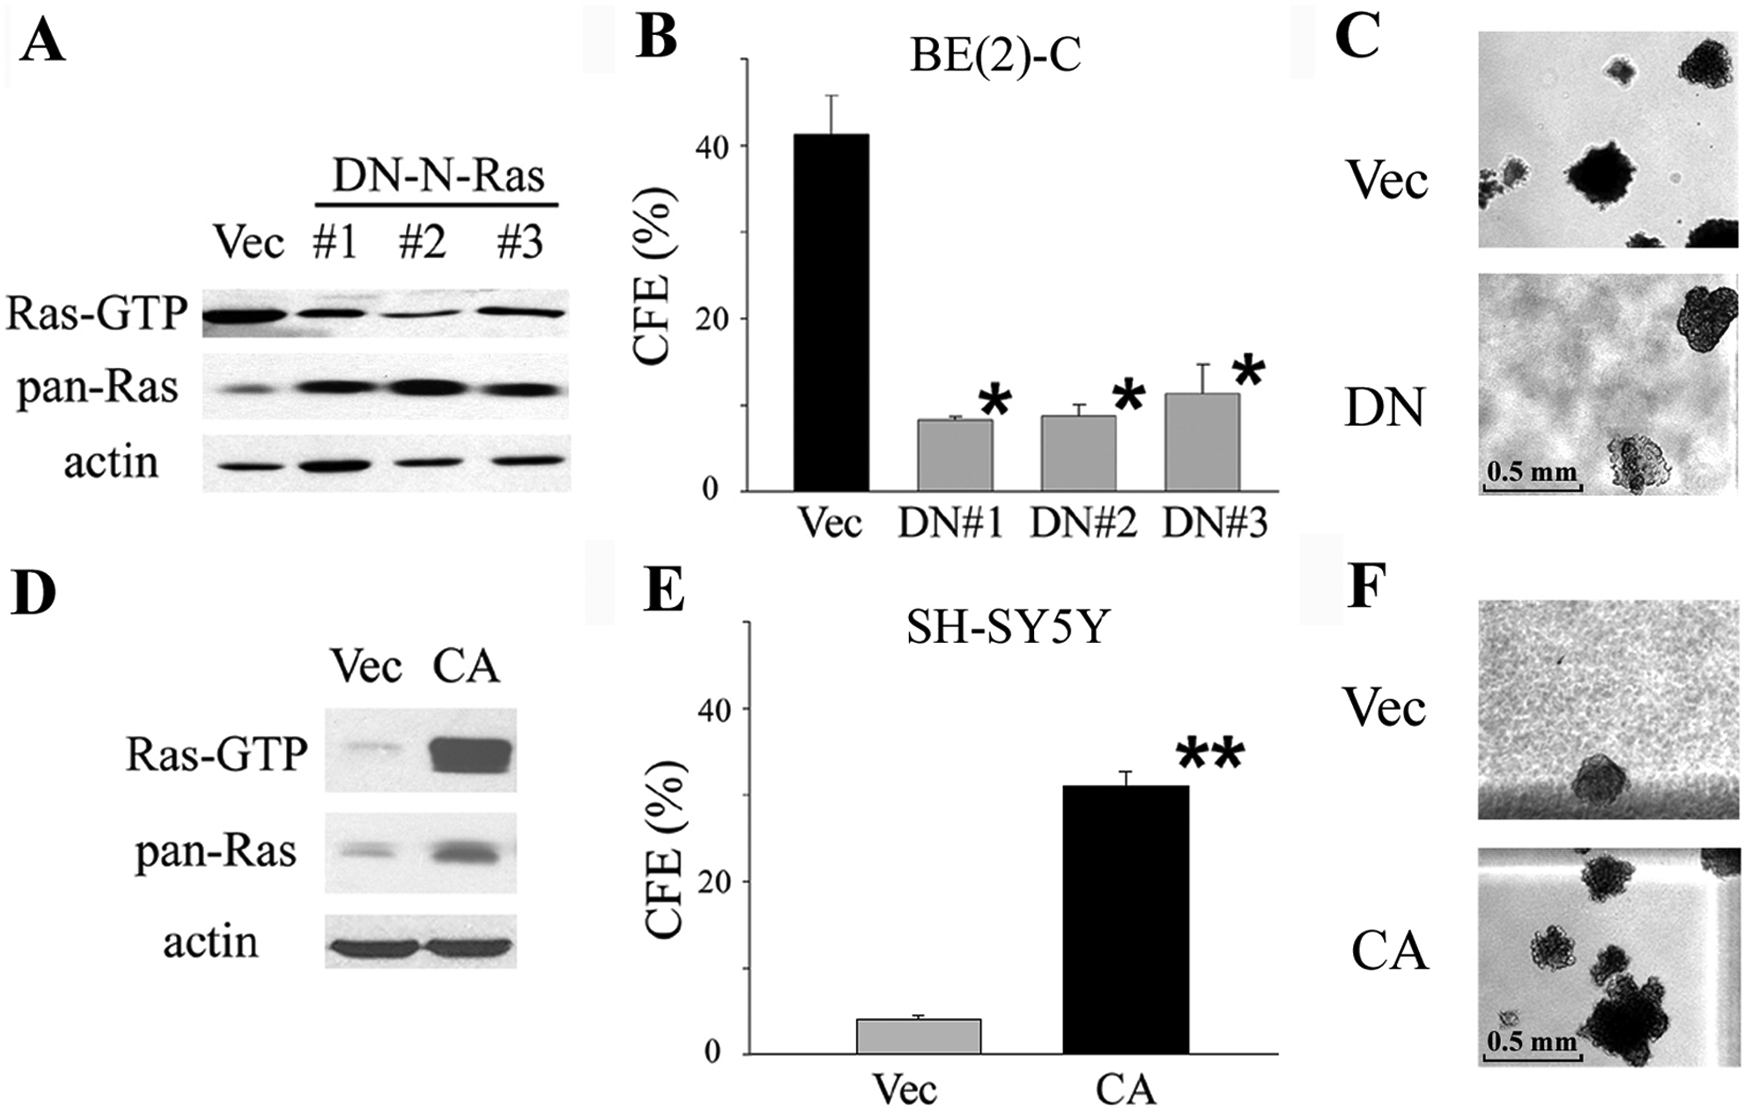
Changing Ras-GTP level by dominant-negative (DN) and constitutively active (CA) N-Ras constructs alters malignancy in neuroblastoma cells. DN-N-Ras–transfected I-type BE(2)-C clones have a (
Conversely, N-type neuroblastoma SH-SY5Y cells, which have low Ras-GTP levels and are only weakly tumorigenic (4%-5% CFE in soft agar), were transfected with the CA-N-Ras construct. Cell morphology did not change when Ras-GTP level was significantly increased (>10-fold; P < 0.001) (Fig. 3D). The CFE in soft agar increased 7.5-fold (P < 0.001) to 30.8% ± 1.7% compared to vector-transfected controls (CFE = 4.0% ± 0.5%) (Fig. 3E and 3F). Thus, the amount of activated Ras directly modulates the degree of cell malignancy.
High Ras-GTP levels protect neuroblastoma cells from apoptosis
To further investigate the mechanism(s) by which the Ras pathway might mediate malignancy, the DN-N-Ras and CA-N-Ras transfectants were assessed for changes in cell proliferation and survival. Growth curves showed the population doubling time (PDT) is significantly elongated in the DN-N-Ras–transfected I-type BE(2)-C cells, increasing from 24.9 ± 0.8 hours in the vector control to 32.8 ± 1.4 hours in DN-N-Ras cells (P < 0.01). By contrast, N-type SH-SY5Y cells transfected with a CA-N-Ras construct grew more rapidly (PDT = 19.2 ± 0.7 hours) compared to the vector control (PDT = 27.0 ± 1.0 hours) (P < 0.01). However, these differences are not due to changes in cell cycle progression. No significant differences in BrdU incorporation rate were seen in either DN-N-Ras–transfected BE(2)-C or CA-N-Ras–transfected SH-SY5Y cells when compared to vector-transfected controls (data not shown).
However, Ras activation did affect cell apoptosis. To assess changes in cell death, an apoptosis and necrosis assay was used. This fluorescence staining method (Biotium Inc., Hayward, CA) demonstrated that, in BE(2)-C control vector transfectants, the percentages of apoptotic and necrotic cells are 4.5% and 0.4%, respectively. In BE(2)-C DN-N-Ras transfectants, the percentage of apoptotic cells increases significantly 4.1-fold to 18.8% (P < 0.01), while the rate of cell necrosis remains the same (Fig. 4A and 4B). By contrast, CA-N-Ras transfectants of N-type SH-SY5Y show a significant 4.0-fold decrease in cell apoptosis, from 6.4% to 1.6%, when compared to the control vector transfectants (P < 0.01). Again, the percentage of necrotic cells remains the same (Fig. 4C and 4D).
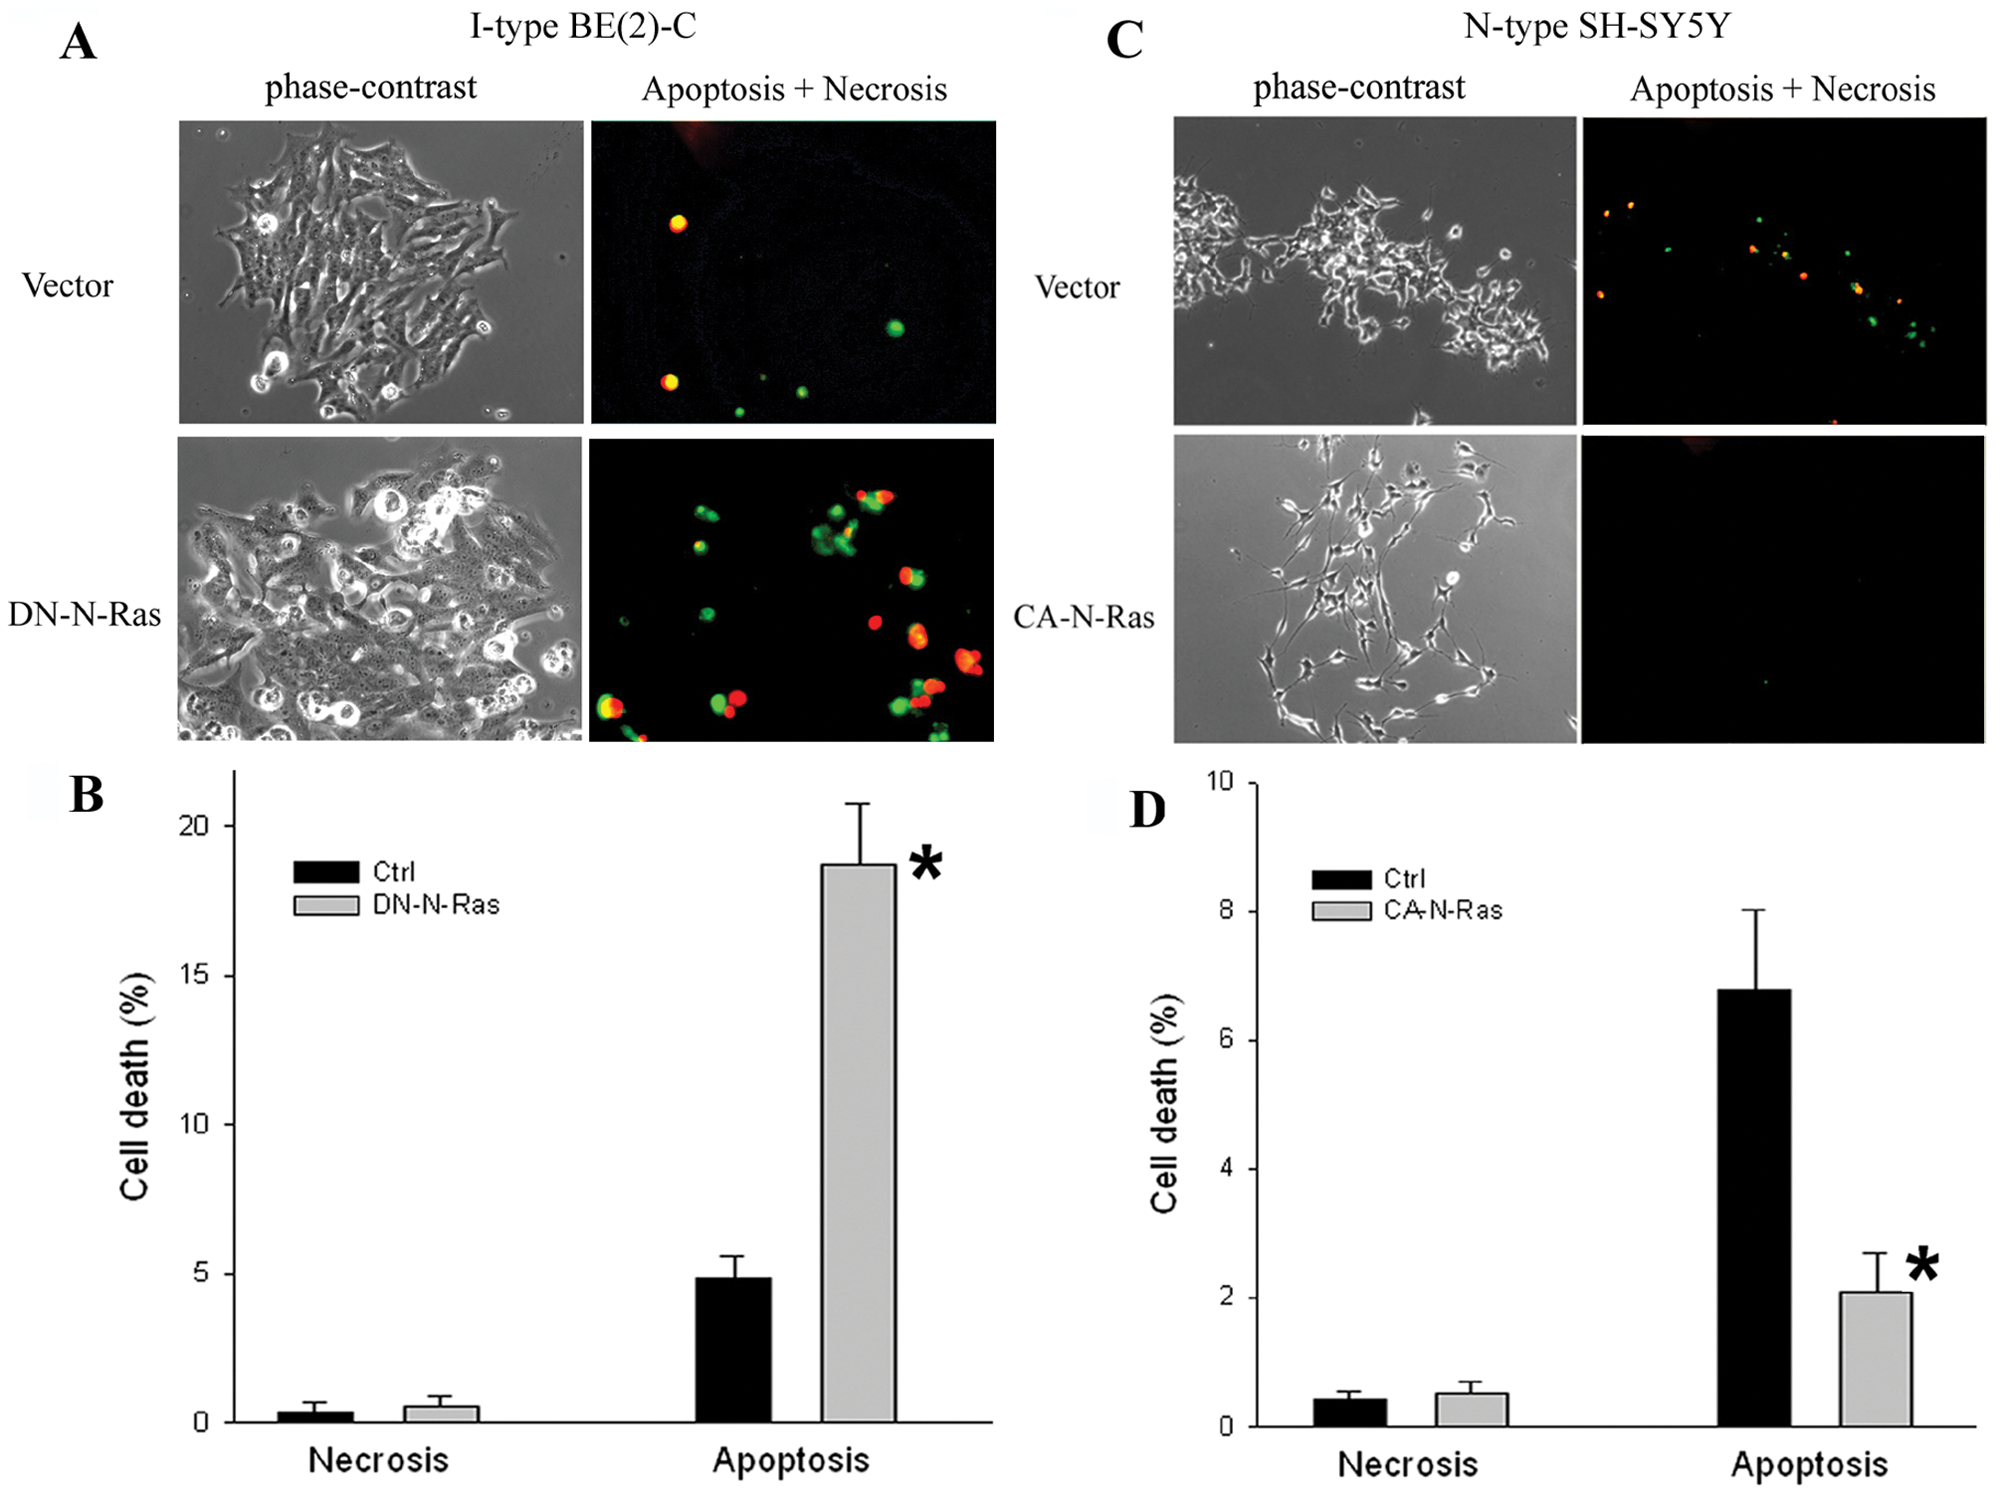
High levels of Ras-GTP protect neuroblastoma cells from apoptosis. (
Expression of RasGAPs in neuroblastoma
Our finding that Ras activation decreases with induced differentiation of I-type cells, in conjunction with the reported rarity of Ras-activating mutations in neuroblastoma, 6 suggested that elevated Ras signaling in I-type cells is the result of phenotype-specific regulatory mechanisms, not Ras gene mutations. Therefore, we examined the expression of RasGAPs, particularly p120GAP and NF1, which have been shown to affect Ras activation.
Whereas no consistent differences in the amount of p120GAP protein were detected among the 3 phenotypes (Fig. 5A), the amount of neurofibromin differed markedly (Fig. 5B). As a group, I-type cells have significantly lower amounts of neurofibromin compared to N- and S-type cells (>3-fold; P < 0.01). Moreover, a highly significant reciprocal inverse relationship exists between Ras-GTP levels and amounts of neurofibromin in individual neuroblastoma cell variants (Fig. 5C). Finally, both RA- and BrdU-induced differentiation of BE(2)-C cells leads not only to decreased Ras-GTP levels (Fig. 2C) but also to increased neurofibromin amounts (Fig. 5D). Thus, these findings suggest a functional relationship between elevated Ras activation and down-regulated neurofibromin in I-type cancer stem cells.
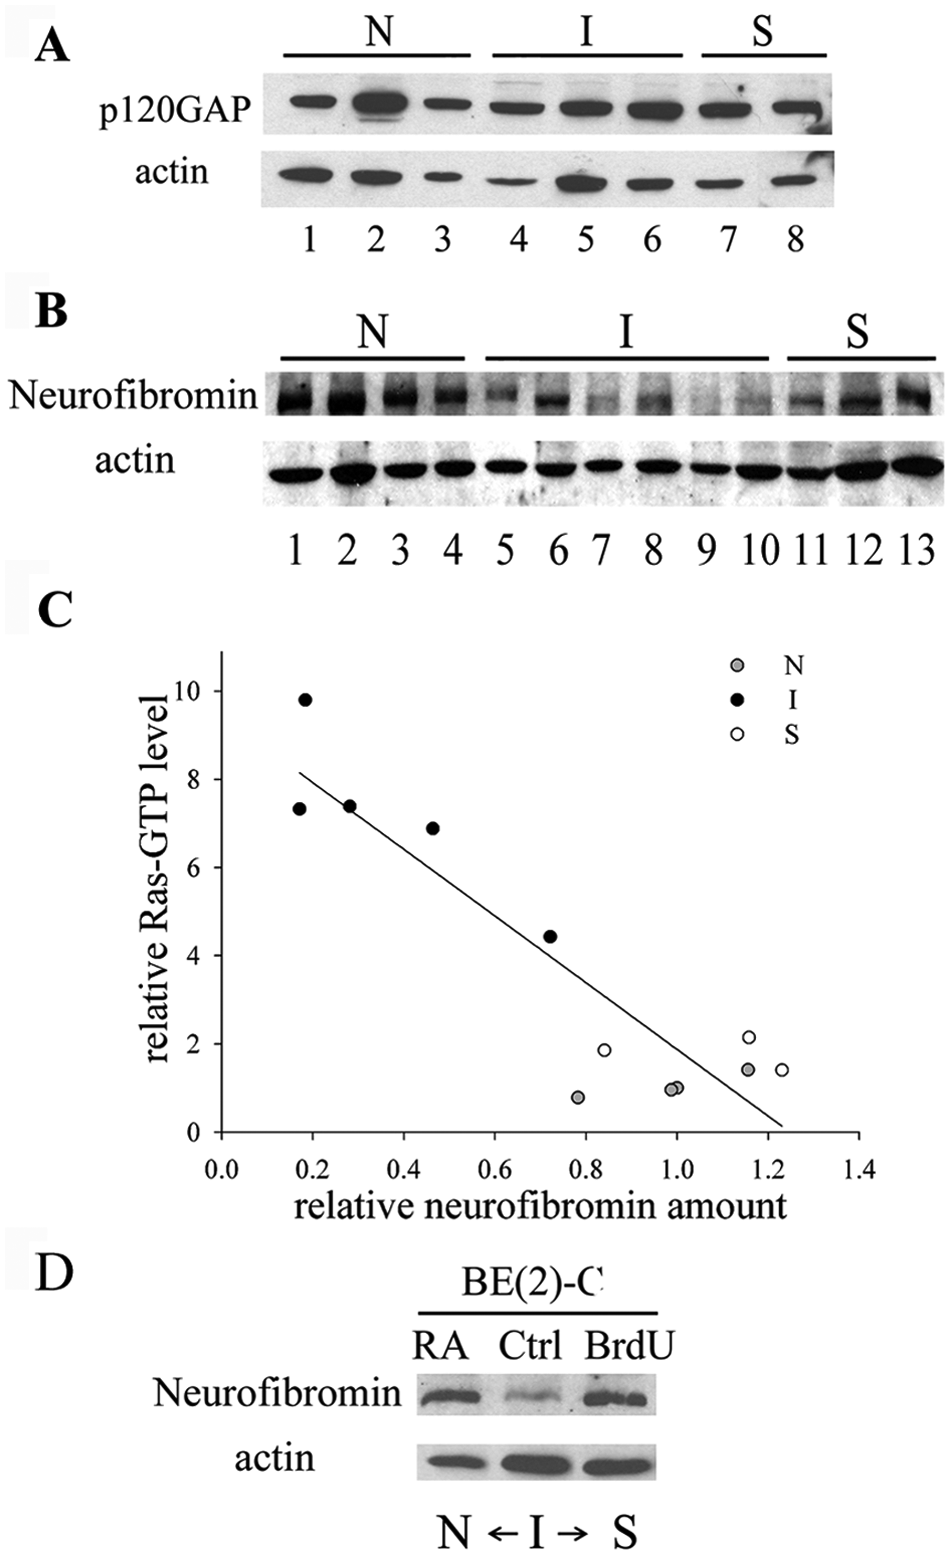
Amounts of neurofibromin protein, but not p120GAP, are lower specifically in I-type neuroblastoma cells. (
To directly assess whether down-regulation of neurofibromin could increase N-Ras activation, N-type SH-SY5Y cells were transfected with an NF1-specific shRNA plasmid. A stably transfected population with decreased amounts of neurofibromin (2.0-fold) has significantly increased Ras-GTP (3.8-fold) amounts compared to the vector-transfected control (Fig. 6A). Moreover, down-regulation of NF1 results in a significant increase in malignant potential as indicated by a 2.1-fold increase in CFE in soft agar (P < 0.01) (Fig. 6B).
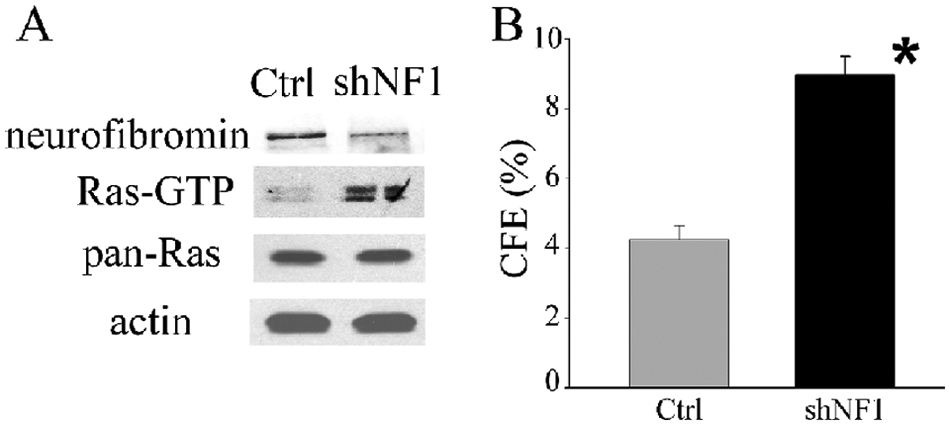
Down-regulation of neurofibromin protein increases both Ras-GTP level and malignant potential in neuroblastoma cells. (
Down-regulation of neurofibromin in I-type cells occurs at the posttranslational level
To investigate the mechanism by which neurofibromin is specifically down-regulated in I-type cells, the mRNA levels of NF1 were measured in neuroblastoma cell variants. Interestingly, both semiquantitative PT-PCR and quantitative real time RT-PCR analyses using primers recognizing 4 different regions (N-terminal region, C-terminal region, GAP-related domain, and NF1 antibody epitope-coding region) of NF1 mRNA confirm that the levels of NF1 mRNA are not significantly different among neuroblastoma cell phenotypes (Fig. 7A and 7B and data not shown). Thus, differential expression of NF1 is not regulated at the transcriptional level.
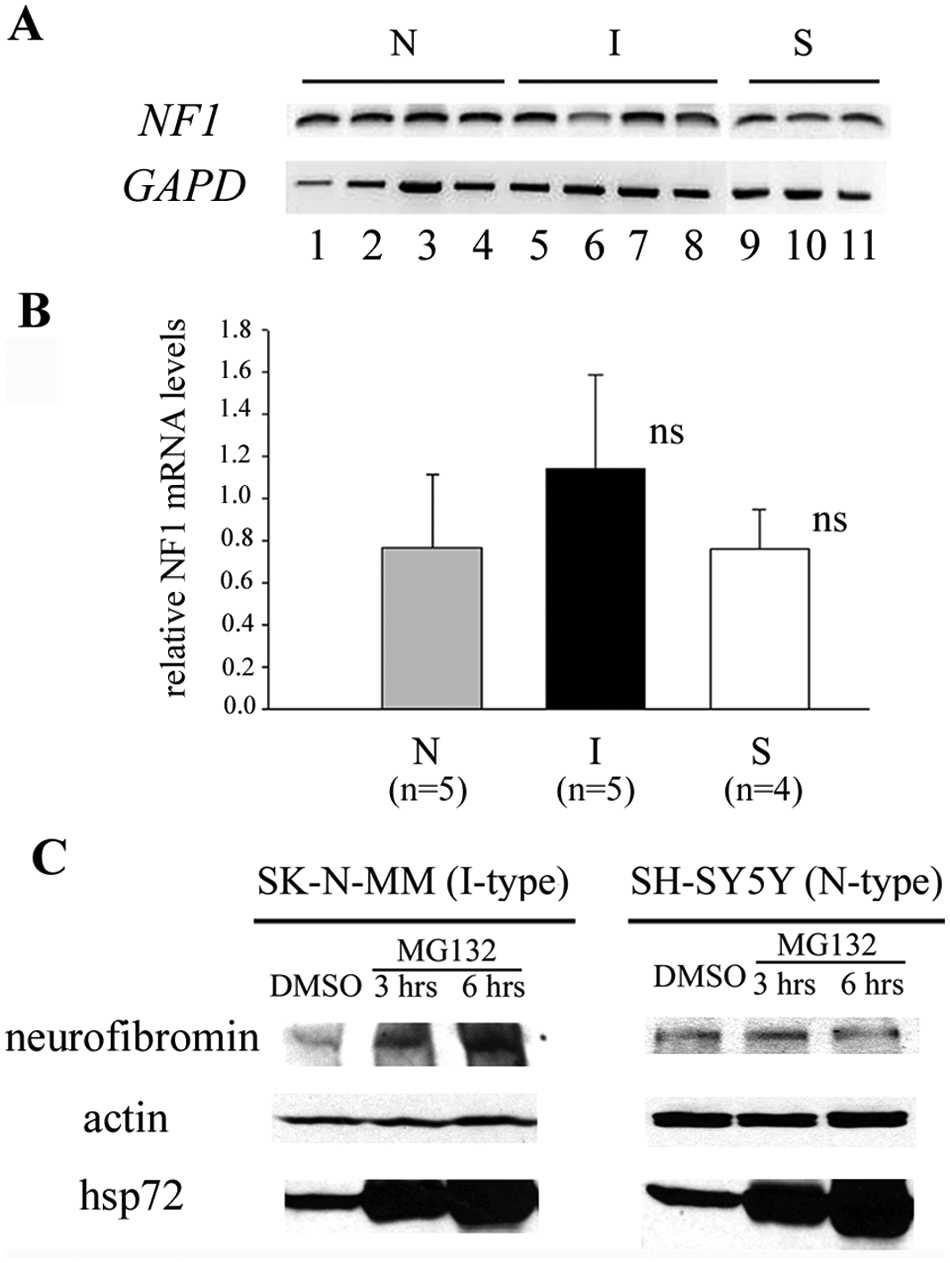
Down-regulation of neurofibromin in I-type cells occurs at the posttranslational level. (
Previous studies have shown that neurofibromin protein can be quickly degraded via a ubiquitin-proteasome pathway. 16 However, other investigators have suggested that this degradation is context dependent and does not occur in a variety of neuronal cell types.17,18 To test the rate of ubiquitin-proteasome–dependent degradation of neurofibromin, I-type SK-N-MM cells and N-type SH-SY5Y cells were treated with 10 μM MG132 (a specific proteasome inhibitor) for 3 and 6 hours. In both cell lines, the amount of hsp72 (positive control) increased dramatically in MG132-treated cells compared to DMSO-treated controls, whereas the amount of actin (negative control) remained the same (Fig. 7C). Interestingly, whereas neurofibromin amount remained the same in MG132-treated N-type SH-SY5Y cells (Fig. 7C) over 6 hours, confirming earlier results, 18 MG132-treated I-type SK-N-MM cells showed a significant accumulation of neurofibromin protein (2.0- and 3.2-fold increases after 3 and 6 hours, respectively) (Fig. 7C). Therefore, neurofibromin protein degradation via the ubiquitin-proteasome pathway occurs at a much higher rate in I-type cells compared to N-type cells. This increased degradation of neurofibromin leads to significantly lower steady-state amounts of this protein in neuroblastoma I-type cancer stem cells, resulting in higher levels of Ras activation and, consequently, greater malignant potential.
Discussion
In human neuroblastoma, 3 different cell phenotypes are evident, with distinct morphologies, gene expression patterns, and malignant potentials. I-type neuroblastoma cancer stem cells are the most malignant phenotype. 2 Therefore, in the present studies, we focused on the mechanisms, that is, specific genes and/or pathways, that are distinctive to I-type cells and absent or less prominent in both less malignant N-type and nonmalignant S-type neuroblastoma cells.
Ras-activating mutations are commonly found in many human cancers. Although previous studies had reported only low Ras-GTP levels in neuroblastoma, 7 we did discover that highly activated Ras signaling occurs, but only in I-type neuroblastoma cancer stem cells, and that these high levels of activated Ras play a significant role in their high tumorigenicity. This is the first evidence showing the importance of Ras in the malignancy of neuroblastoma and also the first to demonstrate this highly activated pathway in a cancer stem cell phenotype. Moreover, the fact that all 6 I-type cancer stem cell lines included in this study were established from different patients strengthens the interpretation that the high level of Ras-GTP is a consistent characteristic of neuroblastoma cancer stem cells. This finding also supports previous studies showing that the Ras pathway is important in the control of stemness in embryonic stem cells and cancer stem cells. 19
Overexpression of myc protein can induce either cell growth or apoptosis. 20 High levels of activated N-Ras appear to play an important role in protecting neuroblastoma cells from apoptosis. This is consistent with the finding that myc-induced apoptosis can be rescued by Ras activation. 20 Therefore, the highly malignant potential of I-type cells may result from the cooperation between the high level of N-myc and activated N-Ras.
In addition to activating mutations, Ras signaling can be enhanced in human cancers by other mechanisms, for example, EGFR overexpression in many carcinomas, BRAF mutation in melanomas, amplification of AKT or PI3K in ovarian cancers, PTEN loss in glioblastomas, and loss of NF1 in malignant peripheral nerve sheath tumors (MPNST) in neurofibromatosis type 1 patients.21,22 In this study, the down-regulation of neurofibromin, one of the major Ras activation regulators, was found to lead to highly activated Ras in I-type cells. Neurofibromin was previously shown to be predominantly expressed in neurons, Schwann cells, and astrocytes. 23 This is consistent with our finding that N- and S-type neuroblastoma cells, representing neural crest-derived, more differentiated neuronal and nonneuronal cells, respectively, express abundant neurofibromin. By contrast, I-type cancer stem cells express low levels of neurofibromin. A recent study also reported decreased neurofibromin expression in a proportion of neuroblastoma primary tumors and cell lines. 12 Their finding that children with neuroblastomas with low NF1 levels have worse clinical outcomes is consistent with our studies showing that the higher frequency of low NF1-expressing I-type cells in primary neuroblastomas correlates with poor patient survival. 2
Loss-of-function mutations in NF1 result in deregulated Ras signaling in neurofibromatosis type 1. 24 Hölzel et al. 12 found NF1 mutations in neuroblastoma occur at a low frequency in primary tumors but are present at a much higher (50%) frequency in cell lines. They conclude that NF1 mutations may play a role in a subset of neuroblastoma tumors, but additional epigenetic factors may also regulate the levels of the tumor suppressor gene. Our findings that NF1 protein amounts are specifically elevated following phenotypic differentiation would support this conclusion. Moreover, using the specific proteasome inhibitor MG132, we showed that neurofibromin protein is degraded 8-fold more rapidly in I-type cells than in N-type cells. This is consistent with previous findings that neurofibromin protein can be quickly degraded via a ubiquitin-proteasome–dependent pathway 16 and such a regulatory mechanism is cell type dependent.17,18 Increased proteasomal degradation of NF1 has also been reported in malignant glioblastomas, 24 suggesting that neurofibromin degradation may play similar roles in the malignancy of both nervous system cancers. However, the mechanism by which this occurs is still unknown and requires further investigation.
The finding that high levels of Ras-GTP are important for the malignancy of neuroblastoma cells suggests targeting the Ras signaling pathways as a new strategy for neuroblastoma treatment. For example, we and others have found in preclinical studies that growth of I-type neuroblastoma cells or other solid tumors is slowed by the Ras pathway inhibitor farnesyl transferase inhibitor (FTI-277), although clinical trials have been disappointing. 25 Furthermore, as cancer stem cells are more resistant to existing treatments,26,27 targeting Ras activation, a cancer stem cell– specific property, may provide a more effective means to control the growth and relapse of this often fatal disease.
Materials and Methods
Cell culture and differentiation
The 14 different human neuroblastoma cell lines, established from 12 patients’ tumors or bone marrow aspirates, used for these studies have been published previously.2,28-31 All cell lines were maintained in a 1:1 mixture of Eagle’s Minimum Essential Medium with nonessential amino acids and Ham’s Nutrient Mixture F12 (Invitrogen Corp., Carlsbad, CA), supplemented with 10% fetal bovine serum (Hyclone, Logan, UT) without antibiotics. For differentiation studies, I-type BE(2)-C cells were grown for 7 to 14 days in the presence of 10 µM all-trans RA or BrdU. 14
Immunoblot analysis and Ras activation assay
Cells in logarithmic growth phase were harvested and lysed, and proteins were separated on 7.5% to 12.5% SDS polyacrylamide gels by standard techniques. 2 Blots were probed with the following antibodies: polyclonal rabbit anti-NF1 (A-300-140A, Bethyl Laboratories, Montgomery, TX) and anti–K-ras (F234, Santa Cruz Biotechnology Inc., Santa Cruz, CA) and monoclonal mouse anti-RasGAP120 (B4F8), anti–H/N-Ras (1A6.2), anti–pan-Ras (Millipore Corp.), anti–N-Ras (F155):sc-31 (Santa Cruz Biotechnology Inc.), anti–H-Ras (BD Transduction Laboratories, Franklin Lakes, NJ), anti–β-actin (AC-74, Sigma-Aldrich Corp., St. Louis, MO), and anti-hsp72/73 (W27, EMD Chemicals Inc., Gibbstown, NJ). A chemiluminescence method using secondary antibodies conjugated to horseradish peroxidase was used to detect bound primary antibody. The relative amounts of protein were quantified by scanning densitometry of the resulting Kodak XAR films using Kodak gel analysis software (Kodak, New Haven, CT). Band intensities were normalized to those of β-actin (actin) or hsp72/73 (hsp72) to correct for differences in loading.
Ras-GTP levels were measured using a Ras activation assay kit (Millipore Corp.) according to the manufacturer’s instructions. Briefly, Ras-GTP was precipitated using the activated Ras-GTP binding domain of Raf-1 and visualized by Western blots with anti–pan-Ras or anti–H/N-Ras antibodies. The levels of Ras activation are then expressed as a ratio of Ras-GTP to the total Ras/actin levels in the same lysates.
Cloning and site-directed mutagenesis
The human N- and K-Ras protein-coding regions were amplified by RT-PCR using isoform-specific primers (N-Ras: 5′-CCGGAAGTGC CGCTCCTTGG-3′, 5′-ACCTGGGGTGGCAGAGGTGT 3′; K-Ras: 5′-GCGGGAGAGAGGCCTGCTGA-3′, 5′-AC TGCATGCACCAAAAACCCCA-3′) and ligated into pTARGET vector (Promega Corp., Madison, WI), a eukaryotic expression vector.
PCR-based site-directed mutagenesis was performed using primers carrying the specific point mutations (DN-N Ras: 5′-GTGGTGTTGGGAAAAACGCACTGACAAT-3′, 5′-GGATTGTCAGTGCGTTTTTCCCAACACCA-3′; CA N-Ras: 5′-GGTGGTTGGAGCAGTTGGTGTTGGGAAA 3′, 5′- CTTTTCCCAACACCAACTGCTCCAACCAC-3′) and high accuracy polymerase PfuUltra II (Stratagene, La Jolla, CA). The thermocycle parameters were 95°C for 30 seconds, followed by 20 cycles at 95°C for 3 seconds, 55°C for 1 minute, and 68°C for 5 minutes. Colonies were picked for sequencing analysis, and plasmids containing correct point mutations were extracted by using a Plasmid Midi kit (Qiagen Inc., Valencia, CA).
Semiquantitative and quantitative real-time RT-PCR
Total RNA was extracted from cells in exponential growth phase using RNA Extraction kits from Ambion (Austin, TX) according to the manufacturer’s protocols. A 2-step RT-PCR method was used: cDNA was synthesized using SuperScript III Reverse Transcriptase (Invitrogen Corp.) and used as a template for the next PCR step. Semiquantitative PCR was performed with Go-Taq Green Master Mix (Promega Corp.) with standard parameters. 2 Primers used were H-Ras (5′-CTTGCTAAGTCCTGAGCCTG-3′, 5′-CA TCAGGAGGGTTCAGCTTC-3′), N-Ras (5′- CATGTTT GGTGCATAGAACTGG-3′, 5′-AGCTTGAGGTTCTTG CTGGT-3′), NF1 (5′-ACCTCACTTGCAACTTCCCAGC 3′, 5′-GCGGATCCGTGGCGAGTTCG-3′), and GAPD (5′-GTGAAGGTCGGAGTCAACGGATTTGG-3′, 5′-ATGCCAGTGAGCTTCCCGTTCAGCT-3′).
Quantitative real-time PCR was performed using a Step One thermocycler (Applied Biosystems, Foster City, CA) with Fast SYBR Green Master Mix (Applied Biosystems). Relative mRNA level of a target gene was measured by the standard curve method. Wild-type H- and N-Ras plasmids were serially diluted to generate the standard curve. Primers used were H-Ras (5′-CAGTCGCGCCTGTGAAC-3′, 5′-CCAGCTTATATTCCGTCATCG-3′), N-Ras (5′-GCT TCCTCTGTGTATTTGCCA-3′, 5′-GCACCATAGGTACA TCATCCG-3′), vector (5′-GTGAAGGTCGGAGTCAAC GGATTTGG-3′, 5′-ATGCCAGTGAGCTTCCCGTTCAG CT-3′), and NF1 (5′-CAACTTCAATGCAGTCTTTAGTCG 3′, 5′-GCTGTTTCCTTCAGGAGTCGT-3′). Each reaction was done in triplicate.
Stable transfection
Wild-type N- and K-Ras and DN- and CA-N-Ras constructs were generated as described above. Plasmids containing NF1 shRNA constructs were purchased from Sigma-Aldrich Corp. Cells were transfected with plasmid using Lipofectamine 2000 (Invitrogen Corp.) according to the manufacturer’s instructions; stable transfectants were selected with 100 to 500 μg/mL Geneticin (G418, Invitrogen Corp.) or 1.0 to 5.0 μg/mL puromycin (Sigma-Aldrich Corp.). Selected populations and/or transfected clones isolated using cloning cylinders were used for further experiments.
Transformation assay
Anchorage-independent growth ability was measured by growth in soft agar (0.33% Bacto agar, Becton, Dickinson and Co., Sparks, MD). 2 Mean CFE (the number of colonies divided by cell inoculum × 100) was determined in duplicate in 2 to 4 independent experiments.
Protein degradation rate measurements of neurofibromin
Neurofibromin protein degradation was investigated with the proteasome inhibitor MG132 (Sigma-Aldrich Corp.), which inhibits ubiquitin-proteasome–dependent protein degradation. 32 Briefly, cells were treated with MG132 at a final concentration of 10 µM for 3 and 6 hours. Cells treated with DMSO (0.25%) for 6 hours were used as the control. The amounts of neurofibromin were measured by Western blot analysis (as described above). Actin was used as both the loading and negative control, and hsp72 was used as the positive control. Experiments were repeated 3 times.
Proliferation assays
PDT was calculated from the growthcurves as described previously. 2 Cell cycle progression was measured by a BrdU Cell Proliferation Assay kit (Chemicon International Inc., Temecula, CA) according to the manufacturer’s instructions. Briefly, cells were seeded into 96-well plates. A duplicate 96-well plate was used to determine the cell number. BrdU reagent was incubated with cells in logarithmic growth phase for 2 hours. After washes, incorporated BrdU was detected using a standard ELISA method. Results were normalized to cell number. Experiments were done in quadruplicates and repeated 3 times.
Apoptosis and necrosis assays
Cell death was determined with an Apoptosis & Necrosis Quantification Kit (Biotium Inc.) according to the manufacturer’s instructions. Briefly, cells were incubated with a mixture of FITC-Annexin V and Ethidium Homodimer III (EthD-III) for 15 minutes. Apoptotic (green) and necrotic (red) cells in 10 randomly chosen areas were counted using a fluorescent microscope; data were expressed as a percentage of total cell number counted under phase-contrast illumination.
Statistical methods
Statistical significance was determined by the Student t test. Sigma-Plot statistical software (Systat Software Inc., Chicago, IL) was used for regression analysis.
Footnotes
Declaration of Conflicting Interests
The author(s) declared no potential conflicts of interest with respect to the research, authorship, and/or publication of this article.
Funding
The author(s) disclosed receipt of the following financial support for the research, authorship, and/or publication of this article: This research was supported in part by a grant from the National Institutes of Health (CA77593).