
Abstract
Two or more drugs that individually produce overtly similar effects will sometimes display greatly enhanced effects when given in combination. When the combined effect is greater than that predicted by their individual potencies, the combination is said to be synergistic. A synergistic interaction allows the use of lower doses of the combination constituents, a situation that may reduce adverse reactions. Drug combinations are quite common in the treatment of cancers, infections, pain, and many other diseases and situations. The determination of synergism is a quantitative pursuit that involves a rigorous demonstration that the combination effect is greater than that which is expected from the individual drug’s potencies. The basis of that demonstration is the concept of dose equivalence, which is discussed here and applied to an experimental design and data analysis known as isobolographic analysis. That method, and a related method of analysis that also uses dose equivalence, are presented in this brief review, which provides the mathematical basis for assessing synergy and an optimization strategy for determining the dose combination.
Keywords
Introduction
Drugs that produce overtly similar effects are often given in combination. These include drugs for treating many conditions such as hypertension, pain relief, and cough suppression. Certainly almost all cancer chemotherapy and many antimicrobial regimens use multiple drugs given simultaneously. There is also a growing interest in drug combinations that might prevent cancer, as summarized in a recent Nature article by Gravitz, 1 and an increasing awareness that the use of synergistic drug combinations in treating cancer allows lower doses of each constituent drug and consequently lower adverse effects. When 2 or more drugs are given in combination the effect may be superadditive (synergistic); that is, they may demonstrate action that is above what is expected from their individual potencies and efficacies. In contrast to synergism, some drug combination may show subadditivity or simple additivity. When the combination effect is consistent with the individual drug potencies, we say that the interaction is simply additive. The term additivity does not mean the simple addition of effect magnitudes; instead, this term, which provides the basis for assessing synergism and antagonism, is derived from the more basic concept of dose equivalence and the quantitative modeling that follows from it. That concept and its application to the quantitative evaluation of drug combinations are the aim of this brief review. Additivity and departures from it require a precise quantitative analysis that is described here. This kind of analysis has a long history, and the methods used continue to be expanded. It should first be noted that a drug effect, whether due to a single drug or to a combination, is understood to be a change in some measurable attribute of the system under study, such as a reduction in systolic blood pressure, a change in heart rate, a reduction in tumor size, measured cell antiproliferation, induction of apoptosis, a reduction in DNA replication, a measurable change in pain perception, and so on. Thus, a well-defined metric for defining the effect magnitude is necessary in determining departures from simple additivity.
Some drug effects are desirable whereas others are undesirable. The adverse effects of chemotherapeutic drugs are well documented, and some of these such as neuropathic pain present a real challenge that has been somewhat addressed in some of the author’s collaborative preclinical studies. 2 The ideal situation is one in which the drug combination synergizes the desired effect but exhibits subadditivity for the undesirable effects. A quantitative approach to that ideal situation is discussed in a later section of this communication. Much experience has shown that synergism (or subadditivity) is not merely a property of the 2 drugs. It also depends on the doses of each in the combination.3-7 In this discussion we present the most common quantitative methods that guide the experimental design and the data analysis that are used in quantitative drug combination studies. These constitute a generalization and expansion of the method of isoboles. This method is a nonmechanistic approach, that is, a procedure that uses the dose-effect data of the individual drugs. The potency and efficacy information derived from the individual dose-effect curves allow a determination of the expected combination effect or dose combination that produces a specified effect. This expected effect (termed additive) is then statistically compared with the observed drug combination data, thereby indicating whether a departure from additivity such as synergism or subadditivity has occurred. Although this well-known approach is not based on explorations of intimate mechanisms, the detection of a nonadditive interaction is an important first step in the further exploration of mechanism. The needed mathematical/statistical aspects have been kept to a minimum in the text; instead, that detail is given as a supplement for the reader who desires this information (see supplement and Suppl. Fig. S1).
Drug Combination Analysis: Isoboles
The most common method for the quantitative assessment of unusual interaction between agonist drugs is the method of isoboles. This is a graphical procedure, introduced and developed by Loewe,8-10 that uses the dose-effect relation of each drug (alone) in order to derive the set of dose combinations that are expected to give a specified effect level. Most often the selected effect level is 50% of the maximum effect, and the doses of each full agonist drug that individually give this effect are therefore their ED50 doses. In its simplest form this procedure uses the ED50 doses of the individual drugs and uses these as intercept values on a Cartesian coordinate system in which doses are represented on the x- and y-axes. The straight line connecting these intercepts represents the set of points (dose pairs) that give the specified effect (50% of Emax) when there is no interaction between the drugs. This line, called an isobole, conveys numerical information that shows the reduction in the required dose of one drug that accompanies the presence of a dose of the second drug. Understandably this line has a negative slope since the increase in quantity of Drug A means that a lesser quantity of Drug B is needed to achieve the specified effect level. If we denote the intercepts by

where a is the dose of Drug A and b is the dose of Drug B when the 2 are present together (Fig. 1). If an effect level other than 50% of the maximum is used, then this equation still applies and denotes the dose pair (a,b) that gives that particular effect level where the A and B are now the respective individual doses for that effect level. The isobole expressed in Equation 1 allows the assessment of superadditive and subadditive interactions when actual combination doses are tested. If testing shows that the specified effect of a combination is achieved by a dose pair that plots as a point below the isobole, this means that the effect was attained with doses less than those on the line, a situation that denotes superadditivity or synergism. In contrast, an experiment may show that greater combination doses are needed to produce the specified effect and therefore this dose pair plots as a point above the isobole line. Dose pairs that experimentally lie on the line (or not significantly off the line) are termed additive, a situation that means no interaction between the 2 drugs. These cases are illustrated in Fig. 1. Other forms of Equation 1 have been used; for example, one may use an expression for the total dose (a + b) for any fixed ratio combination of doses. These forms are contained in the author’s monograph. 4 The reason that a point on the line is termed additive is explained subsequently. But first we ask, why is Equation 1 the basis for defining a zero interaction, and, further, how is this equation derived? The answer to these questions is contained in the section below, which discusses the concept of dose equivalence.
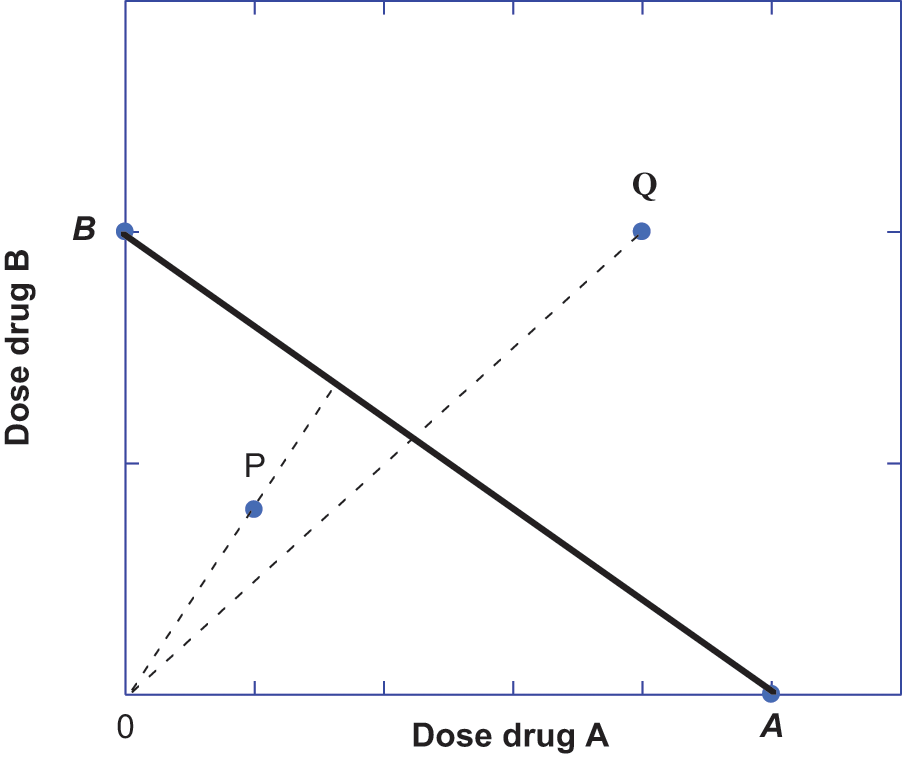
Dose pairs (a,b) that plot as points on the isobole (solid line for a specified effect with intercepts A and B) represent combination doses that are additive when the 2 drugs have a constant potency ratio. Dose pairs that preserve a constant dose ratio are indicated by the radial lines for 2 different fixed-ratio dose combinations. If achievement of the specified (e.g., 50% Emax) occurs with lesser doses, such as point P below the isobole, then the dose combination in that fixed dose ratio is superadditive (synergistic). Another fixed ratio dose combination may show a dose pair that attains this effect with a dose pair (a,b) that lies above the isobole (such as point Q), and this dose combination indicates subadditivity.
Dose Equivalence
The analysis leading to the isobole is derived from dose-effect data of each compound using some well-defined effect metric such as cell antiproliferation or induction of apoptosis as the effect. The dose-effect relations of the individual drugs are first determined, and, in many cases, it is found or assumed that these have a constant potency ratio, which means that at any effect level, the equally effective doses (a of Drug A and b of Drug B) show a constant dose ratio: a/b = R. This constant potency ratio is an attribute of the common dose-effect model: E = Emax a/(a + A) for Drug A and E = Emax b/(b + B) for Drug B. From these equations it is seen that the Drug B–equivalent of dose a is aB/A so that a combination of dose a and dose b acts like a total quantity of Drug B given by the sum, b + aB/A. In order for this sum to attain the 50% effect level, it must equal dose B (i.e., b + aB/A = B), and it is this expression that leads to the linear isobole of Equation 1. The derivation leading to this equation makes clear that the actions of the individual agents are assumed to be “similar and independent,” a concept recognized and discussed by Bliss 11 in his description of the joint action of toxins. In other words, the agonists do not act through a common receptor, and they are assumed to display the same potency in combination that they have in individual assays. Other forms of Equation 1 can be used, for example, an equation for the total dose (a + b) of the point (a,b) on the isobole. These forms and the associated error analysis are discussed in the author’s monograph. 4 A concise summary of the mathematical concepts is contained in the appendix to this article.
The linear isobole is easy to construct and was described in detail by Loewe, 9 but that discussion did not include an explicit mathematical derivation. Also, a rather cumbersome notation used by Loewe seems to have prevented a clear understanding of its basis and that fact may account for its initial limited application. The method of isoboles ultimately gained popularity when Gessner and Cabana 12 used it to assess toxic and hypnotic interactions between chloral hydrate and ethanol. A further review by Gessner 13 amplified details on the use of the isobologram. A number of other investigators applied this method: Adams et al 14 studied combinations of opioid mu and delta agonists in a rat analgesic assay; Fairbanks and Wilcox 15 examined antinociceptive combinations of morphine and clonidine in tolerant mice; Hammond et al 16 studied antinociceptive combinations of delta 1 and delta 2 opioid receptors in mice; Kimmel et al 17 tested combinations of buprenorphine and cocaine on locomotion in the rat. Antinociceptive combinations of morphine and clonidine were also tested,18,19 and Wilcox et al 20 examined this same combination using motor and sensory responses in the rat. Porreca et al 21 studied antinociceptive combinations of combinations of morphine and[Leu5]-enkephalin, and Raffa et al 22 examined combinations of the enantiomers of tramadol. More recent studies include work by Woolverton et al,23,24 in which various combinations including cocaine and remifentanil were examined in protocols involving self-administration in monkeys. Tanda et al 25 examined combinations of cocaine and other dopamine uptake inhibitors in mice.
The works cited above represent only a partial list of studies in which the linear isobole was used to distinguish between additive and nonadditive drug interactions. In all of these studies the potency ratio was found to be constant or could reasonably be assumed to be constant so that the simple linear isobole of additivity applied in the assessment of superadditive and subadditive combinations. A special case is that in which 1 of the 2 drugs lacks efficacy in producing the effect. In that case the linear isobole is a horizontal line whose intercept is the ED50 of the active agent. This situation was found in our study in which glucosamine, which lacks antinociceptive efficacy, was paired with ibuprofen in the mouse abdominal constriction test. 26 This study demonstrated synergism, and that finding formed the basis of a U.S. patent for this drug combination.
Curved Isoboles
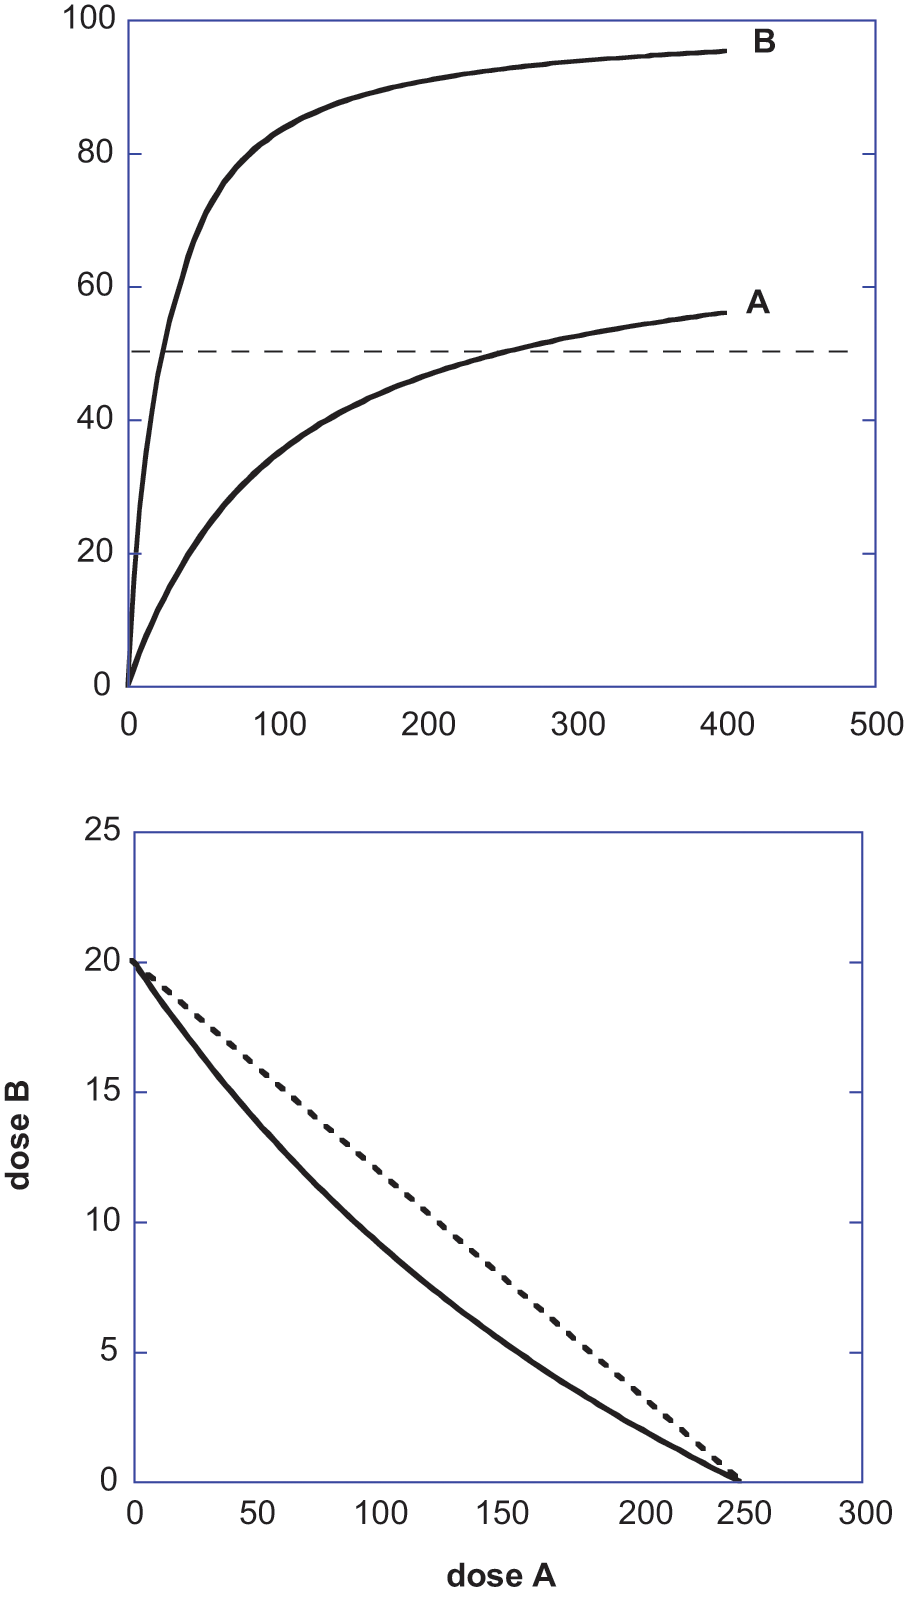
In this section is a summary of our work showing that the isobole of additivity is not necessarily linear 27 and, therefore, that the use of Equation 1 as the basis for defining nonadditive drug interactions is sometimes incorrect. Toward this end we consider 2 agonist drugs whose maximum effects differ such as those shown as Drug A and Drug B in Fig. 2. To derive the isobole for this case we proceed as before by using the common dose-effect model equation with maximum effects denoted EA for Drug A and EB for Drug B. The constants for the doses that give the individual half maximum effect of each are denoted CA and CB, respectively. Thus, for Drug A we have E = EA a/(a + CA) and for Drug B we have E = EB b (b + CB). (In the figure illustration, EA = 70, CA = 100, EB = 100, CB = 20.) The Drug B–equivalent of Dose a is no longer a constant multiple of a; instead it is given by the expression below, which shows its dependency on Dose a.
(
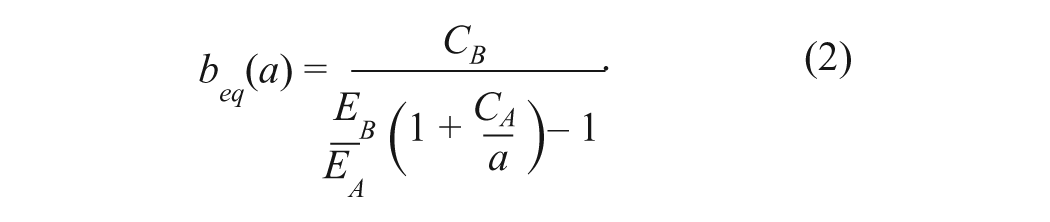
When beq(a) is added to the dose b, this sum must give ED50 of Drug B (which is CB) and from this we get the isobole equation 27 shown as Equation 3. It is indicative of a simply additive interaction and derived this name from the fact that it comes from adding b and beq(a).
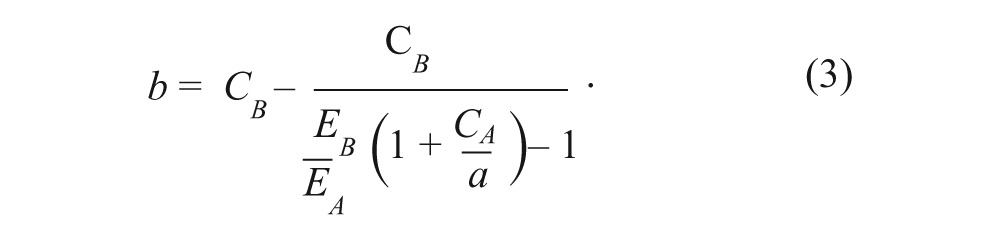
It is seen that Equation 3 is nonlinear. This form, derived by Grabovsky and Tallarida, 27 is even further generalized in that publication to apply to parent dose-effect equations that contain Hill coefficients (exponents p and q on the respective dose and C terms). The curved isobole of Fig. 2 is an illustration produced from Equation 3 for the drug parameters given in the figure legend. It is notable that the derivation of Equation 3, which is quite straightforward, uses the same concept (dose equivalence) that was used in deriving the linear isobole of Equation 1. This demonstration points out that interactions that represent departures from additivity should not begin with the form given in Equation 1 unless it is first established that the parent dose-effect relations exhibit a constant potency ratio.
A View from the Effect Scale
The isobole provides the view of the additive dose combinations (points on the line) that give a specific effect level such as 50% of the maximum and, thus, this curve becomes the basis for detecting departures from additivity such as synergism or subadditivity. An alternate approach views the dose combination on the effect scale. This approach, however, does not mean the direct addition of effects. (For example, if Dose a gives a 70% Emax effect and Dose b gives 75% Emax effect, the addition of these percentage effects is without meaning.) A visual that illustrates the correct way of determining combination effects is illustrated below. In this example, explained in detail below, we show how 2 agonists with different efficacies and potencies yield the expected (additive) effect when the drugs are simultaneously administered. The dose-effect parameters of each agonist are shown in the legend of Figure 3, and these values allow calculation of the Drug B–equivalent of each Dose a by using Equation 2. In the illustration we show 3 different fixed ratio dose combinations, and we have plotted the expected combination effect against the dose of the Drug A component.
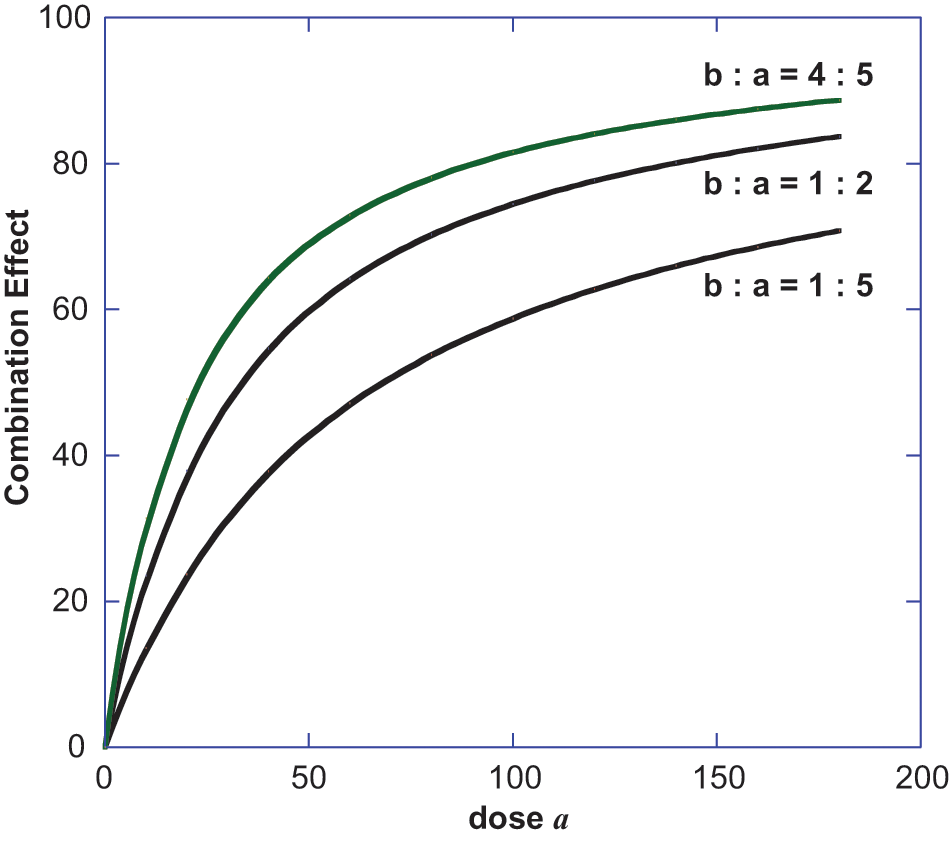
Illustration of how a fixed dose ratio combination of 2 agonist drugs are used in a calculation of the expected (additive effect) of a combination dose. The graphs are shown for 3 different fixed ratio dose combinations and are expressed and plotted in terms of the dose a of the lower efficacy drug. The drug parameters are for Drug A, EA = 60, CA = 100; for Drug B, EB = 100, CB = 20. Details of the calculation of the combined effect are given in the text.
To demonstrate how these curves were constructed, we illustrate with a value from the lower curve of Figure 3 where the ratio of Dose a to Dose b is maintained 5 to 1 (lower curve in the figure). Let’s start with a = 50, which therefore means that b = 10. We now calculate the b equivalent of a = 50 and find from Equation 2 that it is 5. This value is added to the actual dose of 10. This means that the combination, if additive, acts like the total dose of b = 15, and that gives effect = 42.86 by substitution in Drug B’s dose-effect equation. Other values of a are used in the same way to calculate the expected effect, and this process gives the curve shown. The other 2 dose ratios shown led to the other 2 curves. This way of deriving the additive dose-effect curve for a given dose ratio is useful because it then allows a comparison with the actual dose-effect curve for that combination. This view from the effect scale, although less common than analysis with isoboles, is just as useful. It is theoretically equivalent to isobolar analysis and is sometimes more readily applied to the experimental design that is used. For example, this author adopted this approach in a study 25 that examined dopamine release by the combination of cocaine and the cocaine analog, WIN 35,428. Each agent alone produces graded dose-effect results (enhanced dopamine concentration). From the pair of dose-effect curves, we calculated the additive effect of the tested dose pair. The additive effect thus determined from several dose combinations was then used in a comparison with the experimentally derived effect (dopamine concentration), which was generally greater than these calculated additive effects, a finding suggestive of synergism.
Optimizing the Drug Combination Dose Ratio
It is well known that synergism (or subadditivity) for a drug pair is not only dependent on the agonist drug pair; it also depends on the ratio of the doses. A good example is afforded by our analgesic studies using the combination tramadol and acetaminophen, where it was found that several dose ratios were synergistic, whereas others were simply additive. 28 This concept is useful in the development of an optimization strategy. By this we mean finding the range of dose ratios that are synergistic for the desired effect but subadditive for the toxic effects. In this regard the isobologram provides a useful view of the strategy and this is illustrated in Fig. 4. A fixed ratio dose combination is defined by each radial line. In other words the isobole plot, whose axes are doses of the respective drugs, shows the dose combination as the radial line for the particular dose ratio being tested. The intersection of that radial line with the isobole defines the additive dose combination and thereby allows a view of either superadditive (synergistic) or subadditive for the point (dose combination) that is observed to give the specified effect. As previously mentioned, a point below indicates synergism whereas a point above indicates subadditivity. Most often there is a range of dose combinations that are synergistic and other ranges that are either additive or subadditive. Using the range that is synergistic we obtain a sector on the isobologram. That sector (pie-shaped region) therefore gives all dose ratios that are synergistic in producing the effect. If a similar procedure is applied to an adverse effect, we can identify the dose combination range (sector in the plot) that is subadditive. The optimal choice of dose ratio is therefore the intersection of these 2 sectors. That intersection shows synergy for the desired effect and subadditivity for the adverse effect. This view is illustrated in Fig 4. In that illustration it is assumed that that synergism for the desired effect has been found for dose ratios contained within radial lines (C) and (D), whereas the toxic effect is subadditive within the dose ratios indicated between radials (A) and (B). The intersection of these sectors is therefore a set of dose ratios that maximizes the desired effect and minimizes the toxic effect.
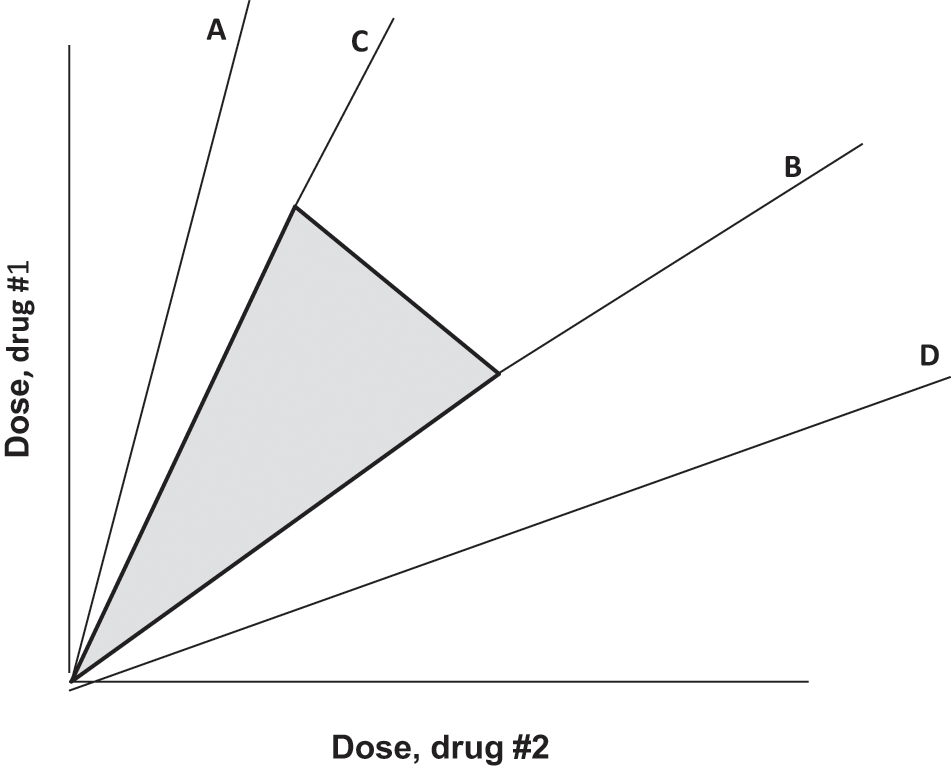
Illustration in which synergy for the desired effect is found to exist for dose combinations in the region between radial lines C and D, whereas the toxic effect is subadditive only between radial lines A and B. The intersection is the region between C and B, and therefore dose combinations in this intersection, with practical upper limits, are a region (shown shaded) that is optimal for selecting dose ratios.
Summary and Discussion
The assessment of drug combinations for determining synergy is a quantitative pursuit. This determination requires a quantitative approach that begins with the individual dose-effect curves from which the combined additive effect is calculated. If the combined effect observed is significantly greater than the expected (additive) effect, there is synergism. This analysis follows from the individual drug’s dose-effect relations and the concept of dose equivalence. Additivity is most often viewed as an isobole, which is a plot of individual doses that give a specified effect. Thus, additivity may be viewed on the dose scale as an isobole or on the effect scale. When synergism is detected, it is almost always dependent on the dose ratio of the combination that is tested and, thus, this information allows a determination of dose combinations that are optimal. Other approaches are available for exploring synergistic interactions. One that has been extensively quoted is based on a mechanistic model arising from mass action, Michaelis-Menten kinetics, Henderson-Hasselbalch equation, and the Hill equation. The interested reader is referred to this more theoretical approach 29 for examining multiple drug-effect systems.
Footnotes
Declaration of Conflicting Interests
The author(s) declared no potential conflicts of interest with respect to the research, authorship, and/or publication of this article.
Funding
Supported in part by 2P30 DAO13429, NIH/NIDA.
References
Supplementary Material
Please find the following supplemental material available below.
For Open Access articles published under a Creative Commons License, all supplemental material carries the same license as the article it is associated with.
For non-Open Access articles published, all supplemental material carries a non-exclusive license, and permission requests for re-use of supplemental material or any part of supplemental material shall be sent directly to the copyright owner as specified in the copyright notice associated with the article.