
Abstract
ThePAX8/PPARγ fusion protein (PPFP) occurs in 36% of human follicular thyroid carcinoma (FTC) and is associated with favorable prognosis. To elucidate the function of PPFP in FTC, we analyzed the consequences of PPFP expression in immortalized thyrocytesin vitroandin vivovia xenograft tumorigenesis. While PPFP-expressing cells exhibited oncogenic hallmarks, including increased growth and decreased apoptosis,in vitro, xenograft tumors were initiated but not sustainedin vivo. PPFP xenograft tumors exhibited reduced CD31 staining and VEGF expression, suggesting that PPFP modulates neovascularization. Microarray analysis demonstrated increased expression of tissue inhibitor of metalloproteinase (TIMP-3), an inhibitor of angiogenesis, in PPFP cells and tumors, a finding confirmed by quantitative PCR and immunohistochemistry. Immunohistochemical staining of archival human thyroid tumors demonstrates a significant decrease in CD31 staining in all adenomas and carcinomas containing the PAX8/PPARγ rearrangement. Decreased angiogenesis in PPFP-containing tumors is directly correlated with our observations in the xenograft model and provides evidence for the first time that PPFP may impact FTC tumorigenesis by modulating angiogenesisin vivo.
Keywords
Introduction
Follicular thyroid carcinoma (FTC) accounts for 20% of all thyroid cancers but is associated with 40% of the deaths. ThePAX8/PPARγ fusion protein (PPFP) is detected in about 40% of FTC 1 and arises through a balanced chromosomal translocation, t(2;3)(q13;p25), fusing the 5′ portion of the thyroid-specific transcription factor genePAX8in frame with the entire translated reading frame of the peroxisome proliferator-activated receptor gamma (PPARγ) nuclear receptor gene.2,3Chromosomal aberrations (translocations, inversions, deletions) are usually thought to be associated with malignant potential. 4 Papillary thyroid carcinoma (PTC), the most common thyroid cancer morphotype, is associated with 3 different rearrangements: RET/PTC,NTRK1, andBRAF. 5 However, unlike these rearrangements that are shown to drive PTC initiation and progression, it is not yet known whether PPFP expression in FTC is sufficient to cause malignant transformationin vivo. Most studies to date have dealt with PPFP effectsin vitro, demonstrating that transient expression of PPFP is oncogenicin vitro, leading to increased cell proliferation, decreased apoptosis, and decreased anchorage dependency. 2,6-8 However, studiesin vivohave been restricted to the clinicopathological evaluation of FTC in the context of PPFP expression. Although some of these studies correlate the presence of PPFP with more aggressive cancers, 9-11 the majority indicate that PPFP expression is correlated with mildly invasive FTC tumors with a more favorable prognosis, 12-17 indicating a potential role for PPFP in the modulation of FTC tumorigenesis.
There are currently no cell culture models available that express PPFP for use in mechanistic studies. The present study sought to address this lacuna by generating a biological model of immortalized thyrocytes, permanently expressing PPFP. This model was then used to study the consequences of PPFP expression in terms of oncogenic potentialin vitroand tumorigenic potential using a xenograft modelin vivo. The observations from the cell culture and mouse xenograft studies were then verified in archival human thyroid tumors to elucidate PPFP function in the physiological context. Our study demonstrates for the first time that PPFP expressionin vivois associated with decreased vascularization and provides insight into the potential pathways involved in this PPFP function in FTC tumorigenesis.
Results
PPFP Expression in Immortalized Thyrocytes Enhances Oncogenic PotentialIn Vitro
We transfected the pPPFP construct (Fig. 1A) into immortalized thyrocytes (NT) to generate NT-PPFP stable cells that express PPFP (Fig. 1B) and compared them with NT-vector cells. We compared cell growth, apoptosis, colony formation in soft agar, and matrix invasion for NT-PPFP and NT-vector cells. The NT-PPFP cells showed a 1.2-, 1.4-, and 1.6-fold (P<0.005) increase in cell growth at 48, 72, and 96 hours with a 2.6- to 2.3-fold (P<0.005) lower rate of apoptosis at 72 and 96 hours, respectively, compared to NT-vector cells (Fig. 1 CandD). The NT-PPFP cells formed a significantly (P<0.005) higher number of colonies in soft agar (Fig. 1E), which was increased by 3-fold over vector cells. In the matrigel assay, NT-PPFP cells exhibited 3.5-fold (P<0.005) increased invasion indices compared to the vector control cells (Fig. 1F). The results show that permanently transfected NT-PPFP cells exhibit oncogenic characteristics very similar to those of transiently transfected NT cells. 8
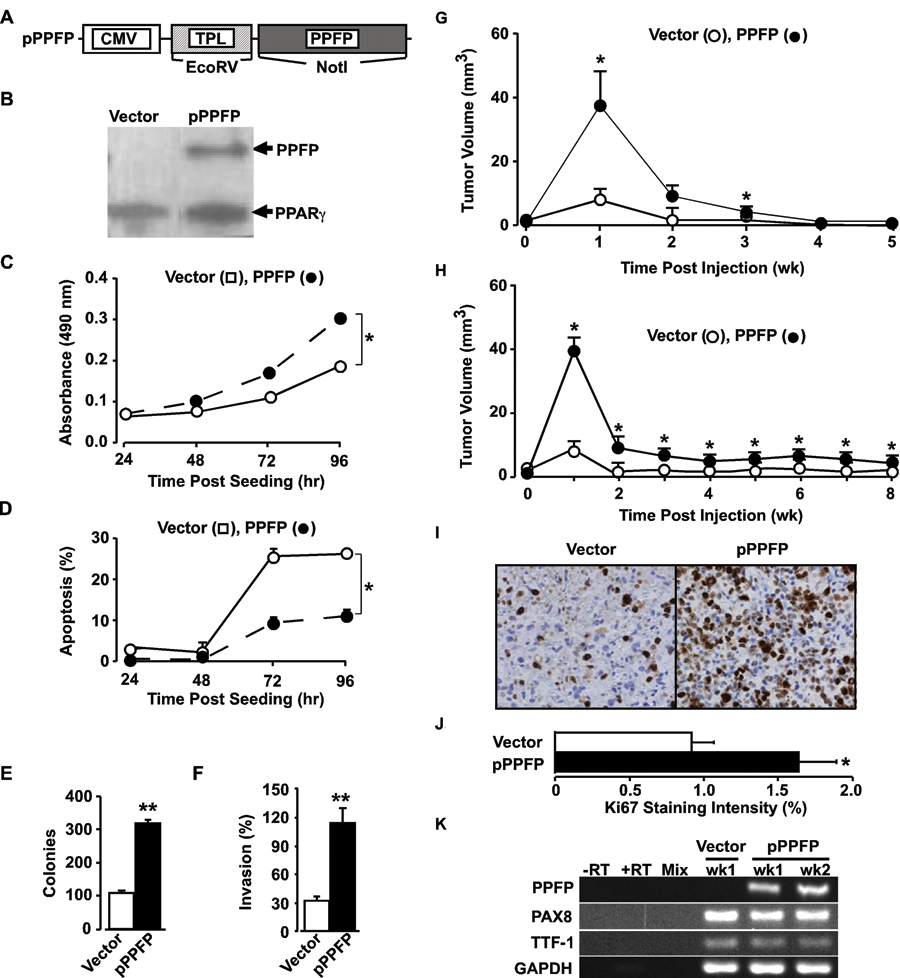
PPFP expression enhances oncogenic activityin vitro, initiates, but does not form sustained tumorsin vivo. (
Enhanced Oncogenic Potential of PPFPIn VitroDoes Not Result in Sustained TumorigenesisIn Vivo
Subcutaneous injection of athymic nude mice with NT-PPFP cells led to the development of tumors that were 4 times larger than NT-vector cell-induced tumors by week 1 (Fig. 1G). However, tumors were not sustained, with complete involution occurring by week 4. Involution of the NT-PPFP–associated tumors was slower than that of the control group. Resuspension of NT-PPFP cells in 50% matrigel prior to tumor induction did not alter tumor initiation or growth (Fig. 1H). Tumor volume data were subjected to analysis of variance for repeated measures, which demonstrated differences at theP<0.05 level forpost hocBonferroni tests at individual time points. Tests for the time versus interaction of NT-PPFP and NT-vector were highly significant with and without matrigel (P= 0.0006 and 0.0001, respectively). Ki67 staining of the xenografts (Fig. 1I) clearly demonstrated a 1.8-fold (P<0.05) increase in the NT-PPFP tumors (Fig. 1J), indicating that cell proliferation was responsible for the difference in xenograft size. Expression of PPFP, PAX8, and TTF-1 mRNA was also evaluated in tumors at weeks 1 and 2 (Fig. 1K), demonstrating that lack of tumorigenesis was not due to loss of PPFP expression in the xenografts as the tumor progressed and that the thyroid phenotype of the tumors was not changed after implantation (Fig. 1K). Overall, the data suggest that in contrast to the oncogenic potential observedin vitro, PPFP is able to initiate tumor formation but is not able to sustain tumorigenesis in a xenograft mouse modelin vivo.
Initiation of Xenograft Tumorigenesis Is Dependent on Inhibition of PPARγ Function
Because our earlier observations demonstrated that PPFP acted at least in part through inhibition of PPARγ, 8 we evaluated NT cells expressing a dominant negative (DN) mutant of PPARγ (Fig. 2A) for its tumorigenic potential in the xenograft model. DN-PPARγ was efficiently expressed in the stable cells and readily detected by Western blot analysis (Fig. 2B). Reporter assays confirmed that activation of the PPARγ response element (PPRE) was significantly inhibited in both NT-PPFP (29%) and NT-DN-PPARγ (41%) cells (Fig. 2C), demonstrating that PPFP retains its dominant negative PPARγ function in the NT-PPFP cells and that DN-PPARγ is expressed in a functional manner in NT-DN-PPARγ cells. Although the NT-DN-PPARγ cells induced somewhat larger tumors compared to the NT-PPFP cells (Fig. 2D), the DN-PPARγ tumors also underwent spontaneous involution, with complete regression by week 4. Thus, NT cells expressing either PPFP or DN-PPARγ exhibit identical phenotypes, providing evidence that inhibition of PPARγ activity in these cells results in tumor initiation but not sustained tumorigenesis. However, because endogenous PPARγ activity was not completely suppressed in either NT-PPFP or NT-DN-PPARγ cells (Fig. 2B), these data raise the question whether complete inhibition of PPARγ would result in sustained tumorigenesis or whether other factors are responsible for the observed effects of PPFP expressionin vivo.
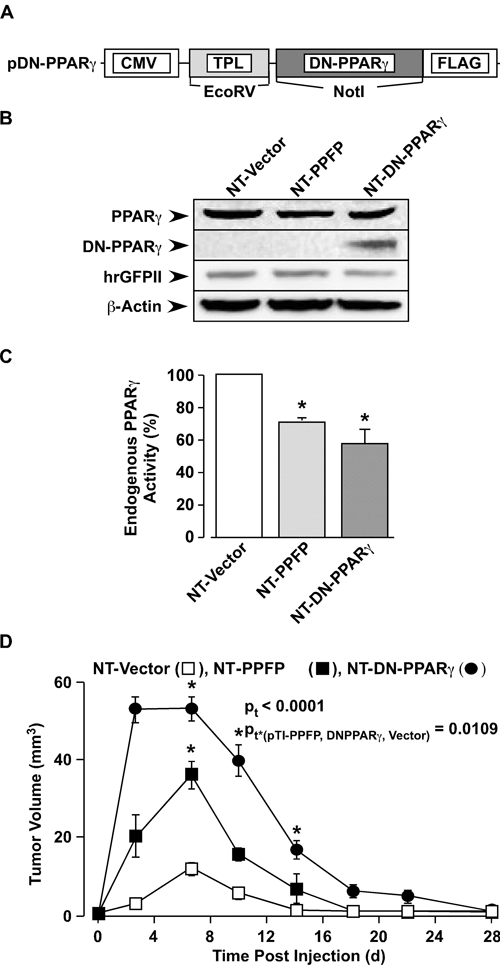
Dominant negative inhibition of PPARγ does not induce sustained tumorigenesisin vivo. (
PPFP-Expressing Tumors Have Decreased Angiogenesis and Neovascularization
Because tumor growth and progression are dependent on neovascularization, 18 we analyzed PPFP-expressing xenograft tumors at their peak size, for vasculature by immunohistochemical analysis of the endothelial cell–specific marker CD31 (platelet endothelial cell adhesion marker 1 [PECAM]) (Fig. 3A). Quantification of intratumoral microvessel density showed a significant reduction of 2.4-fold (P<0.02) in the PPFP tumors compared to the controls (Fig. 3B). Because vasculature is primarily controlled by expression of the vascular endothelial growth factor (VEGF), an angiogenesis-specific factor, we also quantified VEGF expression by immunohistochemical staining (Fig. 3C), which demonstrated a 1.4-fold reduction in VEGF expression in the NT-PPFP tumors (P<0.05) versus NT-vector tumors (Fig. 3D). RT-PCR confirmed a reduction in mRNA levels of the different VEGF isoforms in the NT-PPFP tumors at peak growth (Fig. 3 EandF).
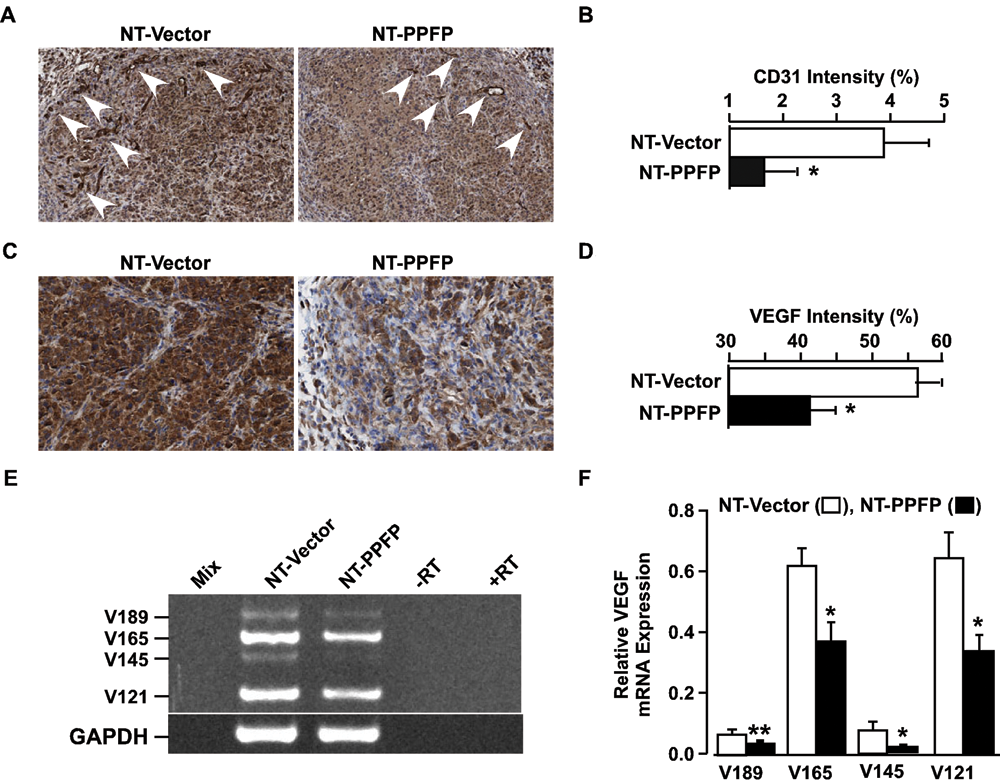
CD31 and VEGF expression is significantly reduced in PPFP xenograft tumors. (
To understand the possible mechanisms underlying the lack of sustained tumorigenesis and reduced neovascularization, we performed gene expression analyses of RNA from NT-PPFP and NT-vector cells. Differential regulation was observed in the expression of 67 genes, 8 of which are involved in angiogenesis (Supp. Table S1). These genes include proangiogenic PFKFB3, PDK1, NDRG1, BNIP3, and MALAT1, which were decreased 2-, 2.3-, 2.5-, 3.3-, and 4-fold, respectively, in NT-PPFP cells. Expression of antiangiogenic TIMP-3 was increased 2.6-fold, and 2 antiangiogenic genes, ADAMTS2 and PGK1, were down-regulated 2- and 4.5-fold, respectively, in the PPFP cells. TIMP-3 is known to inhibit expression of ADAMTS2, 19 which could explain its decreased expression in NT-PPFP cells, but the reason for lower expression of PGK1 is unknown. Because TIMP-3 is tightly bound to the extracellular matrix by interaction with heparan sulfate 20 and is an inhibitor of angiogenesis through blocking VEGF binding to the VEGF receptor-2, 21,22 it was studied further.
TIMP-3 transcript and protein expression were validated in NT-PPFP cells and tumors using real-time PCR and immunohistochemistry, which demonstrated a 6.5-fold increase (P<0.05) in mRNA (Fig. 4 AandB) and 1.6-fold increase (P<0.05) in protein (Fig. 4 CandD), respectively. TIMP-3 staining appeared to be predominantly cytosolic in the presence of PPFP compared to the vector-only controls.
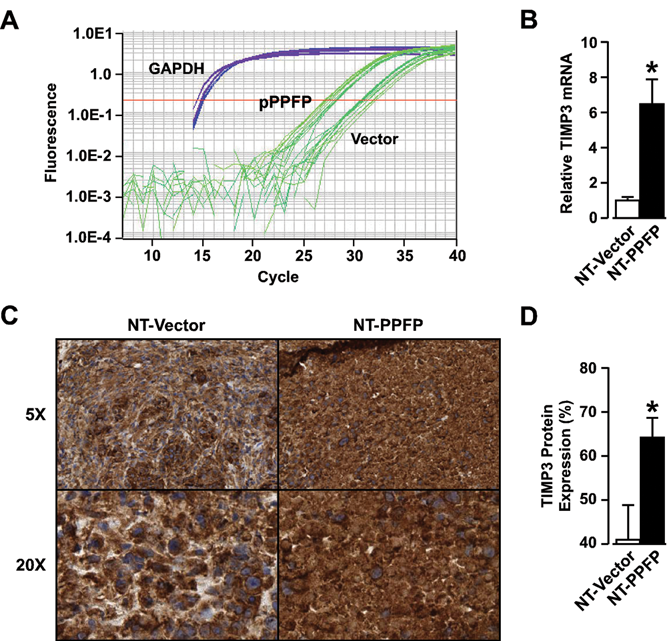
TIMP-3 expression is increased in NT-PPFP cells and xenograft tumors. Total RNA from PPFP-expressing cell lines was extracted and TIMP-3 transcript levels were detected by real-time PCR. (
Follicular Thyroid Tumors Expressing PPFP Have Decreased Microvessel Density
To begin to understand PPFP’s pathophysiological role in thyrocyte transformation and tumor initiation/progression, we evaluated a cohort of follicular adenomas (FA) and carcinomas (FTC) with and without PPFP for microvessel density (Fig. 5) and VEGF expression (Fig. 6). While both PPFP-containing FA and FTC demonstrated a 2.3- and 2.5-fold (P<0.05) decrease in microvessel density, respectively (Fig. 5F), only PPFP-FA showed a 1.3-fold (P<0.03) decrease in VEGF expression (Fig. 6F) similar to NT-PPFP cells. No significant differences were observed in VEGF expression in the FTC tumors (Fig. 6F). To understand the clinical implications of TIMP-3 expression and its regulation by PPFP in terms of follicular thyroid tumorigenesis, we evaluated the same thyroid tumors for TIMP-3 expression using immunohistochemistry (Fig. 7). While TIMP-3 expression was down-regulated 1.3-fold (P<0.005) in FTC containing PPFP, in concordance with other studies, 23 FAs containing PPFP had a 1.3-fold increase (P<0.005) in TIMP-3 expression compared to tumors lacking PPFP (Fig. 7F), similar to the NT-PPFP cells. The increase in TIMP-3 expression accompanied by decreased CD-31 and VEGF in the PPFP-FA suggests that the NT-PPFP cells could be representative of the PPFP adenomas and not carcinomasin vivo.
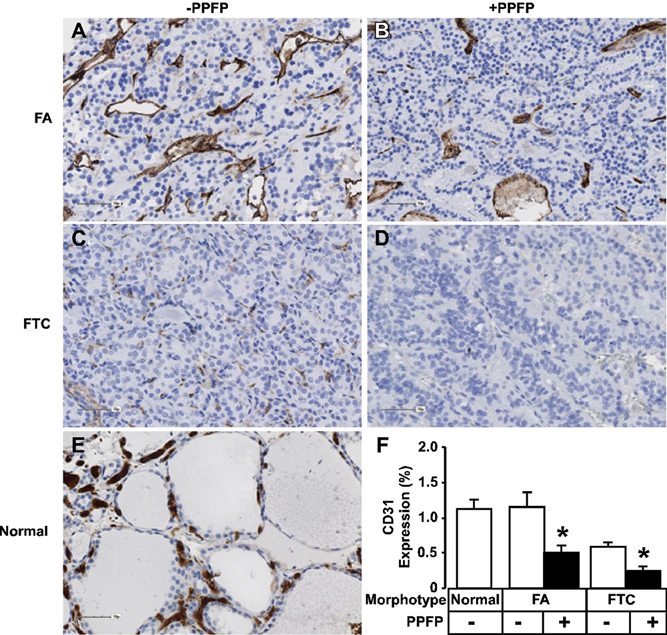
Microvessel density is reduced in thyroid tumors containing PPFP. Immunohistochemical analysis of FA (
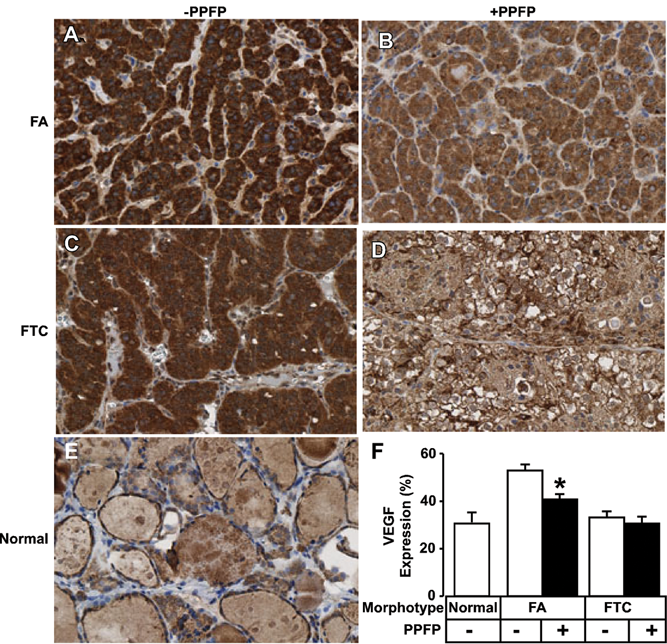
VEGF expression is reduced in follicular adenomas containing PPFP. Immunohistochemical analysis of FA (
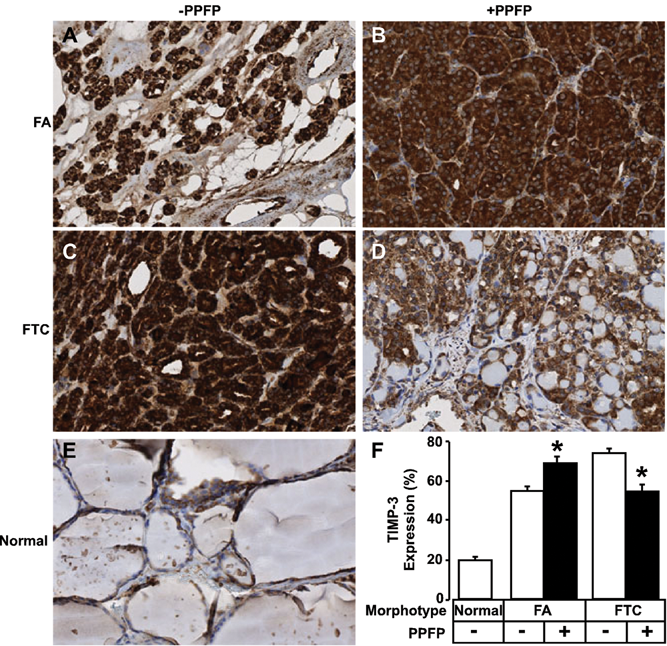
Follicular adenomas containing PPFP exhibit higher TIMP-3 expression. Immunohistochemical analysis of FA (
Discussion
Since the discovery of PPFP in FTC in 2000, 2 and the numerous studies that have demonstrated its presence in approximately 36% of FTC (reviewed 1 ), there has been considerable interest in understanding its role in thyroid tumorigenesis. Subsequently, it has also been found to be present in FAs (11%) and to a much lesser extent in Hürthle cell cancer (<2%), indicating that PPFP may be an initiating oncogene that requires additional secondary hits for complete transformation. Although there are multiplein vitrostudies that support its role as an oncogene, 2,6-8 the function of PPFP and its mechanism of actionin vivohave yet to be elucidated. Because there are currently no human thyroid tumor-derived cell lines available that express PPFP, we used immortalized thyrocytes to overexpress PPFP, thereby generating a biological model to assess PPFP functionin vivo. We evaluated the PPFP-expressing cells for their oncogenic potentialin vitroand tumorigenic potentialin vivoin a mouse xenograft model. Although the PPFP-expressing cells demonstrated enhanced oncogenic potentialin vitro, they initiated but failed to support sustained tumorigenesisin vivo, even in the presence of matrigel.
The NT cell line we have used as an experimental model is an immortalized cell line and therefore fulfills the criterion of unlimited replicative potential. 24 The large T antigen transformation used to immortalize these cells adds further growth regulatory dysfunction to the PPFP-related effects in the form of impaired RB and TP53 signaling. 25 Furthermore, thein vitroand, at least the initial,in vivodifferences in cell growth and behavior between PPFP-expressing and control NT cells suggest that the growth-promoting effects of PPFP do not overlap substantially with those due to the inherent RB and TP53 abnormalities of these cells.
Without angiogenesis, most tumors cannot sustain significant growth because of diffusion limitations of oxygen and essential nutrients. 26 Analyses of the NT-PPFP xenografts confirm that both neovascularization (as evidenced by CD-31 staining) and VEGF protein expression levels are significantly reduced. Moreover, gene expression analysis of the NT-PPFP cells demonstrated an increase in the expression of the tissue inhibitor of metalloproteinase, TIMP-3, a potent inhibitor of angiogenesis and tumor suppressor. Of the 8 differentially regulated genes involved in angiogenesis, we focused on TIMP-3 for further study because V189 and V165, the 2 extracellular matrix (ECM)– associated isoforms of VEGF, were down-regulated in the presence of PPFP, and TIMP-3 is known to inhibit VEGF-mediated angiogenesis by blocking the binding of VEGF to its receptor, VEGFR-2. 22,27,28 Chettyet al. showed that MMP-2 inhibition in lung cancer cells resulted in decreased induction of VEGF in endothelial cells that culminated in TIMP-3 induction, resulting in inhibition of p-AKT and induction of p-ERK1/2 leading to inhibition of angiogenesis and endothelial apoptosis. 21 Although we did not observe any significant change in MMP-2 activity in our zymogram studies (data not shown), we do see a significant decrease in VEGF expression in the PPFP xenografts. Because TIMP-3 is a known inhibitor of angiogenesis, 29,30 both the down-regulation of VEGF and up-regulation of TIMP-3 provide a plausible mechanism for the observed decrease in angiogenesis and neovascularization.
Early studies demonstrated that PPFP functions by dominant negative inhibition of PPARγ. 2,8 While more recent studies have confirmed the dominant negative mechanism, they have also provided evidence that PPFP can function as a partial agonist of both PAX8 and PPARγ pathways that is cell and promoter context dependent. 6,7 Because the NT-DN-PPARγ cells exhibit essentially identical behavior in nude mouse xenografts as the NT-PPFP cells, it is likely that the observed effects on initial tumor cell growth and subsequent involution are mediated at least in part via inhibition of PPARγ-dependent pathways. However, the possibility that PPFP directly affects selected PPARγ pathways cannot be excluded because PPARγ exhibits both positive and negative actions on both tumorigenesis 31 and angiogenesis. 32 Interestingly, both VEGF 33 and TIMP-3 34 contain PPARγ response elements (PPREs) in their promoter regions; however, how PPFP regulates these genes is unknown. While activated PPARγ inhibits VEGF protein secretion, 33 whether this is mediated at the transcriptional level is unknown, and the functional significance of the TIMP-3 PPRE remains to be established. The factors regulating TIMP-3 expression are incompletely understood. There is growing evidence that methylation of its promoter is frequent in a variety of cancers, including colorectal 35 and esophageal squamous cell carcinoma. 36 In thyroid cancer, methylation and subsequent silencing of TIMP-3 are significantly associated with aggressive papillary thyroid cancer (PTC), including extrathyroidal invasion and lymph node metastasis. 37 Thus, the increase in TIMP-3 expression in PPFP-FA is consistent with a tumor inhibitory role for PPFP.
To extrapolate our observations in the PPFP xenograft model to human thyroid tumors in a physiological context, we screened FAs and FTCs with and without PPFP for their relative expression of VEGF, CD31, and TIMP-3. As summarized inTable 1, CD-31 staining, a marker for microvessel density, 38 clearly shows that PPFP expression in both adenomas and carcinomas is associated with reduced vascularization. Also, PPFP-FA exhibited decreased VEGF with increased TIMP-3 expression similar to the NT-PPFP cells, suggesting that the NT-PPFP cells appear to be more closely related to PPFP-FA than PPFP-FTCin vivo(Table 1). Although there was no discernible relationship of the NT-PPFP cell microarray expression data when compared with the FA (unknown PPFP status) or FTC microarray data of Giordanoet al. 39 or Luiet al., 40 TIMP-3 down-regulation in FTC containing PPFP 34 correlates with the observation in the current study. Further evaluation of the clinical history of the tumor specimen used in this study did not demonstrate any differences in tumor size in either FA (2.5 ± 0.7 cm v. 3.5 ± 2.6 cm) or FTC (3.8 ± 2.8 cm v. 3.8 ± 1.5 cm), with or without PPFP, respectively, suggesting that although tumor size was not affected, the reduced neovascularization observed in PPFP-expressing FTC provides a plausible explanation for the evidence of favorable prognostic impact of PPFP, 12-17 in terms of better tumor differentiation and lesser invasiveness. Our findings that FA containing PPFP exhibit increased TIMP-3 expression and decreased neovascularization and angiogenesis suggest that the NT-PPFP cells mimic FA-PPFP and might be useful to identify the additional factors required for the transition of an adenoma to carcinoma, given that PPFP is also detected in 11% of follicular adenomas. 1
Effects of PPFPIn Vivoon Neovascularization Markers as Evaluated by Immunohistochemistry
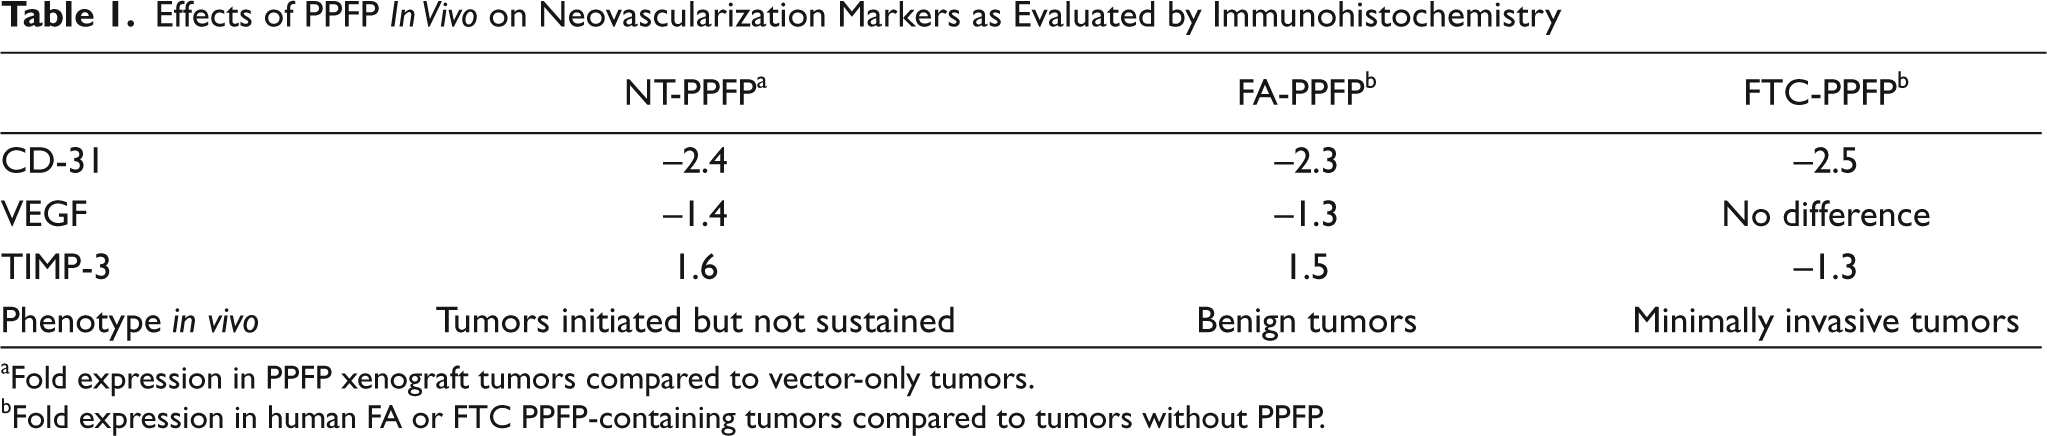
Fold expression in PPFP xenograft tumors compared to vector-only tumors.
Fold expression in human FA or FTC PPFP-containing tumors compared to tumors without PPFP.
In summary, by using a combination ofin vitroandin vivoPPFP models, followed by validation of the data in human tumors, we demonstrate for the first time that PPFP expression is associated with decreased vascularization and therefore may have potential implications on the prognosis and management of follicular thyroid cancer.
Materials and Methods
PPFP Expression Constructs
pPPFP (Fig. 1A) was constructed by subcloning thePAX8/PPARγ NotI fragment from pCR3.1/PPFP 2 into hrGFPII vector (Stratagene, La Jolla, CA). The adenovirus tripartite leader-intron (TI) sequence from pMT2 41 was removed with PvuII-EcoRI digestion, blunt ended with T4 DNA polymerase, and inserted into the EcoRV site of pPPFP. The dominant negative pDN-PPARγ lacking 16 C-terminal amino acids was generated from mouse PPARγ2 template by PCR using 5′-attgcggccgcttaatgggtgaaactctggga-3′ and 5′-ctgcggccgcctgtctctgtcttcttgatcacatg-3′ primers, producing a 1350-bp fragment with NotI ends. This fragment was cloned into hrGFPII vector, generating DN-PPARγ fused to FLAG. Plasmids were verified by DNA sequencing.
Cell Culture and Transfection
Human Nthy-ori-3-1 (NT) cells (#90011609; European Collection of Cell Cultures, Porton Down, UK) 42 were grown in RPMI-1640 medium (Invitrogen, Carlsbad, CA) supplemented with 10% FBS (Hyclone, Logan, UT) and 1X penicillin-streptomycin (Invitrogen) at 37 C in humidified conditions with 5% CO2. NT cells were seeded at 1 × 10⁶cells per 100-mm Petri dish and transfected 24 hours later in multiples of 6, with 10 µg each of vector, pPPFP, or pDN-PPARγ, using Fugene 6 (Roche, Indianapolis, IN). After 72 hours, NT-vector, NT-PPFP, or NT-DN-PPARγ cells were obtained by selection in media containing 400 µg/mL of G418 (Invitrogen) with media changes every 72 hours. Pools of cells were harvested and analyzed for mRNA expression by RT-PCR and protein by immunoprecipitation and/or Western blotting.
RNA Isolation, RT-PCR, and Quantitative PCR
RNA from each group of cells was isolated using TriZol Reagent (Invitrogen). RNA (1 µg) was reverse transcribed with oligo-dT primers using the Message Sensor RT kit (Ambion, Austin, TX).PAX8/PPARγ fusion gene was detected by PCR using 5 µL of cDNA and a sense primer from exon 7 ofPAX8, 5′-CGCGGATCCGCATTGACTCACAGAGCA-3′ and antisense primer from exon 1 ofPPARγ1, 5′-CCGGAATTCGAAGTCAACAGTAGTGAA-3′. Glyceraldehyde 3-phosphate dehydrogenase (GAPDH) was amplified using kit primers. Expression of TIMP-3 mRNA was evaluated using 5′-GCAGCAGCGGCAATGACC-3′ and 5′-CCGGATGCAGGCGTAGTGTTT-3′ primers. Xenografts were harvested at weeks 1 and 2 postinduction, homogenized in TriZol Reagent (Pierce, Rockford, IL), RNA extracted, and RT-PCR performed for PPFP, TIMP-3, and GAPDH as described above. Endogenous PAX8 expression was detected using a forward primer 5′-TTTCAATGGCAGAACTTCCC-3′ and reverse primer 5′-GGATGCTGTGCTCAAAGTA-3′ derived from the 3′-UTR of the PAX8 mRNA sequences not present in PPFP. Annealing temperature for PPFP, TIMP-3, PAX8, and GAPDH was 55 C for 30 seconds. PCR for TTF-1 and VEGF was carried out as described by Bhattacharyyaet al. 43 and Munautet al., 44 respectively. Real-time PCR was performed using 1 µL of cDNA and SYBR green reagent mix from ABI (Foster City, CA).
Protein Expression Analysis
Stable cells (2 × 10⁶per 100-cm Petri dish) were harvested at 24 hours postseeding in M-PER reagent (Pierce), and protein was quantified (Coomassie; Pierce). Protein expression was assayed by Western blotting. 8 PPFP and PPARγ proteins were detected using anti-PPARγ antibody (sc-7273; Santa Cruz Biotechnology Inc., Santa Cruz, CA). DN-PPARγ and actin were detected with anti-Flag M2 (Stratagene) and antihuman β-actin (Sigma-Aldrich, St. Louis, MO) antibodies, respectively. Presence of vector, pPPFP, and pDN-PPARγ were confirmed with anti-hrGFP antibody (Stratagene). Detection and densitometric analysis utilized the Kodak ISO 4000 instrument (Rochester, NY) with normalization to β-actin. For immunoprecipitation (IP), 1 mg of cell lysate was used and processed using protein A/G beads (Santa Cruz Biotechnology Inc.) as per the manufacturer’s specifications. IP products were resolved on a 4% to 20% SDS-polyacrylamide gel followed by Western blot analysis.
Cell Growth Assay
Cells were plated (5 × 10⁴per well) in 24-well plates. After 24, 48, 72, and 96 hours, cell viability was quantified by MTT (3-(4, 5-dimethylthiazol-2-yl)-2, 5-diphenyl tetrasodium bromide) (Sigma-Aldrich) per Denizotet al. 45
Apoptosis Assay
After 24, 48, and 72 hours, adherent and floating cells were harvested. Cells (106) were washed twice in binding buffer, biotin-annexin V (Trevigen, Gaithersburg, MD) was added (1:200), and cells were incubated for 30 minutes on ice and washed once before labeling with phycoerythrin-conjugated streptavidin (1:200) for 15 minutes on ice. Cells were washed and resuspended in 400 µL of binding buffer and analyzed by FACS.
Colony Formation Assay
Cells (104) were trypsinized, resuspended in 1 mL of 0.3% agarose/RPMI-1640, and layered onto a solidified bottom layer of 0.5% agarose/RPMI-1640 in 6-well plates. Normal growth media (1 mL) was added onto the gel, and media was changed twice a week. Colonies visible to the naked eye were identified, circled, verified by microscopic examination, and counted.
Invasion Assay
Matrigel inserts (#354480; BD Bioscience, Sparks, MD) were thawed and rehydrated along with an equal number of control inserts (#354578; BD Bioscience). Complete growth medium was added to the bottom of the wells and the chambers and control inserts were transferred to the wells. Cell suspensions (5 × 10⁴cells/mL) in serum-free medium were added to the chambers and incubated for 24 hours. Noninvading cells were scrubbed from the upper membrane surface, and cells on the lower membrane surface were stained with Diff-Quik stain (VWR Scientific, West Chester, PA) and air dried. Invading cells were counted and data expressed as percentage invasion compared to control cells.
Luciferase Reporter Assays
Cells (0.3 × 10⁶cells/well) in 6-well plates were transfected using LT-1 reagent (Mirus, Madison, WI) with 10 ng of Renilla (Promega, Madison, WI) and 100 µg of PPRE-Aco-Luc reporter2in triplicate. After 24 hours, cells were lysed and assayed using the dual luciferase kit (Promega). Data were calculated as a ratio of the luciferase to renilla expression and plotted as fold-change compared to vector.
In VivoXenograft Tumor Formation Assays
NT-vector, NT-PPFP, or NT-DN-PPARγ cells (107) were resuspended in 100 µL of growth media and injected subcutaneously into both flanks of 5-week-old athymic nude mice (Fox1nu/nu; Harlan, Indianapolis, IN). At least 3 mice were injected per group. Tumor size was determined weekly by measuring tumor length (L), width (W), and height (H) using vernier calipers (Vtumor= 0.5236LWH). For the matrigel experiment, 107cells (100 µL) were mixed with matrigel (#356230; BD Bioscience) in sterile growth media (100 µL). Animal studies were approved by the Mayo Clinic Institutional Animal Care and Use Committee.
Tumor Histology and Immunohistochemistry
Three mice per group (6 tumors) were formalin-fixed, paraffin-embedded, and individual sections stained with VEGF- (RB-222-P1, 1:100 dilution; Pierce), CD31- (sc-1506-R, 1:200 dilution; Santa Cruz), TIMP-3- (prediluted PA1-21136; Pierce), or Ki67- (MIB-1, 1:100 dilution; DAKO, Carpenteria, CA) specific antibodies for 30 to 60 minutes and counterstained with hematoxylin. Antigen retrieval was done in EDTA at 37 C for 30 minutes after deparaffinization. Sections were blocked with peroxidase for 5 minutes and protein for 5 minutes. Antibody staining was visualized using the DAKO EnVision plus System for 15 minutes followed by DAB chromogen for 10 minutes in the case of VEGF and CD31 staining. TIMP-3 and Ki67 antibody binding was visualized using the DAKO EnVision plus Dual Link System for 15 minutes followed by DAB and HRP chromogen for 5 and 15 minutes, respectively. Separate tumor sections were stained with hematoxylin and eosin to visualize tumor histology.
Stained slides were scanned using the Hamamatsu NanoZoomer (Bacus Laboratories Inc., Chicago, IL). Digital images composed of multiple tiles (4096 × 64 pixels) were captured at 20x magnification. Image analysis was conducted according to Monahanet al. 46 For each tumor section, the relative signal intensity from 10 randomly chosen fields (205 × 300 pixels) was quantified by histogram analysis (Adobe Photoshop, San Jose, CA). Data were expressed as signal intensity (signal pixel count divided by total image pixel count).
Six FAs (3 expressing PPFP) and 18 FTCs (8 expressing PPFP) were stained for TIMP-3, CD-31, and VEGF expression. Ten fields per FA and 4 fields per FTC were quantified using pixel color intensity as described above. Studies with the human specimen were approved by the Institutional Review Board.
Gene Expression Arrays
RNA (5 µg) from 3 different passages of NT-vector and NT-PPFP cells was submitted to the Mayo Clinic Microarray Core Facility for quality control and gene expression analysis on human U133plus2.0 chips (Affymetrix, Santa Clara, CA). Data were analyzed with Partek software (St. Louis, MO) using a Bonferroni correction for multiple comparisons with a false discovery rate of <0.05. Only genes exhibiting a ≥2-fold change were considered.
Statistics
Quantitative variables, including cell viability, apoptosis, soft agar colony formation, matrigel invasion, mouse tumor volumes, and immunohistochemical staining intensities were analyzed with a Student 2-sample pairedttest. Xenograft tumors were compared by analysis of variance for repeated measures (SAS 9.1.3, Cary, NC) to assess the effect of PPFP expression. All values withP<0.05 were considered significant.
Footnotes
Acknowledgements
The authors express their appreciation to Dr Shankar and Mr Rakhshan Rohakhtar at the Mayo Clinic Microarray Core Facility. They are grateful to Ms Bridget Hoesley at the Mayo Clinic TACMA Core Facility for her technical assistance with the immunohistochemistry studies. They thank Dr Henry J. Hiddinga for assistance with the animals.
The author(s) declared no potential conflicts of interest with respect to the authorship and/or publication of this article.
This work was supported by a grant from the American Thyroid Association (H.V.R.) and NIH grant CA80117 (N.L.E.).
Figures 1, 3-7 appear in color in the online version of this article.
References
Supplementary Material
Please find the following supplemental material available below.
For Open Access articles published under a Creative Commons License, all supplemental material carries the same license as the article it is associated with.
For non-Open Access articles published, all supplemental material carries a non-exclusive license, and permission requests for re-use of supplemental material or any part of supplemental material shall be sent directly to the copyright owner as specified in the copyright notice associated with the article.