
Abstract
Identification of the proteins that are associated with estrogen receptor (ER) status is a first step towards better understanding of the hormone-dependent nature of breast carcinogenesis. Although a number of gene expression analyses have been conducted, protein complement has not been systematically investigated to date. Because proteins are primary targets of therapeutic drugs, in this study, we have attempted to identify proteomic signatures that demarcate ER-positive and -negative breast cancers. Using highly enriched breast tumor cells, replicate analyses from 3 ERα+ and 3 ERα− human breast tumors resulted in the identification of 2,995 unique proteins with ≥2 peptides. Among these, a number of receptor tyrosine kinases and intracellular kinases that are abundantly expressed in ERα+ and ERα− breast cancer tissues were identified. Further, label-free quantitative proteome analysis revealed that 236 proteins were differentially expressed in ERα+ and ERα− breast tumors. Among these, 141 proteins were selectively up-regulated in ERα+, and 95 proteins were selectively up-regulated in ERα− breast tumors. Comparison of differentially expressed proteins with a breast cancer database revealed 98 among these have been previously reported to be involved in breast cancer. By Gene Ontology molecular function, dehydrogenase, reductase, cytoskeletal proteins, extracellular matrix, hydrolase, and lyase categories were significantly enriched in ERα+, whereas selected calcium-binding protein, membrane traffic protein, and cytoskeletal protein were enriched in ERα− breast tumors. Biological process and pathway analysis revealed that up-regulated proteins of ERα+ were overrepresented by proteins involved in amino acid metabolism, proteasome, and fatty acid metabolism, while up-regulated proteins of ERα− were overrepresented by proteins involved in glycolysis pathway. The presence and relative abundance of 4 selected differentially abundant proteins (liprin-α1, fascin, DAP5, and β-arrestin-1) were quantified and validated by immunohistochemistry. In conclusion, unlike in vitro cell culture models, the in vivo signaling proteins and pathways that we have identified directly from human breast cancer tissues may serve as relevant therapeutic targets for the pharmacological intervention of breast cancer.
Introduction
Estrogens are an important regulator of development, growth, and differentiation of the normal mammary gland. In addition, it is well documented that endogenous estrogens play a major role in the development and progression of breast cancer. 1 The mammary cell proliferation signals are mediated in part by the estrogen receptors (ERs), which belong to the nuclear receptor superfamily of ligand- activated transcription factors that control physiological and pathological processes, largely by regulating gene transcription. 2 Besides the classic ligand-dependent mechanism of ER action in which the hormone-receptor complex regulates gene transcription through its interaction with estrogen response DNA element (ERE), the ERs can also regulate gene transcription interacting with other promoter elements such as AP1, 3 SP1, 4 and CREs. 5 Recently, alternative ER signaling via direct association with and activation of many signal transduction pathways has been described. 6,7 Two known subtypes of ER exist, ER-α and ER-β, which have distinct tissue and cell patterns of expression. 8 In this study, ER specifically refers to ERα.
The expression of ER in breast tumors is frequently used to group breast cancer patients in a clinical setting, both as a prognostic indicator and in predicting the likelihood of response to treatment with antiestrogen, such as tamoxiwlonger disease-free interval and overall survival than patients with tumors that lack ERα expression (ERα−). 10,11 Generally ERα− breast carcinomas are less well differentiated and tend to be more aggressive clinically than ER- positive breast tumors. 12-15 However, the association between ERα expression and hormonal responsiveness is complex: approximately 30% of ERα+ tumors are not hormone responsive, while 5% to 15% of ERα− tumors respond to hormonal therapy. 16 The molecular basis for the differences between ERα+ and ERα− tumors and relationship of ER to the hormone-responsive phenotype is believed to include genetic and/or epigenetic aberrations occurring at the level of ER signaling.
These findings have prompted investigators to identify genes that are differentially expressed in ERα+ and ERα− breast carcinomas in an attempt to better understand the molecular basis for the phenotypic differences between these classifications of tumors. Using cDNA microarray technique, gene expression profiles have been used to distinguish tumor class not evident by traditional methods. 17,18 In breast cancer, DNA microarray analysis has demonstrated that ERα+ and ERα− breast cancer has unique molecular profiles, has identified several distinct molecular subclasses, and has been used to predict prognosis. 19-23 Although information exists on the mRNA expression signatures of specific breast cancer subtypes, very little data are available regarding the protein expression signatures in ERα+ and ERα− breast cancer tissues. Because messenger RNA (mRNA) levels do not necessarily correlate with protein abundance, 1,24 comparing protein expression profiles of ERα+ and ERα− breast cancers is needed. Protein-level information is crucial for the functional understanding and the ultimate translation of molecular knowledge into clinical practice. For example, identification of receptors and intracellular protein kinases will likely allow better selection of drug targets highly expressed in human breast cancer tissues.
The major aim of this study was to identify differential proteins expressed in ERα+ and ERα− breast tumors in order to understand the proteomic phenotype of each. A major hurdle of tissue proteomics analysis is the variability among tissue samples due to the heterogeneity of cancer tissues, which can contain a mixture of cancer cells as well as inflammatory, vascular, and connective tissue cells. Many published studies have provided proteomics data without addressing this important issue. Laser capture microdisesction (LCM) is an attractive but labor-intensive solution that allows the harvesting of pure cell subpopulations from frozen and fixed tissues. 1,25,26 To address these very important issues, we have adopted the following steps: 1) use of tissue coring of frozen tumor samples to selectively separate tumor cell populations from surrounding connective tissue, 2) large-scale protein identification from isolated cancer tissues using 1-dimensional electrophoresis combined with liquid chromatography/tandem mass spectrometry (GeLC-MS/MS), 3) quantitative analysis to estimate differential expression of identified proteins in ERα+ and ERα− breast cancer using the spectral count label-free method with PaGE t statistic analysis, and 4) validation of the quantification data on selected proteins using orthogonal methods to support the proteomics data.
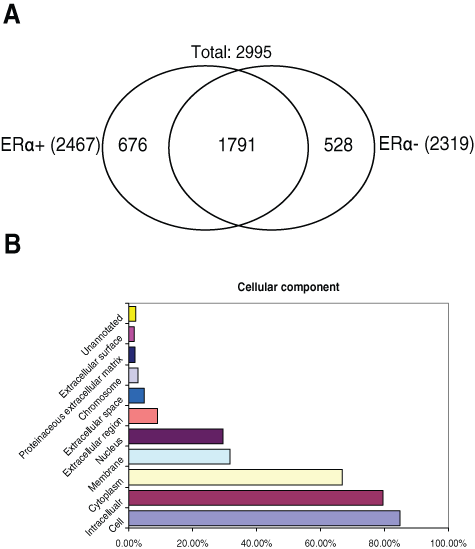
In this study, we have analyzed differential protein expression profiles of ERα+ and ERα− breast cancer tumors. In total, 2,995 unique proteins were identified from 3 ERα+ and 3 ERα− breast cancer tissues by GeLC-MS/MS. Of these proteins, 1,791 (59.8%) proteins were common to both groups, and 676 (22.6%) and 528 (17.6%) proteins were unique to ERα+ and ERα− groups, respectively. In addition, we report the identification of 65 kinases that are expressed in human breast cancer tissues. The statistical tool PaGE was used to identify proteins whose expression levels were significantly and differentially regulated between ERα+ and ERα− breast cancer tumors. Significantly expressed identified proteins were mapped by means of Protein Analysis THrough Evolutionary Relationship (PANTHER) GO classification and Kyoto Encyclopedia of Genes and Genomes (KEGG) biochemical pathway to obtain biological interpretations of the proteomic data. Several proteins identified in the present study have not been previously identified in human breast cancer tumors. Our identification of differentially expressed protein profiles of ERα+ and ERα− human breast tumors may facilitate biomarker discovery for disease diagnosis and elucidation of potential therapeutic targets.
Results
Breast Cancer Tissue Proteomics by GeLC-MS/MS
The overall strategy of this study is outlined in Figure 1. The first step was to isolate breast cancer cell–enriched tissue regions for large-scale proteomic analysis. After obtaining malignant breast tissue specimens from patients during surgical procedure, a frozen tissue block for each tumor specimen was prepared by cutting a section and staining it with H&E to localize cancer cell–rich foci within the tissue block (Fig. 1). The areas enriched in cancer cells with minimal stromal and extracellular components were cored with a 2- to 3-mm dermal punch biopsy needle. Subsequently, cored breast cancer tissues were lysed, and 40 μg of tissue protein lysate obtained from 3 ERα+ and 3 ERα− cancer patients were separated by 1-dimensional (1D) sodium dodecyl sulfate polyacrylamide gel electrophoresis (SDS-PAGE). Repeated LC-MS/MS analysis of 6 breast cancer tissue samples (3 ERα+ and 3 ERα−) resulted in the identification of a total 2,995 unique proteins with at least 2 or higher scoring peptides (Suppl. Table S1). The total number of proteins, the number of unique peptides identified per sample, and the false discovery rate (FDR) are shown in Table 1. Supplementary Table S2 details the information on all of these proteins identified for each sample, including the number of unique peptides identified per protein, peptide sequence, precursor ion mass, and charge state. Supplementary Table S3 seperates the total identified proteins into the 2,467 and 2,319 proteins identified from the ERα+ and 3 ERα− groups, respectively. Among the identified proteins, 1,791 proteins (59.8%) were common to both groups, and 676 (22.6%) and 528 (17.6%) proteins were unique to ERα+ and ERα− groups, respectively (Fig. 2A). To obtain an overview of cellular distribution of the identified proteins, the identified proteins were classified according to cellular components of Gene Ontology (GO) annotation. With regard to “cellular component,” a majority of the proteins were assigned to the cell (84.8%), while 2,378 (79.40%) proteins were mapped to the intracellular, 1,999 (66.70%) proteins to the cytoplasm, 949 (31.70%) proteins to the membrane, 886 (29.60%) proteins to the nucleus, 270 (9.00%) proteins to the extracellular region, 147 (4.90%) proteins to the extracellular space, 85 (2.80%) proteins to the chromosome, 60 (2.00%) proteins to the proteinaceous extracellular matrix, and 49 (1.63%) proteins to the cell surface (Fig. 2B). The distributions of proteins were not biased towards a specific cell compartment.
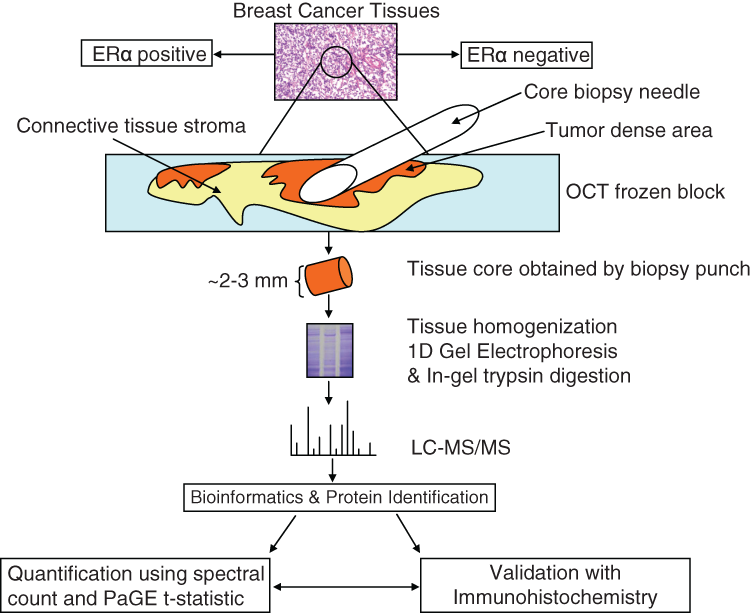
A schematic diagram showing the outline of the experimental methods used in the current study. Human breast cancer cells were 1) isolated by histological identification of homogenous cancer cell–enriched regions, and 2) isolated with a core biopsy needle from adjacent connective tissues, inflammatory cells, and stroma. Protein extracts were then analyzed by 1-dimensional gel electrophoresis, in-gel trypsin digestion, and tandem mass spectrometry. Bioinformatics tools (SEQUEST, PaGE t statistic) were used to identify and quantify the proteins, and immunohistochemistry (IHC) methods were used to validate selected proteins.
Summary of Human Breast Cancer Tissue Proteomic Data
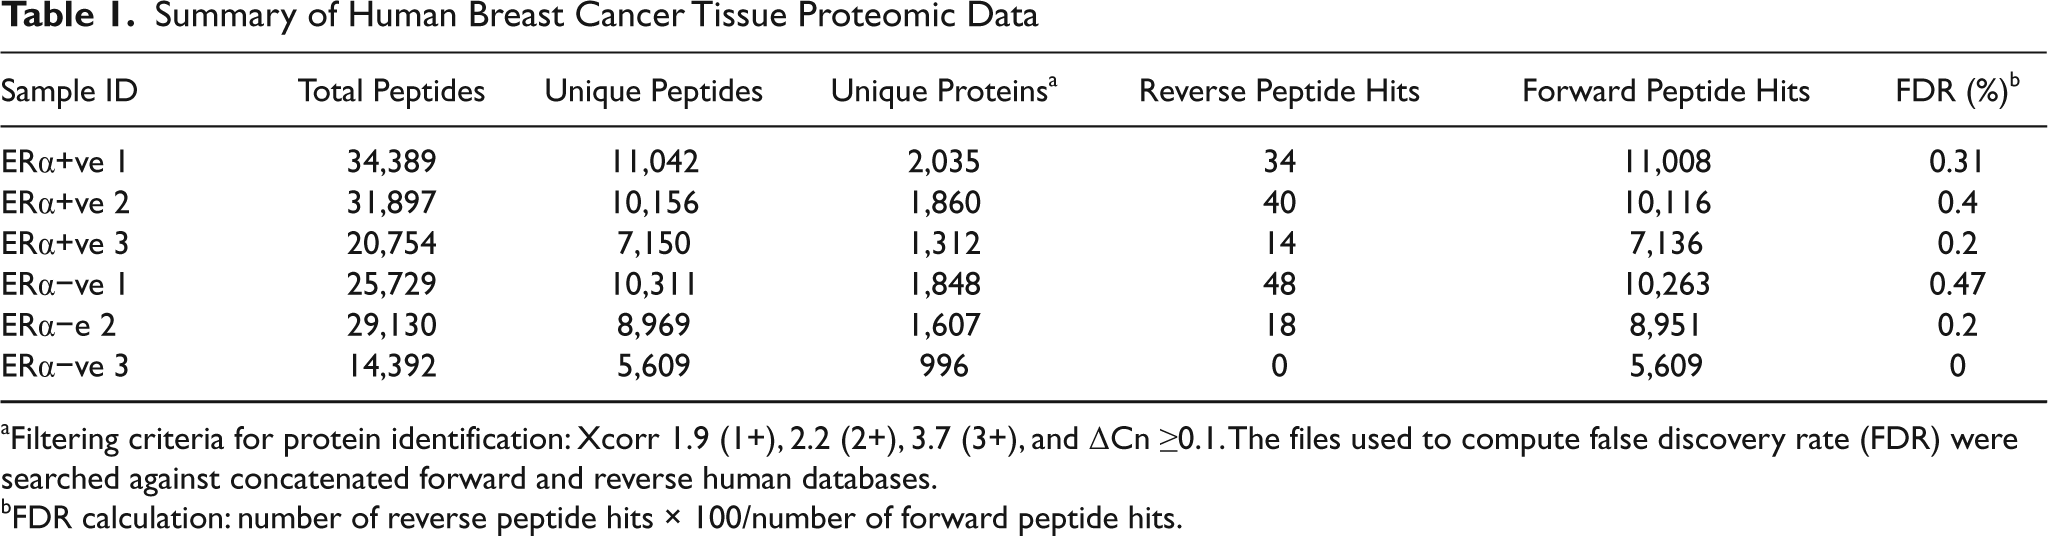
Filtering criteria for protein identification: Xcorr 1.9 (1+), 2.2 (2+), 3.7 (3+), and ΔCn ≥0.1. The files used to compute false discovery rate (FDR) were searched against concatenated forward and reverse human databases.
FDR calculation: number of reverse peptide hits × 100/number of forward peptide hits.
(
Identification of Proteins Differentially Expressed in ERα+ and ERα− Breast Tumor
Spectral count (SC), defined as the total number MS/MS spectra confidently assigned to a protein, is known to provide a semiquantitative measure of protein abundance. 31-34 SC has been used to detect biologically significant differential protein expression under multiple experimental conditions. 31-34 We used this abundance measure to statistically analyze the differences in protein expression both within and between ERα+ and ERα− groups. To characterize the ERα+ and ERα− subtypes, we first identified the proteomes of 3 ERα+ and 3 ERα− breast tumor samples individually. Approximately 2,000 proteins were identified from each of the 2 ERα+ and ERα− samples, while considerably fewer proteins were identified from the third sample of each group. These third samples were omitted from statistical analysis because their low protein numbers could not be corrected by normalization. 83
In order to identify differential protein expression between ERα+ and ERα− groups, we first analyzed differential protein expression within ERα+ and ERα− groups using the SC approach. The semiquantitative measure of protein abundance was calculated by normalizing the SCs of each protein in a given sample relative to the total SCs in that sample. The differential expression analysis within the ERα+ groups (ERα+ 1 v. ERα+ 2) and ERα− groups (ERα− 1 v. ERα− 2) predicted a significant number of differential regulated proteins at the PaGE confidence level of ≥0.80 (Suppl. Tables S6a and S6b). We next compared differential protein expression between ERα+ 1 v. ERα− groups. The analysis predicted 236 differentially regulated proteins at a confidence level of ≥0.8 (Appendix and Suppl. Table S5). Note that the PaGE analysis uses permutations to compare within-group variation to between-group variation and reports only those differences which are significantly greater between than within groups.
Functional Analysis of Differentially Expressed Proteins in ERα+ and ERα− Breast Tumors
In order to derive biological meaning of differentially expressed proteins in ERα+ and ERα− breast tumors, these proteins were grouped according to their reported biological processes and molecular functions using the PANTHER classification (www.pantherdb.org). 35 PANTHER uses the binomial statistics tools to compare our gene list to a reference list (NCBI: Homo sapiens genes) to determine statistically significant overrepresentation of functional groups of genes. We individually uploaded the 141 proteins up-regulated in ERα+ and 95 proteins up-regulated in ERα− breast cancer tissue samples and compared their enrichment in functional categories as defined by PANTHER GO annotation (Fig. 3). Detailed information of the molecular function and biological processes is provided in Supplementary Tables S7a and S7b.
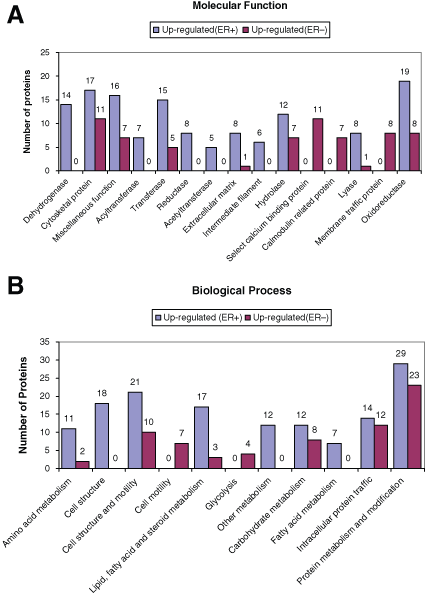
Bar graph representations of the distribution of significantly enriched (P < 0.05) differentially expressed human breast cancer proteins according to their (
Similarly, we have analyzed which cellular pathways enriched in ERα+ and ERα− breast tumors using 2 independent Web-based annotation tools PANTHER and GENECODIS. Both bioinformatics tools commonly identified ubiquitine proteasome pathway highly enriched in ERα+ and glycolysis pathway in ERα− breast tumor. The detail-enriched pathways along with the number of proteins identified in each pathway are shown in Table 2.
Enriched Biological Pathways Identified in ERα+ and ERα− Breast Cancer Samples
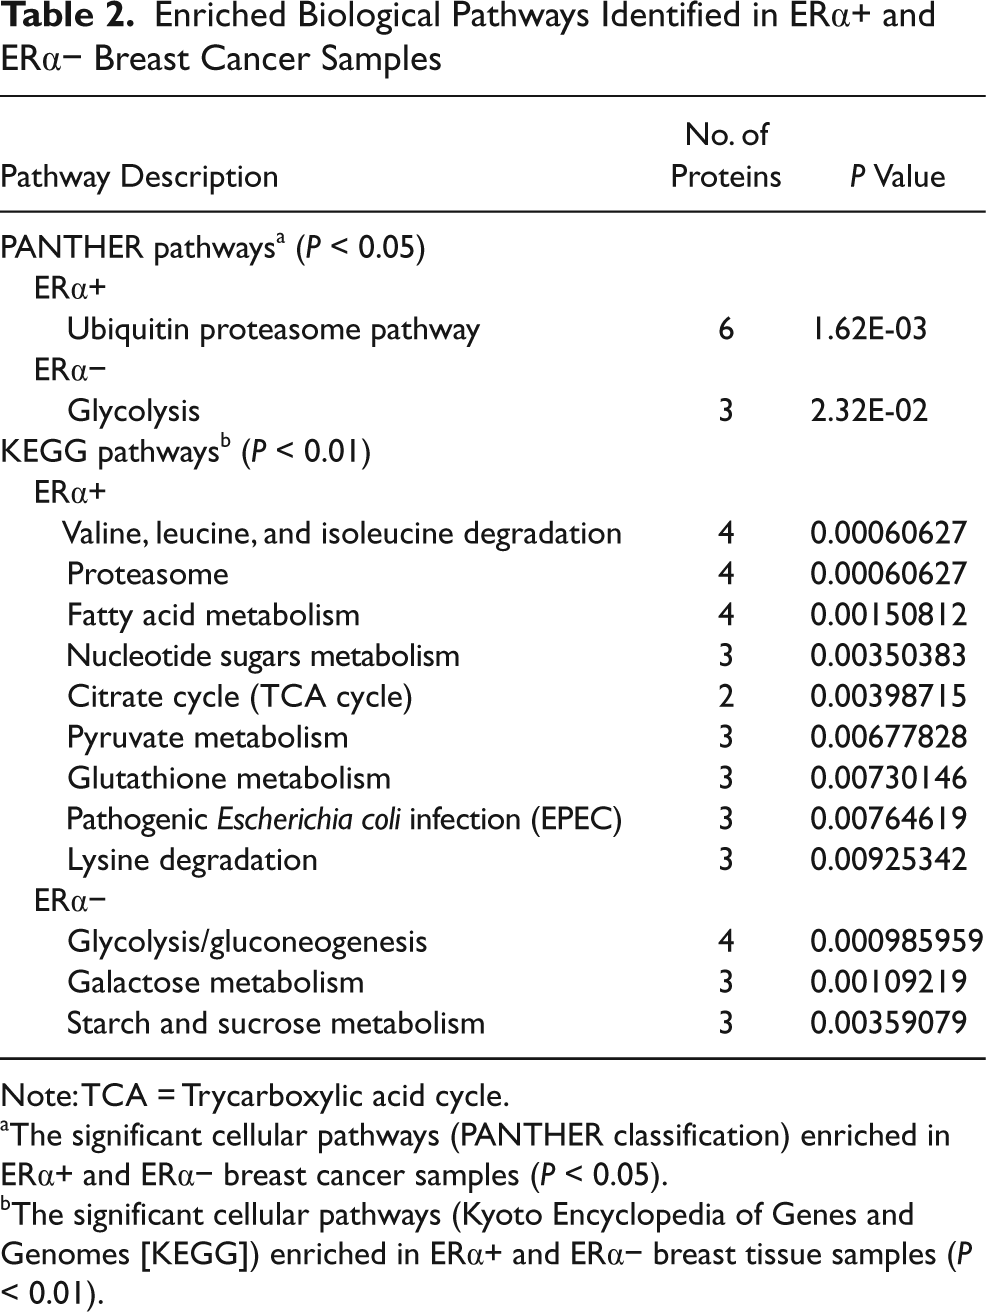
Note: TCA = Trycarboxylic acid cycle.
The significant cellular pathways (PANTHER classification) enriched in ERα+ and ERα− breast cancer samples (P < 0.05).
The significant cellular pathways (Kyoto Encyclopedia of Genes and Genomes [KEGG]) enriched in ERα+ and ERα− breast tissue samples (P < 0.01).
Validation of Observed Proteomic Changes Using Tissue Microarrays
To validate the changes in proteins observed by this proteomic profiling, and to determine the cellular location of the proteins, immunohistochemistry (IHC) was performed on 27 breast cancer tissue blocks as well as on a breast cancer tissue microarray comprising 33 patient samples. Three representative proteins, DAP5 (elf-4G2/p97), fascin, and liprin-α1, were chosen based on their biological function and antibody availability (Figs. 4-6). In addition, to evaluate the reliability of SC-based quantitative analysis, β-arrestin-1, whose quantitative change was around 2-fold with marginal confidence levels of 0.80, was also chosen for IHC validation.
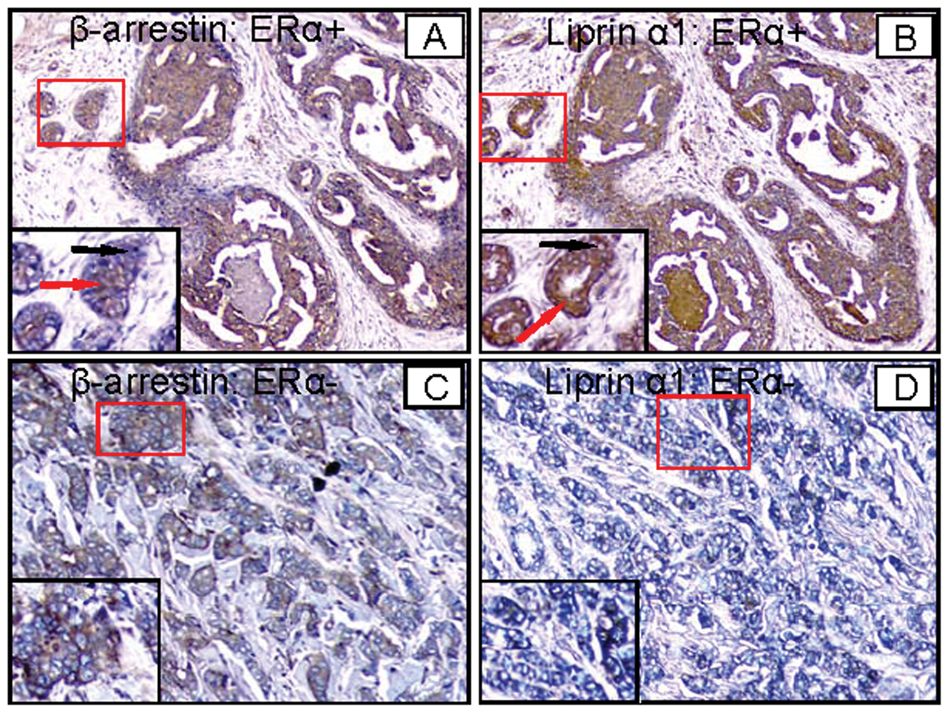
Validation of β-arrestin-1 and liprin-α1 by immunohistochemistry (IHC) on human breast cancer tissues. Anti–β-arrestin-1 (
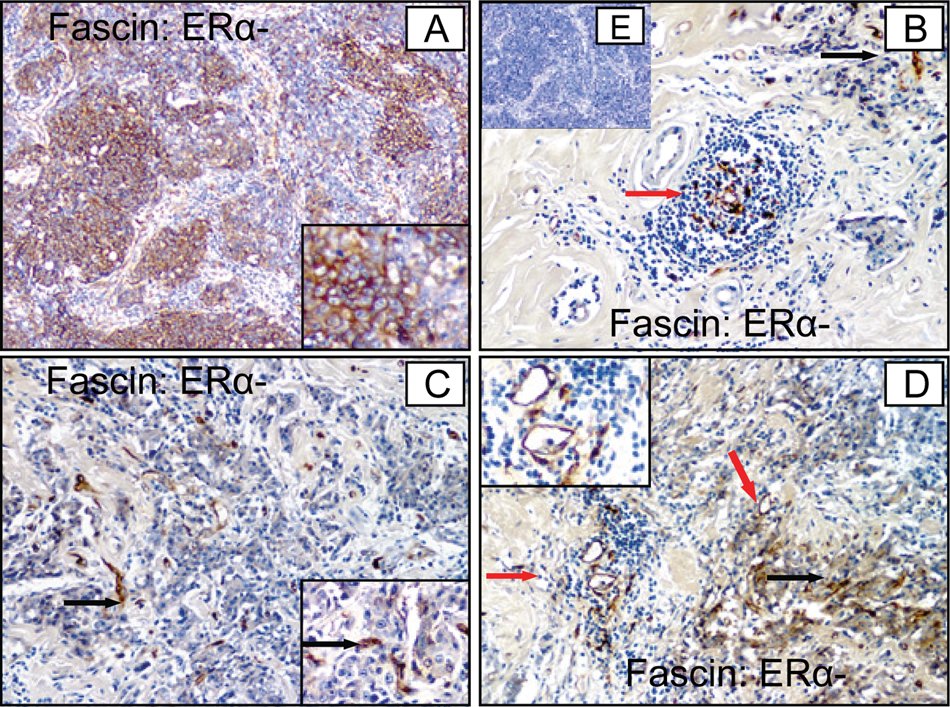
Validation of differential fascin expression by immunohistochemistry (IHC) on human breast cancer tissue. ERα− cancer tissues show intense expression of fascin (
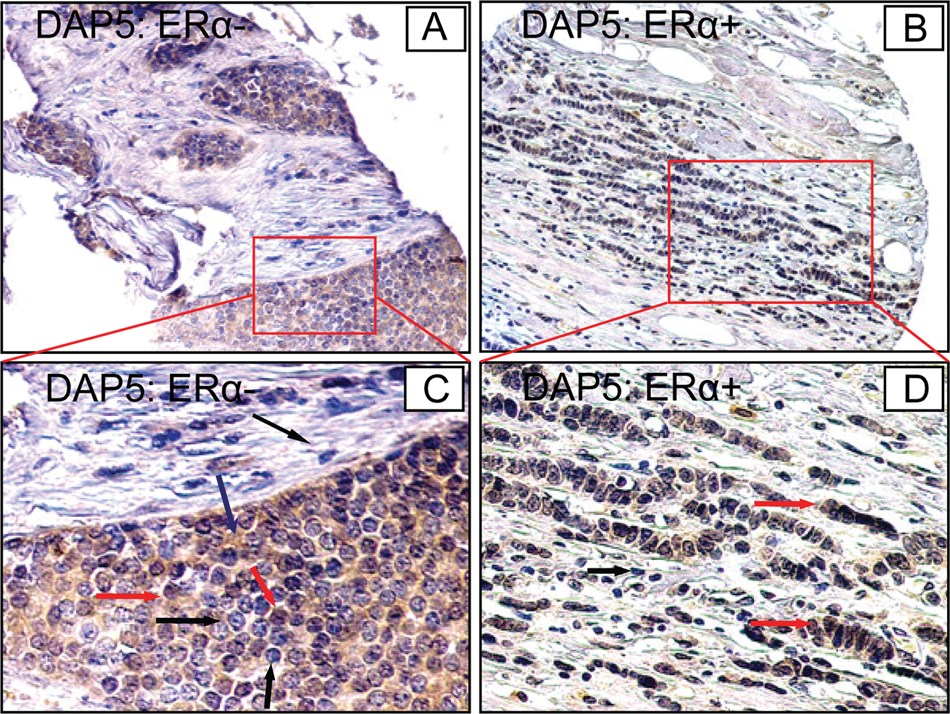
Validation of differential expression of DAP5 by immunohistochemistry (IHC) on human breast cancer tissues. ERα− breast cancer shows intense expression of DAP5 (
Fascin, an actin bundling motility-associated protein, is normally expressed in neuronal and mesenchymal cells and is low or absent in epithelia. 41 However, striking up-regulation of fascin has been reported in several human epithelial tumors including breast, colon, lung, and ovarian carcinomas. 42-47 A recent study has suggested that expression of fascin correlates with hormone receptor–negative breast cancer, and overexpression may contribute to a more aggressive clinical course. 41 DAP5 (p97 or eIF4G2) is abundantly expressed in proliferating cells and is recruited to the ribosome following growth factor stimulation. Down-regulation of DAP5 levels by RNA interference decreases the rate of global protein translation and inhibits cell proliferation. 48 Liprin-α1 was identified as a binding protein of leukocyte common antigen-related (LAR) family receptor tyrosine phosphatases and colocalized with LAR at focal adhesion. 49 Liprin-α1 also interacts with the inhibitor of growth 4 (ING4), a candidate tumor suppressor that plays a major role in gene regulation, cell-cycle control, apoptosis, and angiogenesis. ING4 regulates cell motility by interacting with liprin-α1. 50 β-Arrestin-1, which regulates many aspects of 7 transmembrane receptor (7TMR) signaling and function, has also been shown to serve as an adaptor protein, which brings Mdm2, an E3-ubiquitin ligase, to the IGF-1R, leading to its proteasome-dependent destruction. 51 RNA interference–mediated suppression of β-arrestin-1 in human melanoma cells ablated IGF-1R– stimulated ERK signaling and prolonged the G1 phase of the cell cycle. 52 These data suggest that β-arrestin–dependent ERK signaling through IGF-1R regulates cell cycle progression and may be an important regulator of the growth of normal and malignant cells. 51,52
Representative IHC staining patterns for liprin-α1 and β-arrestin-1 are shown in Figure 5. For both proteins, staining in the serial sections of ERα+ invasive ductal carcinoma showed prominent immunoreactivity in the cancerous epithelial cells, while the stromal cells showed much weaker staining (Fig. 4A and B). In contrast, staining in the serial sections of invasive ERα− ductal carcinomas showed much weaker immunoreactivity in the cancerous epithelial cells (Fig. 4C and D). Semiquantitative analysis showed higher numbers of samples with high-grade expression of both of these proteins in ERα+ tumors (11 of 20 for liprin-α1, and 10 of 20 for β-arrestin-1) compared to ERα− breast cancers (4 of 13 for liprin-α1, and 5 of 13 for β-arrestin-1) (Table 3). Higher magnification of selected regions showed lack of staining in the nucleus, consistent with the predicted localization of both of these proteins in the membrane and cytoplasmic fractions (Fig. 4A and B). Higher power magnification of liprin-α1 and β-arrestin-1 staining in an ERα− sample revealed a variable cell-to-cell expression pattern, where some cells stained detectable levels while others showed no immunoreactivity at all (Fig. 4C and D).
Semiquantitative Analysis of Immunohistochemistry on Tumor Tissue Array of ER+ and ER− Patients
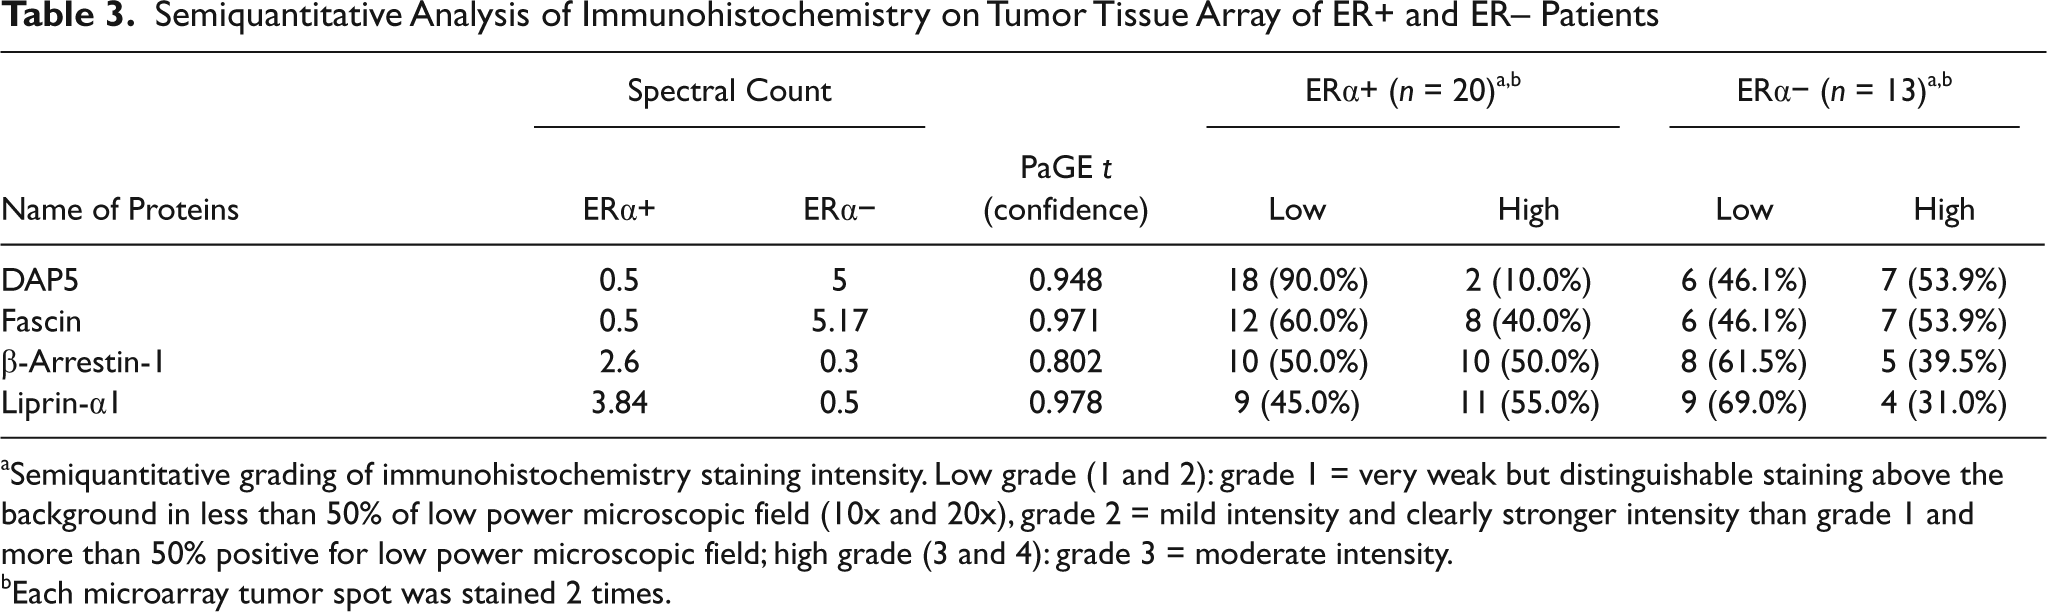
Semiquantitative grading of immunohistochemistry staining intensity. Low grade (1 and 2): grade 1 = very weak but distinguishable staining above the background in less than 50% of low power microscopic field (10x and 20x), grade 2 = mild intensity and clearly stronger intensity than grade 1 and more than 50% positive for low power microscopic field; high grade (3 and 4): grade 3 = moderate intensity.
Each microarray tumor spot was stained 2 times.
Based on semiquantitative IHC analysis, it was observed that fascin is more frequently expressed at a higher intensity (grade 3 and 4) in ERα− breast cancer samples (7 of 13 in ERα− v. 8 of 20 in ERα+) (Table 3). We have also observed that fascin was expressed on angiogenic vessels within the cancer tissues, which indicates a potential role for this protein in cancer angiogenesis. DAP5 antibody showed intense cytoplasm and nuclear staining among the ERα− cancer cells compared to ERα+ cells, where cytoplasm-staining intensity was low (Fig. 6). Semiquantitative IHC analysis showed higher expression of DAP5 among ERα− breast cancer (7 of 13) compared to ERα+ tumors (2 of 20) (Table 3). These experimental observations further support the findings of our differential expression proteomics derived from ERα+ and ERα− breast cancer tissues.
Development of Multiple Reaction Monitoring (MRM) for Candidate Biomarker Quantification and Validation
Identification of 2,995 proteins from ERα+ and ERα− breast cancer tissue provided in this study will serve as a valuable resource for the research community interested in using these proteins as biomarkers for risk assessment and stratification in breast cancer. The proteotypic peptides (peptides that are preferentially observed for a protein are called proteotypic), charge states, and differential regulation between the ERα+ and ERα− breast cancers that we are reporting in this paper can now be used to develop mass spectrometry–based multiple reaction monitoring (MRM) assays. Recently, MRM mass spectrometry (MRM-MS)–based quantitative technique has been applied for quantitative conformation of known or candidate biomarkers in the complex tissue samples. 84 A proteotypic peptide is selected as a surrogate for the protein of interest and analyzed by MRM-MS in targeted fashion. Development of MRM assays enables a seamless and rapid transition from hypothesis generation to validation. 84 The MRM-MS–based techniques can be applied to semiquantitatively test whether a number of candidate markers were truly overrepresented in the ERα+ and ERα− breast cancer tissues as predicted by the label-free SC analysis. Specifically, a number of candidates can be chosen from the list of the differentially expressed proteins (Appendix and Suppl. Table S2), and optimum transition can be automatically chosen for highly confidently identified peptides originating from the protein candidates by interrogating the LC-MS/MS data.
Discussion
Breast cancer is among the most heterogeneous of human cancers, and effective treatment strategy will require comprehensive molecular characterization for the purpose of target identification of breast cancer tissues. The ER status of the breast cancer tumor is determined from its protein level and has long been used as a means to classify the group of patients that will benefit from hormone therapy. However, ER status based on protein expression does not give a verification of the functional activity of ER-dependent signaling pathways. In previous studies, global gene expression of breast tumor demonstrated that ER status of breast tumors is associated with distinct gene expression profiles involving a large number of genes. 19-23 To gain more comprehensive understanding of breast cancer progression, it is critical to combine the protein expression pattern with global mRNA expression. Proteins are the major effectors of most biological processes and are also the most suitable molecules for use as biomarkers, prognostic risk factors, and therapeutic targets. The profiling of protein expression from pathological tissues provides a rough survey of the pathological, metabolic, oncogenic, and metastatic status. The principle objective of our present study was to identify differentially expressed proteins associated with ER status that may serve as a useful resource for basic and translational cancer research.
Surgical tumor specimens are not homogeneous in their cellular composition and include various cell populations such as stroma cells, fibroblasts, and lymphocytes in addition to cancer cells. Moreover, the proportion of tumor cells in clinical samples varies significantly. These issues may compromise the protein expression data associated with ER that is expressed specifically in the epithelial cells. To isolate pure cancer cell populations from tumors, the currently available LCM dissection method is very labor intensive, and obtaining the amount of protein necessary for proteomic analysis is not easily achievable. 25 Moreover, isolating pure cells by LCM requires clear histology to identify cancer cells from connective tissue cells. Such clear histology is possible using formalin-fixed, paraffin-embedded (FFPE) tissues with minimal staining with hematoxylin, but the problem of protein decrosslinking of formalin-fixed tissues for further proteomic analysis still exists. Even though there are numerous published studies claiming to analyze FFPE tissues for proteomics using various antigen retrieval methods, data obtained by such methods are not comparable to those obtained from fresh cell lysates or frozen samples in terms of quantitative and qualitative peptide/protein identification. 25,27 On the other hand, using frozen samples for LCM compromises the quality of the histology, which is a major limiting factor for confident isolation of pure cells for large-scale proteome analysis. In order to carry out proteomic analysis of frozen breast cancer tissues, we have isolated the nearly pure cancer cell populations from the surrounding connective tissues using a tissue coring method.
In this study, we applied GeLC-MS/MS proteomic technology to compare the proteomes of ERα+ and ERα− breast cancer tumors. In total, we identified the expression of 2,995 unique proteins and quantified 236 differentially expressed proteins between ERα+ and ERα− breast cancer tumors. We compared 2,995 identified breast cancer proteins from this study with the protein list publicly available in the Genes-to-System Breast Cancer (G2SBC) Database (http://www.itb.cnr.it/). The G2SBC Database is a bioinformatics resource that collects and integrates data about genes, transcripts, and proteins that are altered in breast cancer cells. The G2SBC Database has reported a list of 2,036 genes with at least one evidence of their association with breast cancer. Therefore, we converted 2,995 protein identifications (IDs) to 2,850 gene IDs with the help of an in-house–developed ID conversion tool and then compared with 2,036 breast cancer genes in the G2SBC Database. This analysis allowed the identification of 721 common proteins/genes involved in breast cancer, suggesting that our results support and add significantly to what is already known in the literature about genes involved in breast carcinogenesis.
Among 721 known breast cancer proteins, we have identified the cell-adhesion integrins, as well as integrins α 2 and 5 and β 1, 2, 4, and 5. Similarly, multidrug resistance proteins (ABCD3), signaling molecules, cell surface receptors, kinases (protein kinase B), and transcription factors were also detected in this study. Furthermore, identification of the most abundant receptor tyrosine kinases and intracellular kinases that are expressed in human breast cancer tissues provides a new dimension for therapeutic strategies. For example, from our analysis, we know that epidermal growth factor receptor (EGFR), vascular endothelial growth factor receptor 2 (VEGFR2/KDR), insulin-like growth factor1 receptor (IGF1R), and ephrins (EPHB3 and EPHB4) are the most abundant receptor tyrosine kinases expressed in breast cancer tissue samples. Similarly, we have identified over 60 most abundant kinases that are expressed in the breast cancer tissue samples (Suppl. Table S8). Therefore, the list that we have uncovered will be useful for therapeutic strategy to target kinase-signaling network in breast cancer and help design future therapeutic strategies.
Systematic comparison of proteomic and cDNA microarrays is challenging for several reasons. One reason is that most published microarray studies are focused on reporting cDNAs that are differentially expressed but not the comprehensive list of expressed cDNAs. In contrast, proteomic reports rely on detected proteins, which favor high abundant proteins expressed in a particular tissue being analyzed. Therefore, when one compares these 2 datasets, very little overlap is found with little or no apparent utility. A good example is the study in which the proteomic analysis of ductal carcinoma in situ (DCIS) of the human breast was compared to the published nucleic microarray studies 26 ; very little concordance between the proteomic and microarray datasets was uncovered. Similarly, in our previous study, when we systematically compared the protein proteomic dataset from prostate tissues with a number of published cDNA microarray datasets, we found very little overlap between the mRNAs and proteins. 27 A second reason for the discordance between proteomic and cDNA studies is the source of tissue being analyzed. Most cancers have heterogeneous distribution of cancerous cells and matrix components; comparing datasets from 2 different sources may not generate useful data. Supporting this notion, when we compared the proteomic dataset with the microarray dataset from the same leukemia cells, we found 98% overlap between these 2 datasets. Therefore, characterization of proteomes and mRNAs from the same ERα+ and ERα− breast cancer tissues is required for meaningful comparison. Comparing our proteomic datasets with microarray data generated from the same source of samples is beyond the scope of the current study.
It is interesting to note that differential protein expression can be found within or between ERα+ and ERα− breast cancer groups. Differential regulation within the 2 ERα+ (294 proteins) or the 2 ERα− (411 proteins) breast cancers could be observed due to several reasons: 1) the cell-to-matrix component ratio variation from these samples, 2) underlying genetic or epigenetic differences in patient samples within the same group, and 3) differences in the stage of cancer during the multistep carcinogenesis. These results point out the complexity of each cancer sample even within the same type as defined by the ER status and question the underlying logic of tamoxifen treatment.
In addition to the identification of differentially regulated proteins within ERα+ and ERα− breast cancers, we also compared the ERα+ and ERα− groups to identify high-confidence differential regulation (Suppl. Table S4). Of 236 differentially expressed proteins, 98 proteins matched with the list of 721 common proteins from 2,036 proteins documented to be involved in breast cancer (discussed earlier). It is interesting that the expression level of the remaining 485 proteins (721 minus 236) may not associate with a change of ER status. In fact, most of the proteins that account for functional differences between ERα+ and ERα− breast cancer have not previously been known to be regulated by ER. The proteins associated with ERα− status are of particular interest because they may reveal the biological cause of the distinct behavior of these tumors and provide potential targets for drug development. Among the 236 differentially expressed proteins, 141 proteins were significantly up-regulated in the ERα+ breast tumors, which included several previously identified such as IGF1R, CORO1A, MAPT, PPFIA1, OGN, NUMA1, KRT8, KRT18, KRT19, GSTM3, GSTM1, SLC9A3R1, SELENBP1, HEBP1, CLU, CA1, CA2, APN, MX1, and FASN, as well as many other potential marker proteins for this phenotype. One example is the protein STAMP1 (PTPLAD1), which encodes 6 transmembrane proteins and has been reported to have a key role in both normal prostate physiology and the progression of prostate cancer. 38 In the ERα− breast tumors, 95 proteins were specifically up-regulated, and these also included proteins previously reported to be involved in breast cancer such as S100A8, S100A9, SLC2A1, FABP7, CTSD, CTSB, SFN, ANX1, ENO1, MSN, TPM2, LGALS3, LGALS1, FSCN1, RTN4, GTF2I, FBLN1, CALU, TFRC, HK2, and CES1 (Appendix). One interesting protein specifically highly up-regulated in this tumor was peripherin (PRPH), which is an intermediate filament, involved in growth and development of the peripheral nervous system, and is produced by neurons and the β cells of the islets of Langerhans. Recently, malignant melanomas and some melanocytic nevi have been shown to express peripherin. 39 These differential protein expression patterns may reflect levels of activation of distinct signaling pathways.
We next systematically determined if estrogen-responsive pathways are differentially expressed between ER-positive and -negative breast cancer tissues. Analysis of differentially expressed proteins (genes) by PANTHER GO categories offers a global view of the biological meaning of this proteomic dataset. In our analysis, we identified enriched GO categories in both ERα+ and ERα− breast cancer tumors. By GO biological processes, the genes related to amino acid metabolism, cell structure, cell structure and motility, lipid, fatty acid and steroid metabolism, other metabolisms, carbohydrate metabolism, intracellular protein traffic, and protein metabolism and modification were significantly enriched (P < 0.05) in ERα+ breast tumor samples. In contrast, significantly enriched biological processes among the up-regulated genes in ERα− breast tumors include those involved in glycolysis, intracellular protein traffic, protein metabolism and modification, carbohydrate metabolism, and cell motility (Fig. 3A).
Similarly, proteins that are significantly enriched (P < 0.05) for the molecular function category in ERα+ breast tumors include dehydrogenase, oxidoreductase, lyase, cytoskeletal protein, acyltransferase, transferase, reductase, acetyltransferase, hydrolase extracellular matrix, intermediate filament, and miscellaneous function. Significantly enriched molecular functions among the up-regulated genes in ERα− breast tumors include selected calcium binding proteins and calmodulin-related proteins (Fig. 3B).
Fatty acid synthase (FAS) is a multienzyme complex catalyzing the synthesis of long-chain fatty acids from acetyl-CoA and malonyl-CoA. In most normal human tissues, however, FAS is generally expressed at low levels because cells preferentially use circulating dietary fatty acids for the synthesis of new structural lipids. 53 High levels of FAS expression have been found in many human cancers including breast cancer. Recently, a number of studies have pointed to the potential importance of FAS in breast cancer. Two studies have shown that FAS expression in malignant breast tumors is associated with a 4-fold increase in risk of death. In one of these, there was a 9-fold increased risk of death when high levels of FAS expression occurred together with a high proliferative index (>17%). 54,55
A total of 17 cytoskeletal-associated proteins with diverse biological functions were significantly up-regulated in ERα+ breast tumors (Suppl. Table S7a). Among the most highly up-regulated proteins were coronin-1A (CORO1A), microtubule-associated protein tau (MAPT), type I cytoskeletal 18 (KRT18), type I cytoskeletal 19 (KRT19), type II cytoskeletal 8 (KRT8), and Src substrate cortactin (CTTN). Interestingly, most of these proteins are known to be responsive to estrogen. Our finding of coronin-1A, which is increased in ERα+ breast tumor tissues, supports the emerging link between actin remodeling and breast cancer development. This protein is not only involved in actin polymerization/depolymerization but is also related to the invasion and migration of malignant tumor cells, which may be prerequisite for breast cancer development and possibly for lymph node metastasis. Cortactin, 56 as a regulator of actin cytoskeleton organization, is involved in many of these processes. For instance, many observations revealed that cells overexpressing cortactin show enhanced cell migration, invasion, and increased metastatic potential in vivo. 57,58 Furthermore, down-regulation of cortactin in highly invasive cells in vitro using small RNA interference, deletion mutants, or microinjection of antibodies resulted in a decreased invasive potential. 59-61
In contrast, many PANTHER GO categories including selected calcium-binding protein (S100A8, S100A9), membrane traffic protein, and cytoskeletal protein were significantly up-regulated in ERα− breast cancer tumors. The S100 protein family is the largest family of calcium-binding proteins in which most members are overexpressed in certain types of cancers such as breast cancer, lung cancer, gastric cancer, prostate cancer, and skin cancer. 62 More specifically, S100A8 and S100A9 seem to be overexpressed in mammary ductal carcinomas. 63 S100A8 and S100A9 naturally form a stable heterocomplex. Immunohistochemical investigations have examined the relationship between both S100A8 and S100A9 proteins and the pathological parameters that reflect the aggressiveness of carcinoma in invasive ductal carcinoma of the breast. Coexpression of both proteins was associated with poor tumor differentiation, invasion, and metastasis. 63 A recent study has shown that S100A9 expression was strongly associated with poor prognosis and suggested that this negative impact could be due to the tight correlation between S100A9 and other pathological factors closely associated with the basal subtype such as ER negativity and high grade. However, in this study, prognostic value was not simultaneously evaluated by the expression of S100A8 and S100A9. 64 In our study, identification of both S100A8 and S100A9 proteins in ERα− breast tumors is consistent with the role of these proteins in aggressiveness, but their putative role in the tumor phenotype needs further experimental evaluation.
Rho kinases, also termed Rho-associated coiled-coiled–containing protein kinases (ROCK1 and ROCK2), are serine/threonine protein kinases that are activated when bound to the GTP-bound form of the small GTPase RhoA or RhoC. The small GTPase Rho/Rho-associated kinase (ROCK) pathway is involved in cell migration, invasion, cell-cell adhesion, actomyosine contraction, cytokinesis, and mitosis. 65-68 Rho GTPases were required for Ras-mediated oncogenic transformation. Several members of the small GTPase Rho family, RhoA, RhoC, RhoH, Rac1, and CDC42, are overexpressed in several cancer types. 69 In vitro studies, as well as animal experiments, suggest that interruption of the Rho/Rho kinase pathway with specific ROCK inhibitors (Y-27632, Wf-536, fasudil) inhibits invasiveness of several animal and human cancer cells. 70-73 These results indicate that Rho kinases play an essential role in tumor cell invasion and metastasis and suggest that the Rho kinases are potential therapeutic targets. The fact that fasudil is approved for human use and is tolerated without serious adverse reaction makes it an attractive anticancer drug candidate for the prevention of cancer metastasis.
Pathway analysis has allowed identifying groups of proteins (genes), which are organized into metabolic and signaling pathways relevant to the oncogenesis or progression of cancer. The 2 different and independent tools used, PANTHER and GENECODIS, result in similar findings: ubiquitine proteasome pathway (PSMC4, PSMD6, PSMD7, PSMC6) and glycolysis pathway (HK2, PFKP, ENO1, LDHA) are the most significantly altered in ERα+ and ERα− breast cancer tumors, respectively. An increase in lactate dehydrogenase A (LDHA), which is known to play an active role in anaerobic glycolysis, reflects the hypoxic condition known to be present in proliferating cancer cells. 74-76 In addition to increased glycolysis, we also detected high-level expression of glucose transporter 1, SLC2A1 (GLUT1), in ERα− breast cancer tumors. This is in agreement with other studies in various cancers including breast cancer. 77 The crucial importance of the glycolytic phenotype is emphasized by the studies demonstrating that increased glucose uptake coincides with the transition from premalignant lesions to invasive cancer. 78 Glucose uptake in cancer cells is increased by activation of the oncogene Akt (protein kinase B). 79 Activation of Akt increases transcription and plasma membrane localization of glucose transporter GLUT1 (glucose transporter 1), the glucose transporter expressed in most cell types. 80,81 Kinase activity of Akt is often increased in breast and ovarian cancers and appears to be associated with poor prognosis. 81 Tumor cells with constitutively active Akt are highly dependent on glucose as an energy source because active Akt can block fatty acid oxidation.
The fatty acid metabolism pathway (ALDH7A1, HADH, CPT1A, and CPT2) was also very significantly enriched in ERα+ breast cancer tumor samples in both KEGG pathway and PANTHER GO biological process categories. This observation is consistent with the 2 independent gene expression studies that have reported high expression of many genes involved in fatty acid/lipid metabolism and degradation in the luminal A phenotype (ER positive), known to be associated with a relatively good prognosis. 82 This proteomic finding, together with gene expression data, may indicate a cross-talk between fatty acid metabolism and estrogen signaling in the pathogenesis of hormone-dependent breast cancer. These findings, together with a number of known estrogen-responsive cytoskeleton genes described above, suggest that known estrogen-responsive genes are enriched in ERα+ breast cancer tissues.
In summary, the 1D GeLC-MS/MS method coupled to label-free quantification (spectral count) is a very useful technique for identification of novel protein(s) involved in mammary tumorigenesis. Our approach in protein expression profiling using microscopically isolated breast tumor cells has identified differentially expressed proteins associated with ER. The mechanisms which regulate these distinct protein expression patterns remain to be investigated and are of importance for future breast cancer research. In conclusion, unlike in vitro cell culture models, the in vivo signaling proteins and pathways that we have identified directly from human breast cancer tissues may serve as pathologically relevant therapeutic targets for the pharmacological intervention of breast cancer.
Materials & Methods
Breast Cancer Tissues and Histology Experiment
Frozen human breast cancer tissues were obtained from John Dempsey Hospital (University of Connecticut Health Center) from 6 patients (3 ERα−, 3 ERα+) for proteomic analysis. Additional archival FFPE breast cancer tissues for IHC-based validation experiments were obtained from BPAS Hospital (27 samples), Surat, India, and from the University of Connecticut Health Center (33 samples). Each paraffin and frozen block was cut in 5 μm thickness, and serial sections were marked. Samples were examined by H&E, and the ER status was determined by standard IHC protocols (details in IHC sections). All experiments on human tissues were performed with deidentified samples and approved by the Internal Review Board (IRB) of the University of Connecticut Health Center.
Core Sampling of Frozen Cancer Tissues
Cancer tissues were directly cored from the frozen tissue blocks with a 2- to 3-mm dermal core biopsy punch after obtaining the full histological orientation from H&E staining to precisely locate the malignant cell–rich regions and separate them from surrounding connective tissues. Frozen tissue blocks were cut in 5-μm-thick sections before and after the procedure to evaluate the accuracy of the tissue biopsy procedure (Fig. 1). The coring procedure minimizes the tissue heterogeneity, as we can select cancer epithelial cell–rich regions from breast cancer tissues.
Sample Preparation and In-Gel Digestion
Proteins from biopsy tissues were extracted in lysis buffer (150 mM NaCl, 10 mM Tris-HCl, 1% Triton X-100, 5 mM EDTA, and protease inhibitors) using a tissue polytron disrupter; DNA and insoluble aggregates were removed by high-speed centrifugation in a microfuge tube (14,000xg for 15 minutes). Protein gel electrophoresis (SDS-PAGE) was performed on 40 μg of tissue lysate for each sample and staining gels with Coomassie blue dye–visualized protein bands. After fixation and destaining, each lane was excised into 15 gel slices, and in-gel trypsin digestion was performed as described previously. 25 Samples were then resuspended in buffer A (5% ACN, 0.4% acetic acid, 0.005% heptafluorobutyric [HFBA] acid in water) and stored at –20°C until further analysis.
Liquid Chromatography Tandem Mass Spectrometry (LC-MS/MS Analysis)
The analysis of protein digests was performed on an LTQ (a 2-dimensional ion trap) instrument equipped with a commercial nanospray source (Thermo Finnigan, San Jose, CA). Samples were loaded by a microautosampler (Famos, LC Packings, Sunnyvale, CA) onto an 11 cm × 100-μm fused silica capillary column packed with reverse C18 material (5-μm, 100-Å Magic beads, Michrom Bioresources, Auburn, CA). The solvent system was delivered by an HP1100 pump (Agilent Technologies, Palo Alto, CA). Peptides were eluted with a gradient from 100% buffer A to 80% buffer B (0.4% acetic acid, 0.005% HFBA in ACN) in 85 minutes. Each survey scan was followed by 5 MS/MS scans of the most intense ions. Dynamic exclusion features were enabled to maximize the fragmentation of less abundant peptide ions. The samples loading, delivery, and scan function were controlled by the Xcalibur software (Thermo Finnigan). Each sample was analyzed 3 times for a total of 270 LC-MS/MS runs on all 6 breast cancer tissue samples (3 ERα+ and 3 ERα−).
Database Searching and Analysis
All LC-MS/MS runs were processed in the following way as described previously. 25,27 All the mass spectrometry raw files were converted to .dat files using Xcalibur software (version 1.4 SR1, Thermo Finnigan). Peak lists were automatically extracted using the extract .ms program with default parameters, except that filtering was turned off. All the .dat files were searched against a local copy of the nonredundant human protein database (56,709 entries) from the NCI (National Institutes of Health, Advanced Biomedical Computing Center) using the SEQUEST algorithm (SEQUEST-PVM version 27 [revision 0]). 27-29 SEQUEST parameters were as follows: all the filtering thresholds were off; mass tolerance of 1.5 Da for precursor ions and 0.5 Da for fragment ions; full tryptic constraint allowing one missed cleavage; and allowing oxidization (+16 Da) of methionine. The database search results were processed using the INTERACT program25,27-29 and filtered with the following criteria: Xcorr cut-off values of 1.9, 2.2, and 3.7 for 1+, 2+, and 3+ peptides, respectively; ΔCn ≥0.1. False-positive rates were estimated by searching against a concatenated forward and reverse human protein database. 30 PeptideProphet and ProteinProphet software tools were used to analyze identified proteins to detect redundancies and to generate a nonredundant protein list (Suppl. Table S1).
Detection of Differential Regulation, PaGE Analysis
PaGE, 31 a software package developed for the statistical analysis of microarray data, was used with SC 32-34 to detect differential regulation in this study. PaGE uses a permutation approach to compare within-condition versus between-condition variability and to control the estimated false discovery rate at a level specified by the user. We downloaded the Perl implementation of PaGE available at http://www.cbil.upenn.edu/PaGE/. Prior to use in this study, we extensively tested the PaGE algorithm on large-scale replicated datasets with no differential regulation (3,600+ proteins), as well as SILAC datasets of 1,000+ proteins with known 2-, 4-, and 8-fold up-regulation. A confidence level of 0.8, corresponding to a false discovery rate of 0.2, performed well with both the null populations, where it showed high specificity, and the regulated populations, where it showed high sensitivity (>90%). In the current study, we applied the PaGE t statistic to our unlogged, normalized data using a confidence level of 0.8. Input to the PaGE analysis (Suppl. Table S4) consisted of 6 replicates of ERα+ samples (3 technical replicates each of samples 1 and 2) and 6 replicates of ERα− samples (3 technical replicates each of samples 1 and 2). Missing values were replaced by zeros and included in the analysis. SCs were normalized to compensate for overall variations in total SC between ER+ and ER– samples (Suppl. Table S4). The number of proteins identified in the samples ERα+ 3 and ERα− 3 was so much lower than in the remaining samples that total SC differences could not be corrected through normalization. Therefore, samples ERα+ 3 and ERα− 3 were omitted from the statistical analysis. A similar rationale has been reported previously for omitting one replicate from the statistical analysis of differential protein expression. 83
Following the PaGE analysis, 2 additional filtering steps were applied to the putative list of regulated proteins to remove ratios commonly occurring by chance among null populations. First, those proteins with <2-fold change were removed. Second, all ratios with a maximum (numerator, denominator) <3 and all ratios with a maximum (numerator, denominator) <4 that showed <3-fold change were removed. These final filtering steps eliminated commonly occurring false-positive ratios encountered in our own extensive comparisons of 14 publicly available replicate sets of the human Jurkat cell line. 29
Immunohistochemistry (IHC)
For histological examination and classification of the tissue samples, H&E staining was performed according to standard procedure. 25,27 For IHC, sections were sequentially blocked with 3% H2O2, 5% normal serum (Vector Laboratories) matching the host of the secondary antibody, and avidin/biotin-blocking solution (Vector Laboratories) for 30 minutes at room temperature. Tissue sections were incubated in antigen retrieval buffer (10 mM sodium citrate, 0.05% Tween 20, pH 6) at 100°C for 30 minutes. Primary antibodies against human fascin (1:50, mouse monoclonal, Abcam), DAP5 (1:100, mouse monoclonal, Sigma), liprin-α1 (1:200, chicken polyclonal, Abcam), and β-arrestin-2 (1:100, rabbit polyclonal, Abcam) were used for immunostaining. Tissues were incubated with primary antibodies at 4°C overnight in a humidified chamber. Tissues were then incubated with the following secondary antibodies at room temperature for 2 hours: horse antimouse (1:200, Vector Laboratories), goat antirabbit (1:200, Vector Laboratories), and goat antichicken (1:300, Vector Laboratories). Sections were developed by DAB substrate (Vector Laboratories) and counterstained with hematoxylin for microscopic visualization. IHC scoring was performed as described previously 27 under the light microscope using the following criteria: low grade (1 and 2): grade 1 = very weak but distinguishable staining above the background (secondary antibody alone) in less than 50% in a low power microscopic field, grade 2 = mild intensity and clearly stronger intensity than grade 1 and more than 50% positive in a power microscopic field; grade (3 and 4): grade 3 = moderate intensity and much stronger than grade 2, grade 4 = strongest intensity of staining in greater than 75% of area. Cancer samples from 60 patients (27 archival FFPE tissues and a microarray with 33 cancer specimens) were stained. For semiquantitative analysis, only the 33 microarray spots were utilized because final ER status information was not available for all samples analyzed. Each IHC experiment was repeated twice, and representative sections are shown (Figs. 4-6).
Pathway Analysis and Functional Classification
For functional analysis, UniProt ID of all identified proteins was mapped into gene name using an ID conversion tool developed in house. Proteins were functionally classified based on the PANTHER system (http://www.pantherdb.org). PANTHER is a unique resource that classifies genes and proteins by their function using published scientific experimental evidence and evolutionary relationships abstracted by curators with the goal of predicting function even in the absence of direct experimental evidence. Compared to GO, the PANTHER protein classification system provides a more simplified ontology of specific protein function and classifies more protein than GO. 35
GENECODIS, a publicly accessible Web-based tool (http://genecodis.dacya.ucm.es), was used to classify GO cellular component of the identified proteins and also KEGG pathways analysis of differentially expressed proteins. Using GENECODIS 2.0, 36,37 we also submitted the differentially expressed proteins to the KEGG pathway database, which consists of graphical diagrams of biochemical pathways, including most of the known metabolic and regulatory pathways. 40 The GENECODIS tool uses hypergeometric statistic analysis to determine which GO or KEGG pathways were significantly enriched in the test population as compared to the human genome. 36,37
Footnotes
Appendix
List of 236 Differentially Expressed Proteins in Breast Cancer Tumor Predicted from Spectral Count
| Swiss-Prot ID a | Gene Name | Protein Name | c0 b | c1 b | c1/c0 | Confidence |
|---|---|---|---|---|---|---|
|
|
|
|
|
|
|
|
| P50416 | CPT1A | Carnitine O-palmitoyltransferase I | 10.5 | 0.5 | 0.05 | 0.877 |
|
|
|
|
|
|
|
|
| Q8TD06 | AGR3 | Breast cancer membrane protein 11 | 6.34 | 0.3 | 0.05 | 0.99 |
|
|
|
|
|
|
|
|
|
|
|
|
|
|
|
|
| O75477 | ERLIN1 | SPFH domain-containing protein 2 precursor | 5.5 | 0.3 | 0.06 | 0.974 |
|
|
|
|
|
|
|
|
|
|
|
|
|
|
|
|
| Q9Y365 | STARD10 | PCTP-like protein; StAR-related lipid transfer protein 10 | 5 | 0.3 | 0.06 | 0.99 |
| O76074 | PDE5A | cGMP-specific 3′,5′-cyclic phosphodiesterase | 4.84 | 0.3 | 0.07 | 0.873 |
|
|
|
|
|
|
|
|
|
|
|
|
|
|
|
|
| Q9Y570 | PPME1 | Protein phosphatase methylesterase 1 | 4.5 | 0.3 | 0.07 | 0.967 |
|
|
|
|
|
|
|
|
| Q9ULA0 | DNPEP | Aspartyl aminopeptidase | 4 | 0.3 | 0.08 | 0.878 |
|
|
|
|
|
|
|
|
| Q9HCC0 | MCCC2 | Methylcrotonoyl-CoA carboxylase beta chain, mitochondrial | 4.17 | 0.3 | 0.08 | 0.976 |
| O95861 | BPNT1 | PAP-inositol-1,4-phosphatase | 3.34 | 0.3 | 0.09 | 0.924 |
| O75955 | FLOT1 | Flotillin-1 | 3.34 | 0.3 | 0.09 | 0.959 |
|
|
|
|
|
|
|
|
|
|
|
|
|
|
|
|
| Q8N335 | GPD1L | Glycerol-3-phosphate dehydrogenase 1-like protein | 3.67 | 0.3 | 0.09 | 0.934 |
|
|
|
|
|
|
|
|
|
|
|
|
|
|
|
|
| Q03252 | LMNB2 | Lamin-B2 | 3.17 | 0.3 | 0.1 | 0.98 |
|
|
|
|
|
|
|
|
| O15296 | ALOX15B | Arachidonate 15-lipoxygenase type II | 3 | 0.3 | 0.1 | 0.881 |
| P09110 | ACAA1 | 3-ketoacyl-CoA thiolase, peroxisomal | 3.34 | 0.34 | 0.1 | 0.862 |
| Q86VP6 | CAND1 | Cullin-associated NEDD8-dissociated protein 1 | 3.17 | 0.3 | 0.1 | 0.99 |
| Q9P035 | PTPLAD1 | Stamp1 | 3 | 0.3 | 0.1 | 0.99 |
| O60888 | CUTA | Protein CutA precursor | 3 | 0.3 | 0.1 | 0.978 |
|
|
|
|
|
|
|
|
| Q9Y263 | PLAA | Phospholipase A-2–activating protein | 5.84 | 0.67 | 0.12 | 0.984 |
| Q9NUJ1 | ABHD10 | Abhydrolase domain–containing protein 10, mitochondrial | 3 | 0.34 | 0.12 | 0.991 |
|
|
|
|
|
|
|
|
| A0MZ66 | KIAA1598 | Shootin-1 | 5.5 | 0.67 | 0.13 | 0.981 |
|
|
|
|
|
|
|
|
| P23786 | CPT2 | Carnitine O-palmitoyltransferase 2, mitochondrial | 3.34 | 0.5 | 0.15 | 0.978 |
|
|
|
|
|
|
|
|
| P20810 | CAST | Calpastatin; calpain inhibitor | 4.5 | 0.67 | 0.15 | 0.974 |
|
|
|
|
|
|
|
|
|
|
|
|
|
|
|
|
| O95202 | LETM1 | Leucine zipper-EF-hand–containing transmembrane protein 1 | 9.17 | 1.34 | 0.15 | 0.988 |
| Q05707 | COL14A1 | Collagen α-1(XIV) chain | 34.5 | 4.84 | 0.15 | 0.991 |
|
|
|
|
|
|
|
|
| P35573 | AGL | Glycogen debranching enzyme | 12.5 | 2 | 0.16 | 0.915 |
|
|
|
|
|
|
|
|
|
|
|
|
|
|
|
|
|
|
|
|
|
|
|
|
|
|
|
|
|
|
|
|
| Q15008 | PSMD6 | 26S proteasome non-ATPase regulatory subunit 6 | 3.67 | 0.67 | 0.19 | 0.984 |
|
|
|
|
|
|
|
|
| Q71U36 | TUBA1A | Tubulin α-1A chain | 9.67 | 1.84 | 0.19 | 0.99 |
|
|
|
|
|
|
|
|
|
|
|
|
|
|
|
|
| Q14166 | TTLL12 | Tubulin-tyrosine ligase–like protein 12 | 3.34 | 0.67 | 0.2 | 0.983 |
|
|
|
|
|
|
|
|
| O60812 | HNRPCL1 | Heterogeneous nuclear ribonucleoprotein C–like 1 | 5.17 | 1.17 | 0.23 | 0.966 |
| Q9Y2Z0 | SUGT1 | Suppressor of G2 allele of SKP1 homolog | 3 | 0.67 | 0.23 | 0.819 |
| Q7Z4W1 | DCXR | L-xylulose reductase | 3.5 | 0.84 | 0.24 | 0.97 |
| P42345 | FRAP1 | Mammalian target of rapamycin; mTOR | 3.5 | 0.84 | 0.24 | 0.989 |
|
|
|
|
|
|
|
|
|
|
|
|
|
|
|
|
| P36957 | DLST | Dihydrolipoyllysine-residue succinyltransferase component of 2-oxoglutarate dehydrogenase complex, mitochondrial | 3.34 | 0.84 | 0.25 | 0.881 |
| Q16401 | PSMD5 | 26S proteasome non-ATPase regulatory subunit 5 | 5.34 | 1.34 | 0.25 | 0.915 |
| Q14157 | UBAP2L | Ubiquitin associated protein 2–like | 4 | 1 | 0.25 | 0.959 |
| O94874 | KIAA0776 | UPF0555 protein KIAA0776 | 3.34 | 0.84 | 0.25 | 0.83 |
| P12110 | COL6A2 | Collagen α-2 | 9.84 | 2.5 | 0.26 | 0.985 |
|
|
|
|
|
|
|
|
|
|
|
|
|
|
|
|
|
|
|
|
|
|
|
|
| P49419 | ALDH7A1 | Aldehyde dehydrogenase family 7 member A1 | 4.17 | 1.17 | 0.28 | 0.856 |
| P55265 | ADAR | Double-stranded RNA-specific adenosine deaminase | 4.17 | 1.17 | 0.28 | 0.951 |
| Q96FQ6 | S100A16 | S100 calcium-binding protein a16 | 3 | 0.84 | 0.28 | 0.943 |
|
|
|
|
|
|
|
|
| P24752 | ACAT1 | Acetyl-CoA acetyltransferase, mitochondrial | 4.17 | 1.17 | 0.28 | 0.85 |
| Q9H3U1 | UNC45A | Smooth muscle cell–associated protein 1; SMAP-1 | 4.84 | 1.34 | 0.28 | 0.978 |
|
|
|
|
|
|
|
|
|
|
|
|
|
|
|
|
| P01019 | AGT | Angiotensinogen precursor; angiotensin-1 | 4 | 1.17 | 0.3 | 0.94 |
| Q86V88 | MDP1 | Magnesium-dependent phosphatase 1 | 4.5 | 1.34 | 0.3 | 0.962 |
|
|
|
|
|
|
|
|
| Q9UBQ7 | GRHPR | Glyoxylate reductase/hydroxypyruvate reductase | 9.17 | 2.84 | 0.31 | 0.921 |
| P42858 | HD | Huntingtin; Huntington disease protein | 3.84 | 1.17 | 0.31 | 0.885 |
| O75165 | DNAJC13 | DnaJ homolog subfamily C member 13 | 4.67 | 1.5 | 0.33 | 0.889 |
|
|
|
|
|
|
|
|
|
|
|
|
|
|
|
|
| P05161 | ISG15 | Interferon-induced 17-kDa protein precursor | 7.67 | 2.5 | 0.33 | 0.849 |
| Q9UBF2 | COPG2 | Coatomer subunit γ-2 | 3 | 1 | 0.34 | 0.959 |
| P12270 | TPR | Nucleoprotein TPR | 9 | 3 | 0.34 | 0.941 |
|
|
|
|
|
|
|
|
| Q14789 | GOLGB1 | Golgin subfamily B member 1 | 10.7 | 3.84 | 0.36 | 0.959 |
|
|
|
|
|
|
|
|
| P20700 | LMNB1 | Lamin-B1; C:lamin filament | 4.17 | 1.5 | 0.36 | 0.97 |
| O94903 | PROSC | Proline synthetase–cotranscribed bacterial homolog protein | 4.17 | 1.5 | 0.36 | 0.894 |
| P40763 | STAT3 | Signal transducer and activator of transcription 3 | 9.5 | 3.34 | 0.36 | 0.984 |
| Q5VYK3 | KIAA0368 | Proteasome-associated protein ECM29 homolog | 7.84 | 2.84 | 0.37 | 0.936 |
|
|
|
|
|
|
|
|
| O95865 | DDAH2 | NG,NG-dimethylarginine dimethylaminohydrolase 2 | 4.84 | 1.84 | 0.38 | 0.989 |
| P62495 | ETF1 | Eukaryotic peptide chain release factor subunit 1 | 4.5 | 1.67 | 0.38 | 0.843 |
| P35580 | MYH10 | Myosin-10; myosin heavy chain, nonmuscle Iib | 15.5 | 5.84 | 0.38 | 0.909 |
|
|
|
|
|
|
|
|
| Q16836 | HADH | Hydroxyacyl-coenzyme A dehydrogenase, mitochondrial | 6 | 2.34 | 0.39 | 0.963 |
| P22234 | PAICS | Multifunctional protein ADE2 | 4.34 | 1.67 | 0.39 | 0.807 |
| Q9Y277 | VDAC3 | Voltage-dependent anion-selective channel protein 3 | 4.67 | 1.84 | 0.4 | 0.898 |
| P12109 | COL6A1 | Collagen α-1 | 9 | 3.67 | 0.41 | 0.963 |
|
|
|
|
|
|
|
|
|
|
|
|
|
|
|
|
|
|
|
|
|
|
|
|
| Q9HC38 | GLOD4 | Glyoxalase domain–containing protein 4 | 4 | 1.67 | 0.42 | 0.954 |
|
|
|
|
|
|
|
|
|
|
|
|
|
|
|
|
| Q08257 | CRYZ | Quinone oxidoreductase; NADPH:quinone reductase | 5.5 | 2.34 | 0.43 | 0.828 |
| Q9Y230 | RUVBL2 | RuvB-like 1; 49-kDa TATA box-binding protein-interacting protein | 7 | 3 | 0.43 | 0.853 |
| Q7Z6Z7 | HUWE1 | HECT, UBA, and WWE domain-containing protein 1 | 16.2 | 6.84 | 0.43 | 0.966 |
| Q13126 | MTAP | S-methyl-5-thioadenosine phosphorylase | 4.17 | 1.84 | 0.44 | 0.967 |
| Q13263 | TRIM28 | Transcription intermediary factor 1-β; TIF1-β | 10 | 4.5 | 0.45 | 0.966 |
| P22695 | UQCRC2 | Ubiquinol-cytochrome-c reductase complex core protein 2 | 4.5 | 2 | 0.45 | 0.849 |
| Q9NSE4 | IARS2 | Isoleucyl-tRNA synthetase, mitochondrial | 6.34 | 2.84 | 0.45 | 0.915 |
| P62841 | RPS15 | 40S ribosomal protein S15 | 4.84 | 2.17 | 0.45 | 0.957 |
| Q9NY33 | DPP3 | Dipeptidyl-peptidase 3 | 9.84 | 4.5 | 0.46 | 0.915 |
| P58107 | EPPK1 | Epiplakin; 450-kDa epidermal antigen | 29.5 | 13.7 | 0.47 | 0.882 |
|
|
|
|
|
|
|
|
| Q32MZ4 | LRRFIP1 | Leucine-rich repeat flightless-interacting protein 12 | 5.34 | 2.5 | 0.47 | 0.882 |
| Q9H2M9 | RAB3GAP2 | Rab3-gap regulatory domain | 4.67 | 2.17 | 0.47 | 0.915 |
| Q96CN7 | ISOC1 | ISOC1 protein | 5 | 2.34 | 0.47 | 0.958 |
|
|
|
|
|
|
|
|
| Q16822 | PCK2 | Phosphoenolpyruvate carboxykinase [GTP], mitochondrial | 4.17 | 2 | 0.48 | 0.962 |
| P62333 | PSMC6 | 26s protease regulatory subunit s10b | 4.17 | 2 | 0.48 | 0.867 |
| P52272 | HNRNPM | Heterogeneous nuclear ribonucleoprotein M | 14.7 | 7 | 0.48 | 0.983 |
|
|
|
|
|
|
|
|
|
|
|
|
|
|
|
|
|
|
|
|
|
|
|
|
| P07954 | FH | Fumarate hydratase, mitochondrial | 9.34 | 4.5 | 0.49 | 0.838 |
|
|
|
|
|
|
|
|
| Q86UP2 | KTN1 | Kinectin; kinesin receptor; CG-1 antigen | 10.3 | 5 | 0.49 | 0.976 |
| Q9UQE7 | SMC3 | Structural maintenance of chromosome 3 | 7.17 | 3.5 | 0.49 | 0.918 |
|
|
|
|
|
|
|
|
| Q93009 | USP7 | Ubiquitin carboxyl-terminal hydrolase 7 | 7 | 3.5 | 0.5 | 0.935 |
| Q92616 | GCN1L1 | GCN1-like protein 1; HsGCN1 | 18.7 | 9.34 | 0.5 | 0.943 |
| P24539 | ATP5F1 | ATP synthase b chain, mitochondrial precursor | 2.5 | 5 | 2 | 0.965 |
| Q13442 | PDAP1 | 28-kDa heat- and acid-stable phosphoprotein | 2.17 | 4.34 | 2 | 0.901 |
|
|
|
|
|
|
|
|
| P67936 | TPM4 | Tropomyosin α 4 chain | 2.67 | 5.34 | 2 | 0.935 |
| P42704 | LRPPRC | Hypothetical protein flj43793 | 2.34 | 4.67 | 2 | 0.932 |
| P07195 | LDHB | L-lactate dehydrogenase b chain | 5 | 10.2 | 2.04 | 0.967 |
| Q10567 | AP1B1 | Adapter-related protein complex 1 β 1 subunit | 8.84 | 18.5 | 2.1 | 0.946 |
|
|
|
|
|
|
|
|
|
|
|
|
|
|
|
|
| P18621 | RPL17 | 60s ribosomal protein l17 | 2.5 | 5.34 | 2.14 | 0.973 |
| P26641 | EEF1G | Elongation factor 1-γ | 2 | 4.34 | 2.17 | 0.879 |
|
|
|
|
|
|
|
|
|
|
|
|
|
|
|
|
| Q15363 | TMED2 | Cop-coated vesicle membrane protein p24 precursor | 1.84 | 4.17 | 2.28 | 0.876 |
| P54886 | ALDH18A1 | H δ 1-pyrroline-5-carboxylate synthetase | 4.84 | 11 | 2.28 | 0.92 |
|
|
|
|
|
|
|
|
|
|
|
|
|
|
|
|
|
|
|
α |
|
|
|
|
| P02792 | FTL | Ferritin light chain | 5.17 | 12.3 | 2.39 | 0.959 |
| Q709C8 | VPS13C | Vps13c-2b protein | 2.17 | 5.17 | 2.39 | 0.902 |
| Q8TCT9 | HM13 | Histone h2b | 2.67 | 6.5 | 2.44 | 0.858 |
|
|
|
|
|
|
|
|
| P61026 | RAB10 | Ras-related protein rab-10 | 2.84 | 7 | 2.48 | 0.946 |
| Q01813 | PFKP | 6-phosphofructokinase, type c | 2.5 | 6.34 | 2.54 | 0.831 |
| O43399 | TPD52L2 | Tumor protein d54 | 2.67 | 6.84 | 2.57 | 0.87 |
|
|
|
|
|
|
|
|
|
|
|
|
|
|
|
|
|
|
|
|
|
|
|
|
| P21291 | CSRP1 | Cysteine and glycine-rich protein 1 | 2.17 | 5.84 | 2.7 | 0.869 |
| Q15084 | PDIA6 | Protein disulfide-isomerase A6 precursor | 5.17 | 14 | 2.71 | 0.973 |
| Q9NP72 | RAB18 | Ras-related protein Rab-18 | 2.17 | 6 | 2.77 | 0.92 |
| P12235 | SLC25A4 | ADP/ATP translocase 1; adenine nucleotide translocator 1 | 2.17 | 6.17 | 2.85 | 0.966 |
| O14579 | COPE | Coatomer subunit ε | 2.17 | 6.17 | 2.85 | 0.976 |
| P62807 | HIST1H2BI | Histone h2b.a | 5.5 | 16.3 | 2.97 | 0.959 |
| Q9NZ01 | GPSN2 | Synaptic glycoprotein SC2 | 1.67 | 5 | 3 | 0.918 |
| O95573 | ACSL3 | Long-chain-fatty-acid-CoA ligase 3 | 1.5 | 4.5 | 3 | 0.933 |
| O15173 | PGRMC2 | Membrane-associated progesterone receptor component 2 | 1.17 | 3.5 | 3 | 0.922 |
| P54577 | YARS | Tyrosyl-tRNA synthetase | 1.17 | 3.5 | 3 | 0.964 |
|
|
|
|
|
|
|
|
|
|
|
|
|
|
|
|
| P15880 | RPS2 | 40s ribosomal protein s2 | 1.17 | 3.67 | 3.15 | 0.902 |
| Q9BVK6 | TMED9 | Glycoprotein 25l2 precursor | 1 | 3.17 | 3.17 | 0.819 |
|
|
|
|
|
|
|
|
| Q86UX7 | URP2 | Unc-112–related protein 2 (kindlin-3) | 3 | 9.67 | 3.23 | 0.878 |
| P43490 | PBEF1 | Nicotinamide phosphoribosyltransferase | 3.5 | 11.3 | 3.24 | 0.941 |
| Q92896 | GLG1 | Golgi apparatus protein 1 precursor | 1.34 | 4.34 | 3.25 | 0.945 |
|
|
|
|
|
|
|
|
| P39656 | DDOST | Olichyl-diphosphooligosaccharide-protein glycosyltransferase 48-kDa subunit precursor | 1.17 | 3.84 | 3.29 | 0.918 |
|
|
|
|
|
|
|
|
| P29966 | MARCKS | Myristoylated alanine–rich C-kinase substrate | 2.84 | 9.5 | 3.36 | 0.98 |
| P00352 | ALDH1A1 | Aldehyde dehydrogenase 1a1 | 1.34 | 4.5 | 3.38 | 0.848 |
| Q8NC51 | SERBP1 | Plasminogen activator inhibitor 1 RNA–binding protein | 1 | 3.5 | 3.5 | 0.958 |
|
|
|
|
|
|
|
|
| P62158 | CALM1 | Calmodulin | 1.67 | 6 | 3.6 | 0.933 |
|
|
|
|
|
|
|
|
| Q99439 | CNN2 | Calponin-2 | 1.5 | 5.67 | 3.78 | 0.965 |
|
|
|
|
|
|
|
|
| O75947 | ATP5H | ATP synthase D chain, mitochondrial | 0.84 | 3.5 | 4.2 | 0.906 |
| P11413 | G6PD | Glucose-6-phosphate 1-dehydrogenase | 1.5 | 6.34 | 4.23 | 0.965 |
|
|
|
|
|
|
|
|
| O75116 | ROCK2 | Rho-associated protein kinase 2 | 0.67 | 3 | 4.5 | 0.959 |
|
|
|
|
|
|
|
|
| O60841 | EIF5B | Eukaryotic translation initiation factor 5B; eIF-5B | 0.84 | 4.5 | 5.4 | 0.918 |
| P06737 | PYGL | Glycogen phosphorylase, liver form | 1.5 | 8.5 | 5.67 | 0.833 |
|
|
|
|
|
|
|
|
|
|
|
|
|
|
|
|
| Q9UJS0 | SLC25A13 | Calcium-binding mitochondrial carrier protein aralar2 | 0.5 | 3 | 6 | 0.841 |
| P16435 | POR | NADPH-cytochrome P450 reductase | 0.5 | 3.17 | 6.34 | 0.906 |
|
|
|
|
|
|
|
|
|
|
|
|
|
|
|
|
| P41219 | PRPH | Peripherin | 0.5 | 3.67 | 7.34 | 0.941 |
|
|
|
|
|
|
|
|
| O43491 | EPB41L2 | Band 4.1–like protein 2 | 0.67 | 6.34 | 9.5 | 0.96 |
|
|
|
|
|
|
|
|
| P78344 | EIF4G2 | Eukaryotic translation initiation factor 4 γ 2; eIF-4G 2 | 0.5 | 5 | 10 | 0.948 |
| P46977 | STT3A | Dolichyl-diphosphooligosaccharide-protein glycosyltransferase subunit STT3A | 0.34 | 3.34 | 10 | 0.976 |
|
|
|
|
|
|
|
|
|
|
|
|
|
|
|
|
|
|
|
|
|
|
|
|
|
|
|
|
|
|
|
|
|
|
|
|
|
|
|
|
|
|
|
|
|
|
|
|
| P06312 | IGKV4-1 | Ig κ chain v-iv region precursor | 0.3 | 4.34 | 14.5 | 0.98 |
|
|
|
|
|
|
|
|
| P01861 | IGHG4 | Ig γ-4 chain c region | 0.3 | 4.84 | 16.1 | 0.817 |
|
|
|
|
|
|
|
|
|
|
|
α |
|
|
|
|
|
|
|
|
|
|
|
|
| Q14956 | GPNMB | Putative transmembrane protein nmb precursor | 0.3 | 5.5 | 18.3 | 0.819 |
| P01860 | IGHG3 | Ig γ-3 chain c region | 0.3 | 6 | 20 | 0.879 |
| P31944 | CASP14 | Caspase-14 precursor | 0.3 | 6.84 | 22.8 | 0.819 |
|
|
|
|
|
|
|
|
|
|
|
|
|
|
|
|
| Q9Y6R7 | FCGBP | IgGFc-binding protein | 0.3 | 42.3 | 141 | 0.833 |
|
|
|
|
|
|
|
|

Note: Proteins with bold type indicate that they were once involved in breast cancer.
Identifications (IDs) from Uniprot database.
c0 and c1 represent mean spectral count (SC) for ERα+ and ERα− samples, respectively; zero (0) was replaced with nine tenths of lowest mean value, which is 0.3.
The authors declared no potential conflicts of interest with respect to the authorship and/or publication of this article.
This work was supported by National Institutes of Health (NIH) grants RO1 HL 67569, PO1 70694 and the Carole & Ray Neag Comprehensive Cancer Center, University of Connecticut Health Center.
References
Supplementary Material
Please find the following supplemental material available below.
For Open Access articles published under a Creative Commons License, all supplemental material carries the same license as the article it is associated with.
For non-Open Access articles published, all supplemental material carries a non-exclusive license, and permission requests for re-use of supplemental material or any part of supplemental material shall be sent directly to the copyright owner as specified in the copyright notice associated with the article.