
Abstract
The T-box transcription factors TBX2 and TBX3 are overexpressed in several cancers and are able to bypass senescence by repressing ARF and p21WAF1/CIP1/SDII. Although these studies suggest that they may both contribute to the oncogenic process by repressing common targets, whether they have redundant or distinct roles in cancers where they are both overexpressed remains to be elucidated. Importantly, when Tbx2 function is inhibited in melanoma cells lacking Tbx3, the cells senesce, but whether this is possible in melanoma cells overexpressing both proteins is not known. An understanding of this issue may have important implications for the design of an effective pro-senescence therapy. In this study, the authors used a sh-RNA approach to knock down TBX2 and TBX3 individually in 2 human melanoma cell lines that overexpress both these factors and then examined their specific involvement in the oncogenic process. They demonstrate, using in vitro and in vivo cell proliferation, as well as colony- and tumor-forming ability and cell motility assays, that TBX2 and TBX3 have distinct roles in melanoma progression. In the tested lines, although TBX2 could promote proliferation and transformation and was required by primary melanoma cells for immortality, TBX3 was required for tumor formation and cell migration. These findings were reproducible in a human breast cancer cell line, which confirms that TBX2 and TBX3, although highly homologous, do not have redundant roles in the transformation process of cancers where they are both overexpressed. These results have important implications for the development of new cancer treatments and in particular for melanoma, which is a highly aggressive and intractable cancer.
Introduction
The closely related proteins TBX2 and TBX3 belong to the developmentally important T-box family of transcription factors, which are defined by their highly conserved DNA binding domain called the T-box. 1 TBX2 and TBX3 have evolved from the same ancestral gene and share >90% identity within their DNA binding domains. Initially, these two proteins were speculated to have redundant roles in embryonic development because they are expressed in overlapping patterns in several tissues. Further studies, however, revealed that although TBX2 and TBX3 are both essential for the developing limb, 2 heart, 3 and mammary gland, 4,5 they have distinct spatiotemporal expression patterns and functions. Furthermore, mutational studies show that although the homozygous inactivation of either Tbx2 or Tbx3 results in embryonic lethality, 6,7 Tbx2 and Tbx3 heterozygous mutants display distinct phenotypes.
Interestingly, TBX2 and TBX3 can both function as transcriptional repressors and have been implicated in cell cycle regulation and in the genesis of several cancers. For example, they can promote the bypass of senescence by downregulating expression of the negative cell cycle regulators p19ARF and p21WAF1/CIP1/SDII (referred to as p21). 8-11 Additionally, both factors are overexpressed in numerous human cancers, including ovarian, cervical, pancreatic, breast, and melanoma. 9,11-19 Although these studies suggest that TBX2 and TBX3 may contribute to the oncogenic process by bypassing senescence through their ability to repress common targets, whether they have redundant or distinct roles in cancers where they are both overexpressed has not yet been elucidated. Importantly, when Tbx2 function is inhibited in mouse melanoma cells lacking Tbx3, the cells senesce, 18 but whether this is possible in human melanoma cells overexpressing both proteins is not known. This study addresses this issue because it has important implications for the design of an effective pro-senescence therapy. We use a sh-RNA approach to stably silence either TBX2 or TBX3 in 2 melanoma cell lines that overexpress both these factors and then examine their specific involvement in the oncogenic process. The results show that TBX2 and TBX3 do indeed impact directly on the oncogenic process because knocking down either protein is sufficient to reduce several features of transformation in all cell lines tested. Importantly, our results show that TBX2 and TBX3 do not have redundant roles in oncogenesis because although TBX2 functions as a potent growth-promoting factor, TBX3 contributes to tumor formation and invasion. Furthermore, these findings were reproducible in a breast cancer cell line, which demonstrates that TBX2 and TBX3 play important but distinct roles in the transformation process of cancers where they are both overexpressed.
Results
Establishment of VGP Melanoma Cell Lines in Which TBX2 or TBX3 Was Stably Silenced
The highly homologous T-box transcription factors, TBX2 and TBX3, are overexpressed in a number of cancers, but whether they play distinct or redundant roles in the oncogenic process remains poorly understood. To begin to explore this question, we first screened a panel of melanoma cell lines to identify a line that expresses high levels of both TBX2 and TBX3. The ME1402 melanoma cell line, which was obtained from a vertical growth phase (VGP) tumor, was found to express high levels of both TBX2 and TBX3 (Fig. 1A). This cell line was thus selected and was particularly interesting because TBX2 and TBX3 were previously shown to repress the cell adhesion molecule, E-cadherin, 20 which is characteristically lost during the transition from radial growth phase to VGP. 21 The cells were stably transfected with the pSuper.neo/GFP (Oligoengine, Seattle, WA) expression vector encoding shRNA sequences that target TBX2, TBX3, or a scrambled control sequence. Following the generation of stable cell lines, a number of G418-resistant clones were isolated, and Figure 1B shows clones in which either TBX2 or TBX3 was effectively knocked down compared to the ME1402 control cells and was used for further analyses.
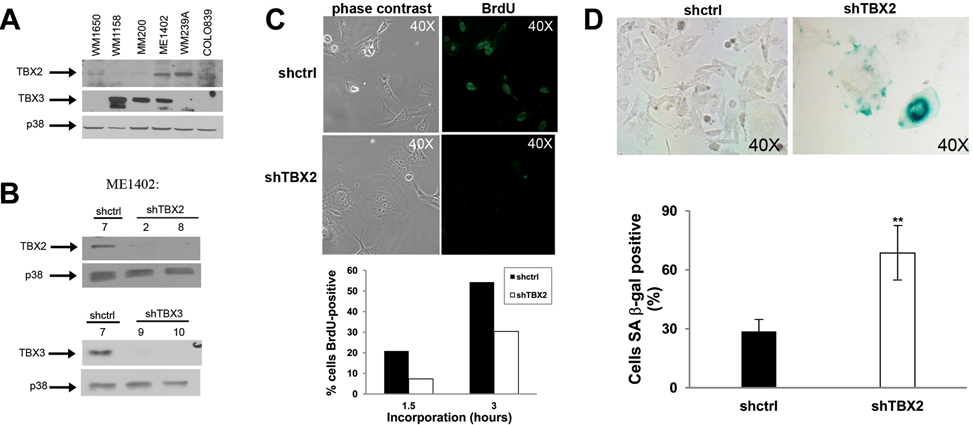
Knocking down TBX2 induces senescence in vertical growth phase (VGP) melanoma cells. (
Knocking Down TBX2 Induces Senescence in a VGP Melanoma Cell Line
While culturing the ME1402 shTBX2 cells, we observed that by passage 3, we were unable to expand the cells as many were lifting, and the remaining adherent cells appeared to be proliferating very slowly. BrdU incorporation assays were therefore performed to determine whether silencing TBX2 had a negative effect on the proliferative ability of these cells. Shcontrol and shTBX2 cells were incubated with BrdU, and Figure 1C shows the total number of BrdU-positive cells expressed as a percentage of the total number of cells from 10 fields of view for each cell line. Whereas 20% of the shcontrol cells had incorporated BrdU at 1.5 h, only 7.3% of the shTBX2 cells were BrdU positive at this time. This trend was also observed at 3 h of incubation with BrdU. Furthermore, the shTBX2 cells had a more flattened and enlarged morphology, reminiscent of senescent cells (Fig. 1C, upper left panels), and therefore we next tested the cells for senescence-associated β-galactosidase (SA-β-gal) activity. We observed that after 24 h, many more shTBX2 cells were positive as compared to the shcontrol cells (Fig. 1D). Furthermore, when the cells were stained with Hoechst 33258, specialized domains of transcriptionally silent senescence-associated heterochromatic foci 22 were observed only in the shTBX2 cells (data not shown). Taken together, these results show that knocking down TBX2 levels can induce senescence in the ME1402 VGP melanoma cells. This is in agreement with previous results in which Tbx2 was silenced by siRNA in B16 melanoma cells that express Tbx2 but not Tbx3. 18 Furthermore, the above results were interesting in light of previous work that showed that senescence could also be induced in human melanoma cells using a dominant-negative approach, which potentially targeted both TBX2 and TBX3. 18
Knocking Down TBX3 Increases the Proliferative Ability of VGP Melanoma Cells
If the silencing of TBX2 alone in a human melanoma cell line is sufficient to induce senescence, TBX3 could be performing a different role. Indeed, in contrast to the TBX2 knockdown cells, the shTBX3 cells grew faster than the shcontrol cells (Fig. 2A). We next investigated the effect of silencing TBX3 expression on growth factor dependence by measuring the proliferative ability of the ME1402 melanoma cells in medium containing low (2%) serum. It is important to note that growth curve analyses comparing the shcontrol cells in 10% and 2% serum showed that their growth was responsive to the levels of growth factors present in their culture medium (data not shown). This is consistent with other reports for both poorly and highly metastatic melanoma cells. 23,24 Compared to the shcontrol cells, however, the shTBX3 cells maintained a higher proliferative ability under low serum conditions (Fig. 2B).
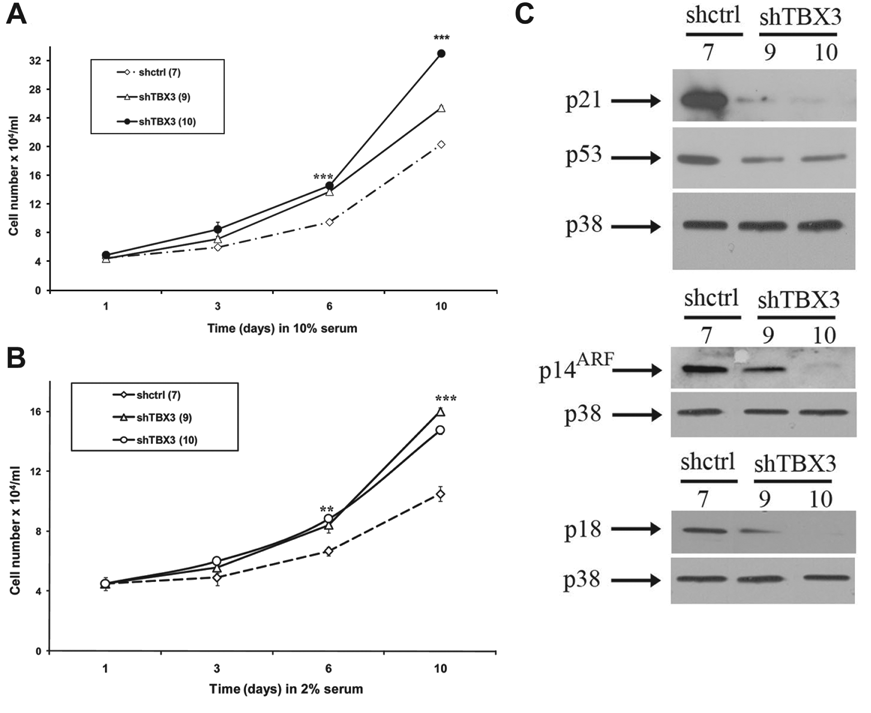
Silencing TBX3 increases the proliferative ability of ME1402 vertical growth phase (VGP) melanoma cells. (
The above results were somewhat unexpected because TBX3 has previously been shown to favor proliferation by both bypassing senescence and compromising p53-dependent and independent pathways. 8,25-27 The effect of knocking down TBX3 on levels of several potential pro-senescence factors was therefore analyzed, and our results show that the shTBX3 cells had reduced levels of all pro-senescence factors tested (Fig. 2C). It is important to note that although both p19/p14ARF and p21 have been shown to be directly repressed by TBX3, 8,10 in this instance we believe that the reduced levels of these proteins in the shTBX3 cell lines are a secondary effect of knocking down TBX3. These results thus suggest that the increase in proliferative ability of the ME1402 VGP melanoma cells in which TBX3 is silenced results from a decrease in pro-senescence factors.
Knocking Down TBX3 Reduces Anchorage-Independent Growth, Tumor-Forming Ability, and Migration of VGP Melanoma Cells
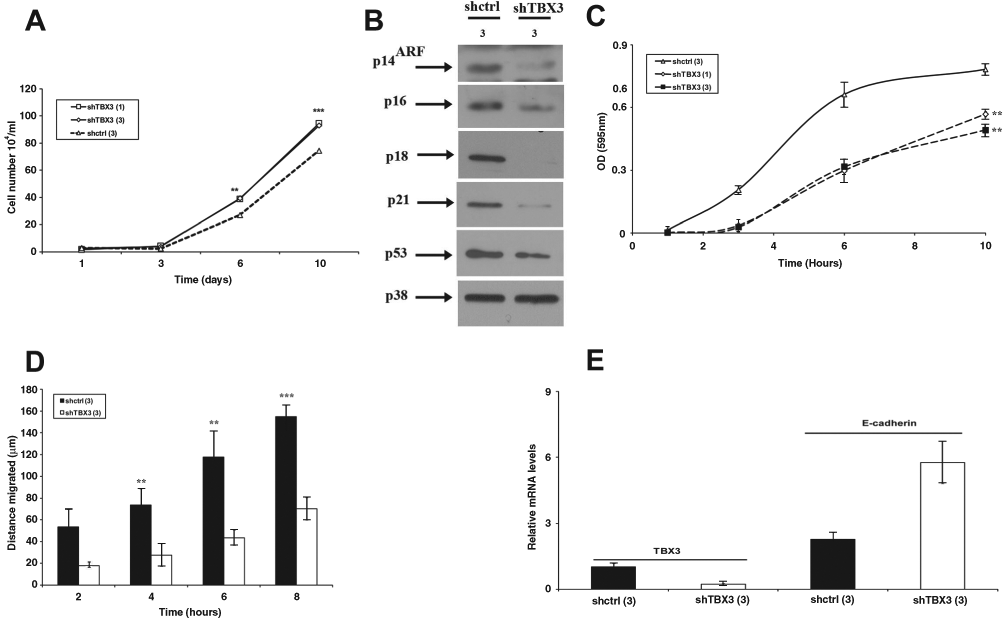
The above results indicate that TBX3 can promote the expression of several antiproliferative factors. Recent studies have also suggested that TBX3 may play a crucial role in enhancing melanoma invasiveness. This was shown, in part, to result from its ability to repress the expression of the cell adhesion molecule E-cadherin, 20 which mediates adhesion of melanocytes to keratinocytes and is characteristically downregulated in the transition to VGP melanoma. 21 We therefore further analyzed the effect of knocking down TBX3 on the anchorage-independent growth and colony-forming ability of ME1402 cells. Figure 3A and B show that the shTBX3 cells indeed had reduced anchorage-independent growth and formed fewer and smaller colonies. We next compared the migratory ability of the ME1402 shTBX3 and shcontrol cells by the 2-dimensional scratch assay, and Figure 3C shows that the shTBX3 cells had a significantly reduced migration rate. To determine a possible mechanism by which TBX3 affects melanoma cell adhesion and migration, we investigated the levels of E-cadherin expression in ME1402 shcontrol and shTBX3 cells. As expected, the shTBX3 cells had lower levels of TBX3 mRNA and an increase in E-cadherin mRNA levels (Fig. 3D).
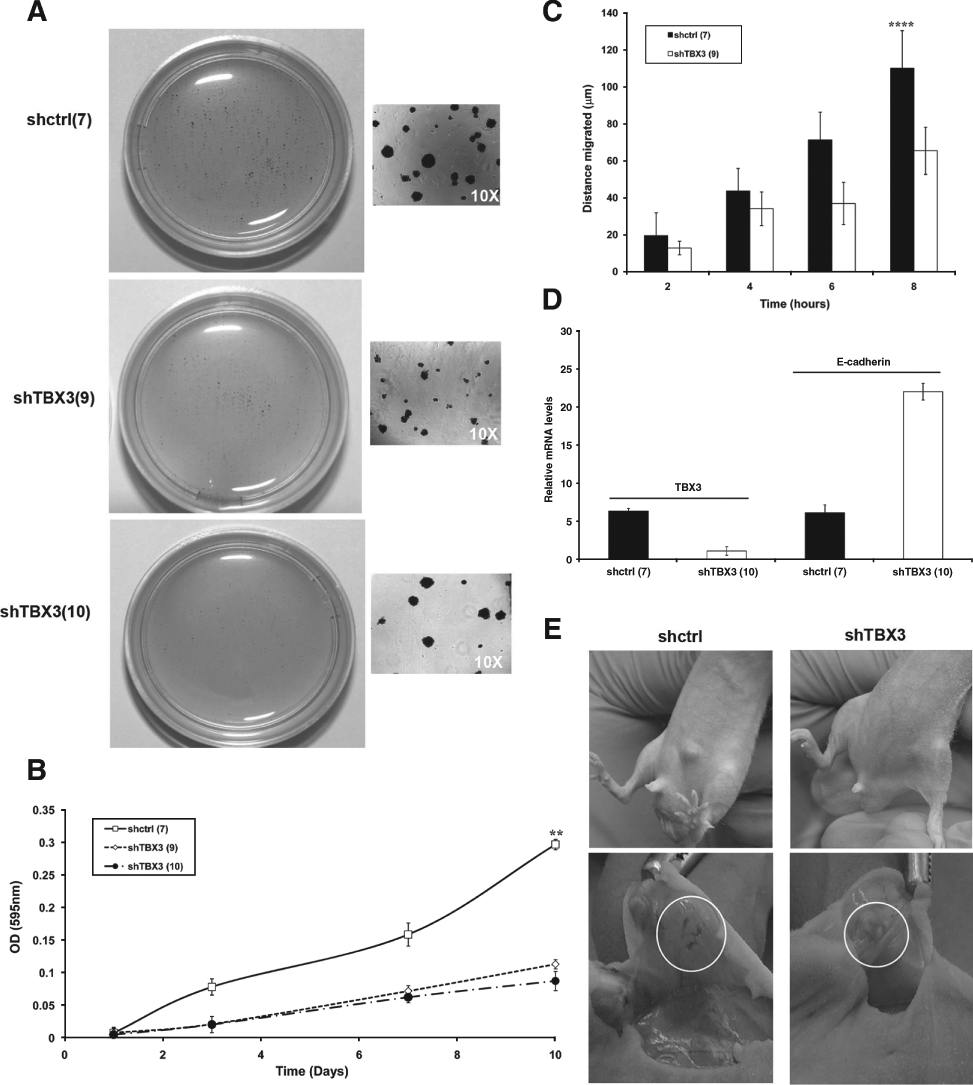
TBX3 promotes anchorage-independent growth, tumor-forming ability, and migration of vertical growth phase (VGP) melanoma cells. (
The results described above demonstrate that although knocking down TBX3 increases the proliferative ability of attached melanoma cells, it reduces their anchorage-independent growth and motility. This raised the interesting possibility that TBX3 may increase the tumor-forming and invasive ability of ME1402 cells. The shTBX3 and shcontrol cells were therefore injected subcutaneously into nude mice and tumor growth monitored over 36 days. Whereas 3 out of 4 mice injected with shcontrol cells developed tumors at the site of injection, no tumors were observed in mice injected with the shTBX3 cells (differences are statistically significant as determined by the Fisher exact test, P < 0.05; Fig. 3E, top). Furthermore, subiliac lymph nodes of all mice injected with shcontrol cells were enlarged and hypervascularized, which suggests that the control cells have metastatic ability (Fig. 3E, bottom).
TBX2 Promotes Cell Proliferation and TBX3 the Colony-Forming Ability and Migration of Metastatic 501 mel Cells
To confirm that TBX2 and TBX3 play distinct roles in melanoma progression, they were independently knocked down in the 501 mel cell line, which was derived from a metastatic melanoma 28 and overexpressed both TBX2 and TBX3 (Figs. 4 A and B). 20 Although the 501 mel shTBX2 cells did not exhibit a senescence morphology or SA-β-gal activity like that seen for the ME1402 shTBX2 cells (data not shown), they proliferated at a significantly slower rate as compared to the shcontrol cells (Fig. 4C). Furthermore, unlike the shcontrol cells, the shTBX2 cells struggled to survive in low serum medium (Fig. 4D) and had considerably reduced colony-forming ability in suspension (Figs. 4 E and F). Interestingly, results from a cell motility scratch assay revealed no significant difference between the migratory ability of the shcontrol and shTBX2 cells (Fig. 4G). Taken together, although TBX2 promotes proliferation of 501 mel cells with reduced mitogenic stimuli and without a substrate, it had no effect on the migratory ability of the cells.
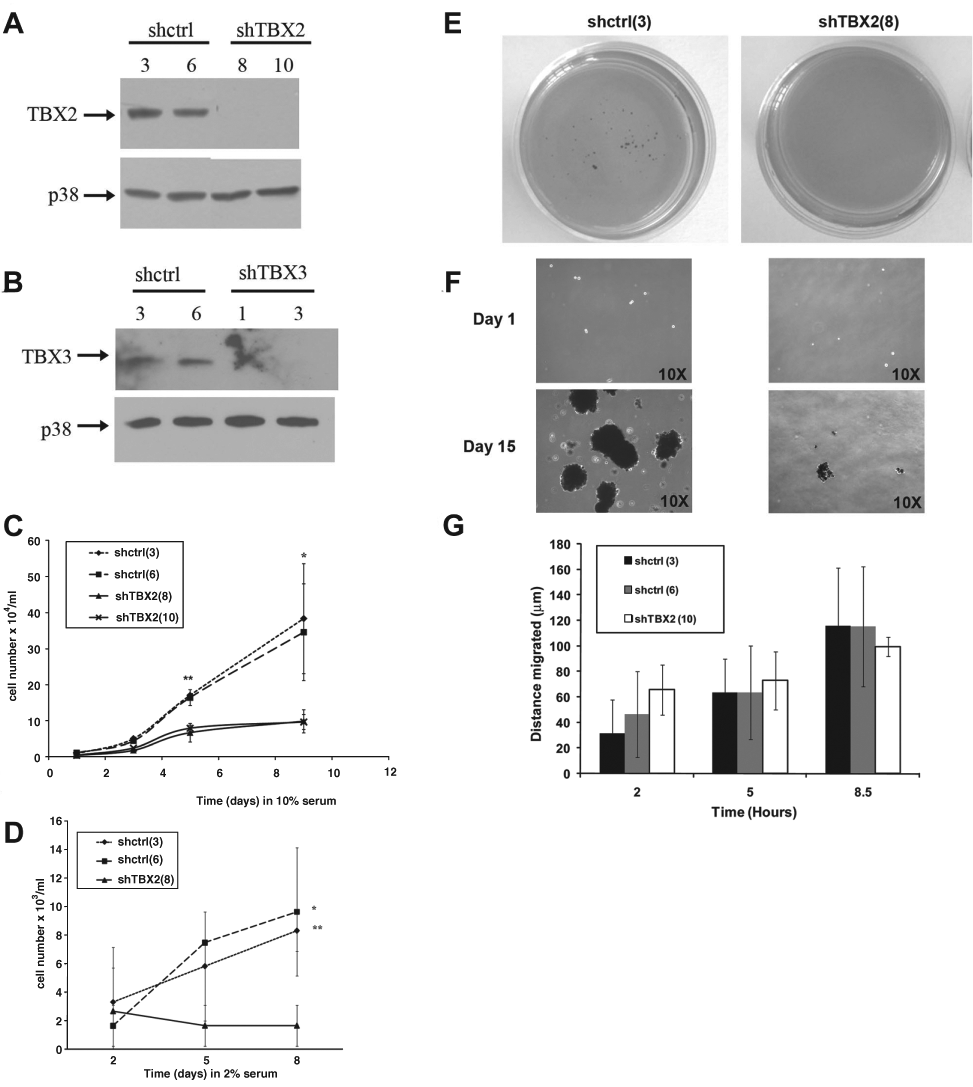
TBX2 promotes proliferation of a metastatic melanoma cell line under conditions of reduced mitogenic stimuli and in the absence of a substrate. (
Consistent with results obtained for the ME1402 cell line, silencing TBX3 in the 501 mel cells led to an increase in cell proliferation (Fig. 5A), which was associated with a decrease in levels of the cell cycle regulators, p14ARF, p16, p18, p21, and p53 (Fig. 5B). Furthermore the 501 mel shTBX3 cells showed reduced anchorage-independent growth (Fig. 5C), reduced migration ability (Fig. 5D), and an increase in E-cadherin mRNA levels (Fig. 5E).
TBX3 promotes anchorage-independent growth and migration of metastatic melanoma cells. (
The Differential Effect of Knocking Down TBX2 and TBX3 Is Reproducible in the MCF-7 Breast Cancer Cells
To test whether silencing TBX2 and TBX3 expression in another cancer cell line would result in a similar loss of transformation potential, they were both individually knocked down in the MCF-7 breast cancer cells, which express high levels of both TBX2 and TBX3 (Figs. 6 A and B). 9,19 Consistent with the results obtained for the melanoma cell lines above, knocking down TBX2 significantly reduced the proliferative but not the migratory ability of the MCF-7 breast cancer cells (Figs. 6 C and D). Furthermore, knocking down TBX3 resulted in an increased proliferation but reduced migration rate of the MCF-7 breast cancer cells (Figs. 6 E and F).
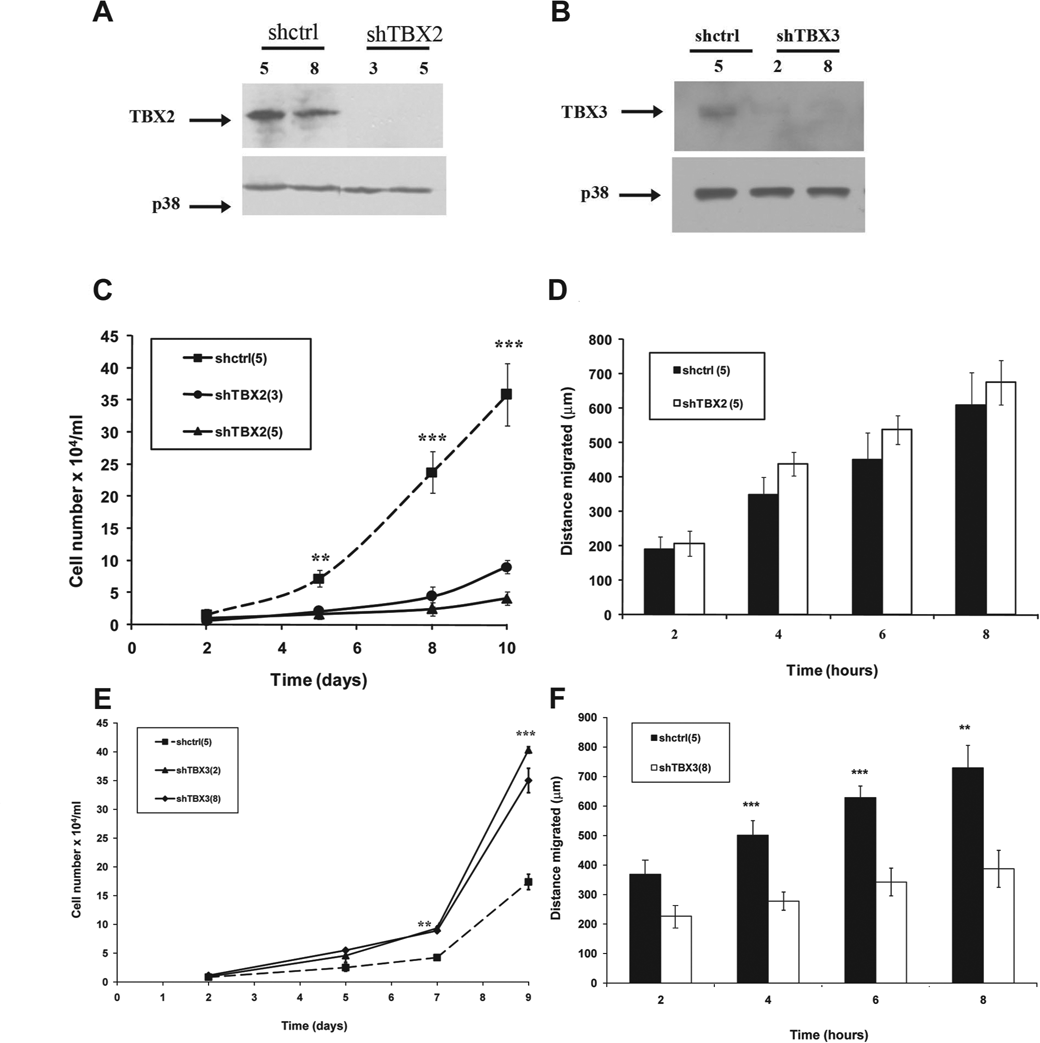
The effect of knocking down TBX2 and TBX3 on cell proliferation and migration is reproducible in a breast cancer cell line. (
Discussion
Malignant melanoma is an extremely aggressive skin tumor that progresses and metastasizes rapidly and is insensitive to conventional chemotherapy and radiotherapy. The highly homologous T-box factors, TBX2 and TBX3, are overexpressed in a subset of melanomas, but it is not clear whether they have redundant or distinct roles in melanoma progression. This study addresses this question by stably silencing TBX2 and TBX3 individually in melanoma cell lines in which they were previously shown to be overexpressed. The results show that TBX2 and TBX3 do indeed impact directly on melanoma progression because knocking down either protein is sufficient to reduce several features of transformation. Importantly, our results show that TBX2 and TBX3 have distinct roles in oncogenesis, with TBX2 functioning as a potent growth-promoting factor and TBX3 contributing to tumor formation and invasion. The significance of these results is underscored by our data showing reproducible results in a breast cancer cell line.
Evidence that overexpressed TBX2 functions as a potent growth promoting factor was obtained. Knocking down TBX2 induces senescence in a vertical growth phase melanoma cell line and significantly reduces the proliferative ability of a metastatic melanoma and breast cancer cell line. Furthermore, TBX2 promoted the proliferation of the latter cancer cells under conditions of reduced mitogenic stimuli and without a substrate. The different results obtained above could possibly result from additional mutations that drive VGP to metastatic melanoma, providing a further block to senescence and cooperating with TBX2 to promote cell proliferation. This may also be the case for the breast cancer cell line used in this study, which also has, albeit poor, metastatic potential. 29,30 Interestingly, however, reducing TBX2 levels did not affect the migration rate of either metastatic melanoma or breast cancer cell line. These data would suggest that TBX2 contributes to the oncogenic process primarily by increasing proliferation or suppressing senescence rather than contributing to invasive ability. This positive effect of TBX2 on proliferation is consistent with previous reports that silencing Tbx2 expression using a dominant negative approach induced senescence in B16 mouse melanoma cells and that expression of Tbx2 in BMI−/− mouse embryonic fibroblasts enabled these cells to bypass senescence under conditions where control cells senesce. 9,18 TBX2 would therefore appear to be a downstream mediator of signaling pathways regulating cell proliferation but not motility during oncogenesis. Interestingly, the p38 kinase, which we previously showed upregulates TBX2 levels in response to DNA damage, 31 was reported to influence cell proliferation similarly with no effect on motility in mouse melanoma cells treated with hepatocyte growth factor/scatter factor. 32
The finding that reduced TBX2 levels did not affect the migration rate of cancer cells is interesting in light of our data obtained for its closely related family member TBX3. Although silencing TBX3 led to an increase in the proliferation of VGP and metastatic melanoma cells as well as breast cancer cells, it was shown to reduce tumor formation and invasion in nude mice. These results are consistent with reported findings that the proliferation capacity of cancer cells does not necessarily match their metastatic potential. 12,33 Furthermore, Carreira et al. 34 showed that the Microphthalmia-associated transcription factor (Mitf) can both inhibit melanoma invasiveness and promote their proliferation via regulation of Dia1. Studies aimed at elucidating the molecular mechanisms regulating TBX3 will be important to shed light on its role in tumor formation and invasion. A recent study by Rodriguez et al. 20 has provided compelling evidence to show that TBX3 promotes melanoma invasiveness by directly binding to and repressing the E-cadherin gene. Our study shows that the less invasive TBX3-depleted melanoma cell lines have increased levels of E-cadherin, which provide additional support for E-cadherin repression, contributing to TBX3’s role in melanoma invasion.
In conclusion, the results obtained from this study undoubtedly show that TBX2 and TBX3 do indeed play causative but distinct roles in the oncogenic process. This was illustrated by the significantly reduced transforming potential when either TBX2 or TBX3 was knocked down in breast cancer and melanoma cell lines that overexpress both these proteins. Finally, our results suggest that TBX2 and TBX3 are attractive novel targets in the development of anticancer drugs and that whereas the inhibition of TBX2 may be effective in the development of a pro-senescence therapy for certain melanomas, more reliable novel therapies may need to inactivate both factors.
Materials and Methods
Cell Lines and Culture Conditions
Human MCF-7 breast adenocarcinoma cells were maintained in RPMI 1640 medium (Highveld Biological, Lyndhurst, UK) supplemented with 10% fetal bovine serum (FBS), 100 U/mL penicillin, 100 µg/mL streptomycin, 1 mM sodium pyruvate, 0.1 mM minimum essential medium (MEM) nonessential amino acids, and 0.01 mg/mL insulin. All human melanoma cells were maintained in RPMI 1640 supplemented with 10% FBS, 100 U/mL penicillin, and 100 µg/mL streptomycin, except for WM1650 cells, which were cultured in RPMI supplemented with 10% FBS, 100 U/mL penicillin, 100 µg/mL streptomycin, 200 nM TPA (12-O-tetradecanoylphorbol 13-acetate), and 200 pM cholera toxin. Cells were maintained at 37°C in an atmosphere of 5% CO2.
Generation of Stable Cell Lines with Knockdown of TBX2 and TBX3 Expression
To generate stably transfected cell lines in which TBX2 or TBX3 mRNA levels are knocked down, oligonucleotides targeting 5′-ACAGCTGAAGATCGACAACAA-3′ (TBX2 siRNA) and 5′-CTGCCTATAGAGATATATTCA-3′ (TBX3 siRNA) of the human coding sequences were cloned into the pSuper.neo/GFP (Oligoengine) shRNA expression vector. The nonspecific siRNA oligonucleotide (shcontrol) was directed against a 5′-ATTTCTCCGAACGTGTCACGT-3′ target sequence. MCF-7, 501 mel, and ME1402 cells were transfected with the pSuper.neo/GFP expression vector containing sequences targeted to TBX2, TBX3, or the nonspecific control using FugeneHD (Roche Diagnostics, Basel, Switzerland) for MCF-7 cells or Transfectin® (BioRad, Hercules, CA) for 501 mel and ME1402 melanoma cells.
Western Blot Analysis
Cells were harvested and protein prepared as described previously. 35 Primary antibodies used were as follows: rabbit polyclonal anti-TBX3 (Zymed, San Francisco, CA) and rabbit polyclonal anti-p38 (Sigma, St. Louis, MO), goat polyclonal anti-TBX2 (sc-17880), rabbit polyclonal anti-p53 (sc-6243), anti-p21 (sc-756), anti-p18INK4C (sc-865), anti-p16 (sc-759), and anti-p14 (sc-1063) (Santa Cruz Biotechnology, Santa Cruz, CA).
Senescence-Associated Beta-Galactosidase (SA-β-Gal) Assay
Cells were seeded on glass coverslips, fixed in 4% paraformaldehyde for 15 min at room temperature (RT), and incubated in SA-β-gal staining solution (5 mM potassium ferrocyanide, 5 mM potassium ferricyanide, 2 mM Mg2Cl2, 1 mg/mL x-gal, phosphate-buffered saline [PBS] pH 6). Positive staining was assessed by brightfield microscopy over a time period of 30 h.
5-Bromo-2-Deoxyuridine (BrdU) Incorporation Assay
BrdU incorporation assays were performed as described previously 35 using 10 µM BrdU and a mouse monoclonal anti-BrdU antibody (6 µg/mL; Roche), followed by a secondary immunoglobulin G coupled to Alexa 488 (1:1000; Molecular Probes, Carlsbad, CA).
Growth Curves
Short-term growth of the shTBX2 and shTBX3 cell lines was compared to that of the shcontrol cell lines over a 10-day period, as described previously. 36 Cell numbers for plating were as follows: 104 cells/well for the MCF-7 cell lines, 0.5 × 10⁴ cells/well for the 501 mel cell lines, and 0.75 × 10⁴ cells/well for the ME1402 cell lines.
Anchorage Independence Assay
Soft agar growth was performed in 35-mm dishes in duplicate. Dishes were layered first with 0.5% agar in cell culture medium followed by 0.35% agar in cell culture medium containing 1500 cells. At 14 days, cultures were stained with p-iodonitrotetrazolium chloride (1 mg/mL), incubated overnight at 37°C, and photographed. As an alternative assay for anchorage-independent growth, the wells of a 96-well plate were coated with 12 mg/mL poly(2-hydroxyethyl methacrylate) (Sigma) and cells seeded at a concentration of 2 × 10³ cells/well for ME1402 cells and 103 cells/well for 501 mel cells in cell culture medium containing 0.8% methylcellulose (Sigma). Net cell growth was monitored using the MTT assay, according to the manufacturer’s instructions (Roche).
In Vitro Cell Migration Assay
Cell migration in culture was measured using a 2-dimensional in vitro scratch motility assay. Cells were grown to confluence on tissue culture dishes, and a linear wound was made by scratching through the monolayer. To prevent cell proliferation, Mitomycin C (Sigma) was added at a final concentration of 10 µg/mL. Several markings were made along the edges of the scratch line that were used as reference points. The wound widths were measured at the time of the scratching (0 h) and at different time points as indicated on figures. To induce migration in the MCF-7 cells, TPA was added at a final concentration of 100 nM. Pictures were taken using a fluorescence microscope, and migration distances were measured using AxioVision software (Zeiss, Jena, Germany). The difference in width represents the distance migrated in µm.
Tumor Growth in Nude Mice
Tumorigenicity experiments were performed by subcutaneously injecting 1.95 × 10⁶ ME1402 shTBX3 or shcontrol cells in 50 µL PBS into the left flanks of 8-week-old MF-1 nude mice. All experiments were approved by and performed in accordance with the University of Cape Town Animal Research Ethics Committee.
Quantitative Real-Time PCR (qRT-PCR)
Quantitative real-time PCR of shcontrol and shTBX3 cells was performed as previously described. 31 Reactions were performed using the primers for human TBX3 (QT00022484; Qiagen, Valencia, CA), E-cadherin (1863250; Integrated DNA Technologies), and GAPDH (forward 5′-GAAGGCTGGGGCTCATTT-3′; reverse 5′-CAGGAGGCATTGCTGATGAT-3′).
Statistical Analysis
Statistical analysis was performed by using the 2-sample t test (Excel or GraphPad Prism).
Footnotes
Acknowledgements
The authors thank Professor Colin Goding (Ludwig Institute for Cancer Research, Oxford University, UK) for reading this manuscript.
The authors declared no potential conflicts of interest with respect to the authorship and/or publication of this article.
Grant support was received from South Africa Medical Research Council, Cancer Research Initiative of South Africa (CARISA), The National Research Foundation, and University of Cape Town.