
Abstract
Introduction
The ongoing accelerated change and increasing intensification of land use for agricultural purposes have led to severe forest fragmentation and habitat loss, anthropogenic processes that are also identified among the main drivers of biodiversity loss worldwide (Bełcik et al., 2020; Bonfim et al., 2021). Tropical forests are particularly vulnerable to these processes, as some critical ecosystem functions (e.g. pollination and seed dispersal) have little functional redundancy; i.e. they rely heavily on specialized biotic interactions (Andresen et al., 2018; Zhang & Zang, 2021; Török et al., 2022). This accelerated conversion of forest areas to cropland therefore raises the need to monitor the status of biodiversity (including agrobiodiversity) to establish effective conservation strategies (Andresen et al., 2018; Brito et al., 2018). The current dominant landscape in the tropics is a mosaic of cultivated fields with different types and intensities of management, and forest patches at different successional stages (Carrié et al., 2017). The distribution and permanence of native fauna in these mosaics depend on the characteristics of the landscape units, e.g. the type and intensity of their land use, their suitability as a habitat, and the connectivity within the landscape, as well as the attributes of the species present, such as their ability to move, degree of specialization in resource use (food and shelter), or sensitivity to stressors in agricultural habitats (Rader et al., 2014; Pinto et al., 2020; Millard et al., 2021).
Native bees form a taxonomic group widely recognized for its value as an indicator of habitat disturbance due to its high taxonomic diversity and variety of functional groups (Mélendez-Ramírez et al., 2014; Twerd & Sobieraj-Betlinska, 2020). Bees also play a vital role in highly important ecosystem functions such as the pollination of wild and cultivated plants, and are therefore also involved in ecosystem services of provision (Klein et al., 2007; Basu et al., 2016). When forest fragmentation occurs, it reduces the size and increases the isolation of habitat patches, leading to a reduction in floral resources and potential nesting sites for the bees, as well as impacting the richness and/or abundance of certain species (e.g. Meneses-Calvillo et al., 2010; Brito et al., 2018; Rahimi et al., 2022). The response of bees to anthropogenic habitat loss and transformation depends on certain bee characteristics. For example, body size is positively correlated with flight distance and foraging time, and large bees may also be less susceptible to habitat reduction and isolation (Williams et al., 2010; Cohen et al., 2022). Chronic soil disturbance can also reduce the number of suitable nesting sites, making intensively managed areas unfavorable for ground-nesting species (Odanaka & Rehan, 2019; Kohler et al., 2020). The use of agrochemicals can also decrease floral visitation rates in wild bees (i.e. via bee intoxication and/or a reduction in floral resources), particularly of solitary and oligolectic species given their high degree of specialization and reduced mobility (Bloom et al., 2021; Siviter et al., 2021). However, when habitat transformation increases heterogeneity at a meso(intermediate)- or large-scale, this can also diversify the supply of resources and thus indirectly favor the permanence of a more diverse group of bees (Odanaka & Rehan, 2019; Rodríguez et al., 2021; Peters et al., 2022).
Studies on the effect of different anthropogenic processes on bee communities in agricultural landscapes have mainly been conducted in temperate habitats (e.g. Kennedy et al., 2013; Bentrup et al., 2019). On the other hand, there have been relatively fewer studies in tropical regions, and those that do exist have focused on landscapes dominated by intensive monocultures or semi-intensive, poorly diversified polycultures (IPBES, 2016; Escobedo-Kenefic et al., 2020; Vogel et al., 2023). In contrast to most temperate agricultural landscapes, the heterogeneity in land use type and intensity of tropical agricultural landscapes is typically much higher (Basu et al., 2016; Laha et al., 2020; Escobedo-Kenefic et al., 2022). This heterogeneity may provide complementary habitats that together could offer a greater variety of food resources to bees than a landscape dominated by intensive monocultures (Hotspot et al., 2008; Escobedo-Kenefic et al., 2022). One particular case, still common in some regions of the tropics, is that of agricultural landscapes dominated by traditional agroecosystems (e.g. homegardens and other diversified agroforestry systems; Perfecto & Vandermeer, 2008) mixed with forest remnants. These agroecosystems present a high native plant diversity, forest-like vertical structures, and active agroecological management, characteristics that make them a suitable habitat for some native species, while also functioning as stepping stones for species with a preference for the forest interior (e.g. Galluzi et al., 2010; Rajagopal et al., 2021; Villicaña-Hernández et al., 2020).
The agricultural landscape of the Yucatan Peninsula has been characterized since ancient times by the presence of milpa (a rainfed polyculture dominated by maize, beans, and squash), homegardens dominated by trees with fleshy fruits, and forest remnants at different successional stages (Lope-Alzina & Howard, 2012; Nigh & Diemont, 2013; Ford & Topsey, 2019). Together, these habitat units provide diverse and complementary resources that are fundamental for the subsistence of the indigenous people who inhabit this region (Rodríguez-Robayo et al., 2020; Serralta-Batun et al., 2024). On the Yucatan Peninsula, previous studies conducted in milpas have found that bee richness and abundance are higher compared to intensive monocultures (Briggs et al., 2013; Landaverde et al., 2017; Vides-Borrell et al., 2019). However, in contrast to other agroecosystems and forest remnants, the suitability of homegardens as a habitat and their value in terms of bee conservation remain to be determined. The limited studies on bee diversity in traditional agroecosystems have also focused on describing the taxonomic diversity of bees (Meléndez-Ramírez et al., 2002; Meléndez-Ramírez et al., 2016 Landaverde et al., 2017; Vides-Borrell et al., 2019). Although an analysis of taxonomic diversity can indicate how species richness and abundance change in different habitat units of the landscape, this approach provides limited information on the environmental filters operating in each habitat type and on the functional groups affected, aspects that could be addressed with an analysis of functional diversity (Díaz & Cabido, 2001; Villegér et al., 2008; Mouillot et al., 2014).
This study addressed the taxonomic and functional diversity of native bees in the main landscape units (hereafter: habitats) of the agricultural landscape of the Yucatan Peninsula: the milpa, homegarden, and forest. The taxonomic composition and distribution of some functional traits of the prevalent bee species in these habitats were investigated. The habitats differ in terms of plant species richness and level of management intensity (Serralta-Batun et al., 2024), with the most diverse and least intensively managed habitat being the forest, and the least diverse and most intensively managed being the milpa. Homegardens occupy an intermediate position between these two variables (Serralta-Batun et al., 2024). Our specific research questions were: Are there differences in native bee taxonomic and functional diversity among the three dominant habitats in the landscape? and which functional traits are favored by the prevalent environmental filters in these habitats? We predicted that there would be greater taxonomic and functional diversity in the forest than in the milpa, and an intermediate level would be present in the homegardens, given the gradient of management intensity and plant diversity observed. In terms of functional groups, generalist (in terms of diet and nest site) and large bee species were expected to predominate in the less diverse and more intensively-managed habitat (milpa) while functional groups of bees with more specialized requirements and lower capacity for movement would be found mainly in the more diversified and less intensively-managed habitats (homegarden and forest).
Methods
Study System
The study area is located in the south of the state of Yucatan, Mexico, and includes the municipalities of Tahdziú and Tzucacab (20°00'-13' N, 88°-89°02’W; Figure 1). The climate of the area is warm sub-humid with rainfall in summer and the mean annual temperature is 25.8 °C (Camacho-Villa et al., 2021). The numbers of inhabitants were 15,346 and 5,854 in Tzucacab and Tahdziú, respectively (Instituto Nacional de Estadística y Geografía [INEGI], 2020). In both municipalities, the population is mostly of Maya ethnicity (INEGI, 2020). The livelihood of most families is based on primary activities such as agriculture, mainly milpa (Serralta-Batun et al., 2024), complemented with food resources produced in their homegardens (fruits, vegetables, and animal protein), as well as the extraction of timber (e.g. Psicidia piscipula, Diospyros cuneata) and non-timber (e.g. Sabal yapa, Sabal mexicana) forest resources from the tropical forest remnants (Cruz-Cortés et al., 2019). Location of the study area and habitats sampled: Forest patches (forest), homegardens and milpa. The upper right insert shows the Yucatan Peninsula, Mexico.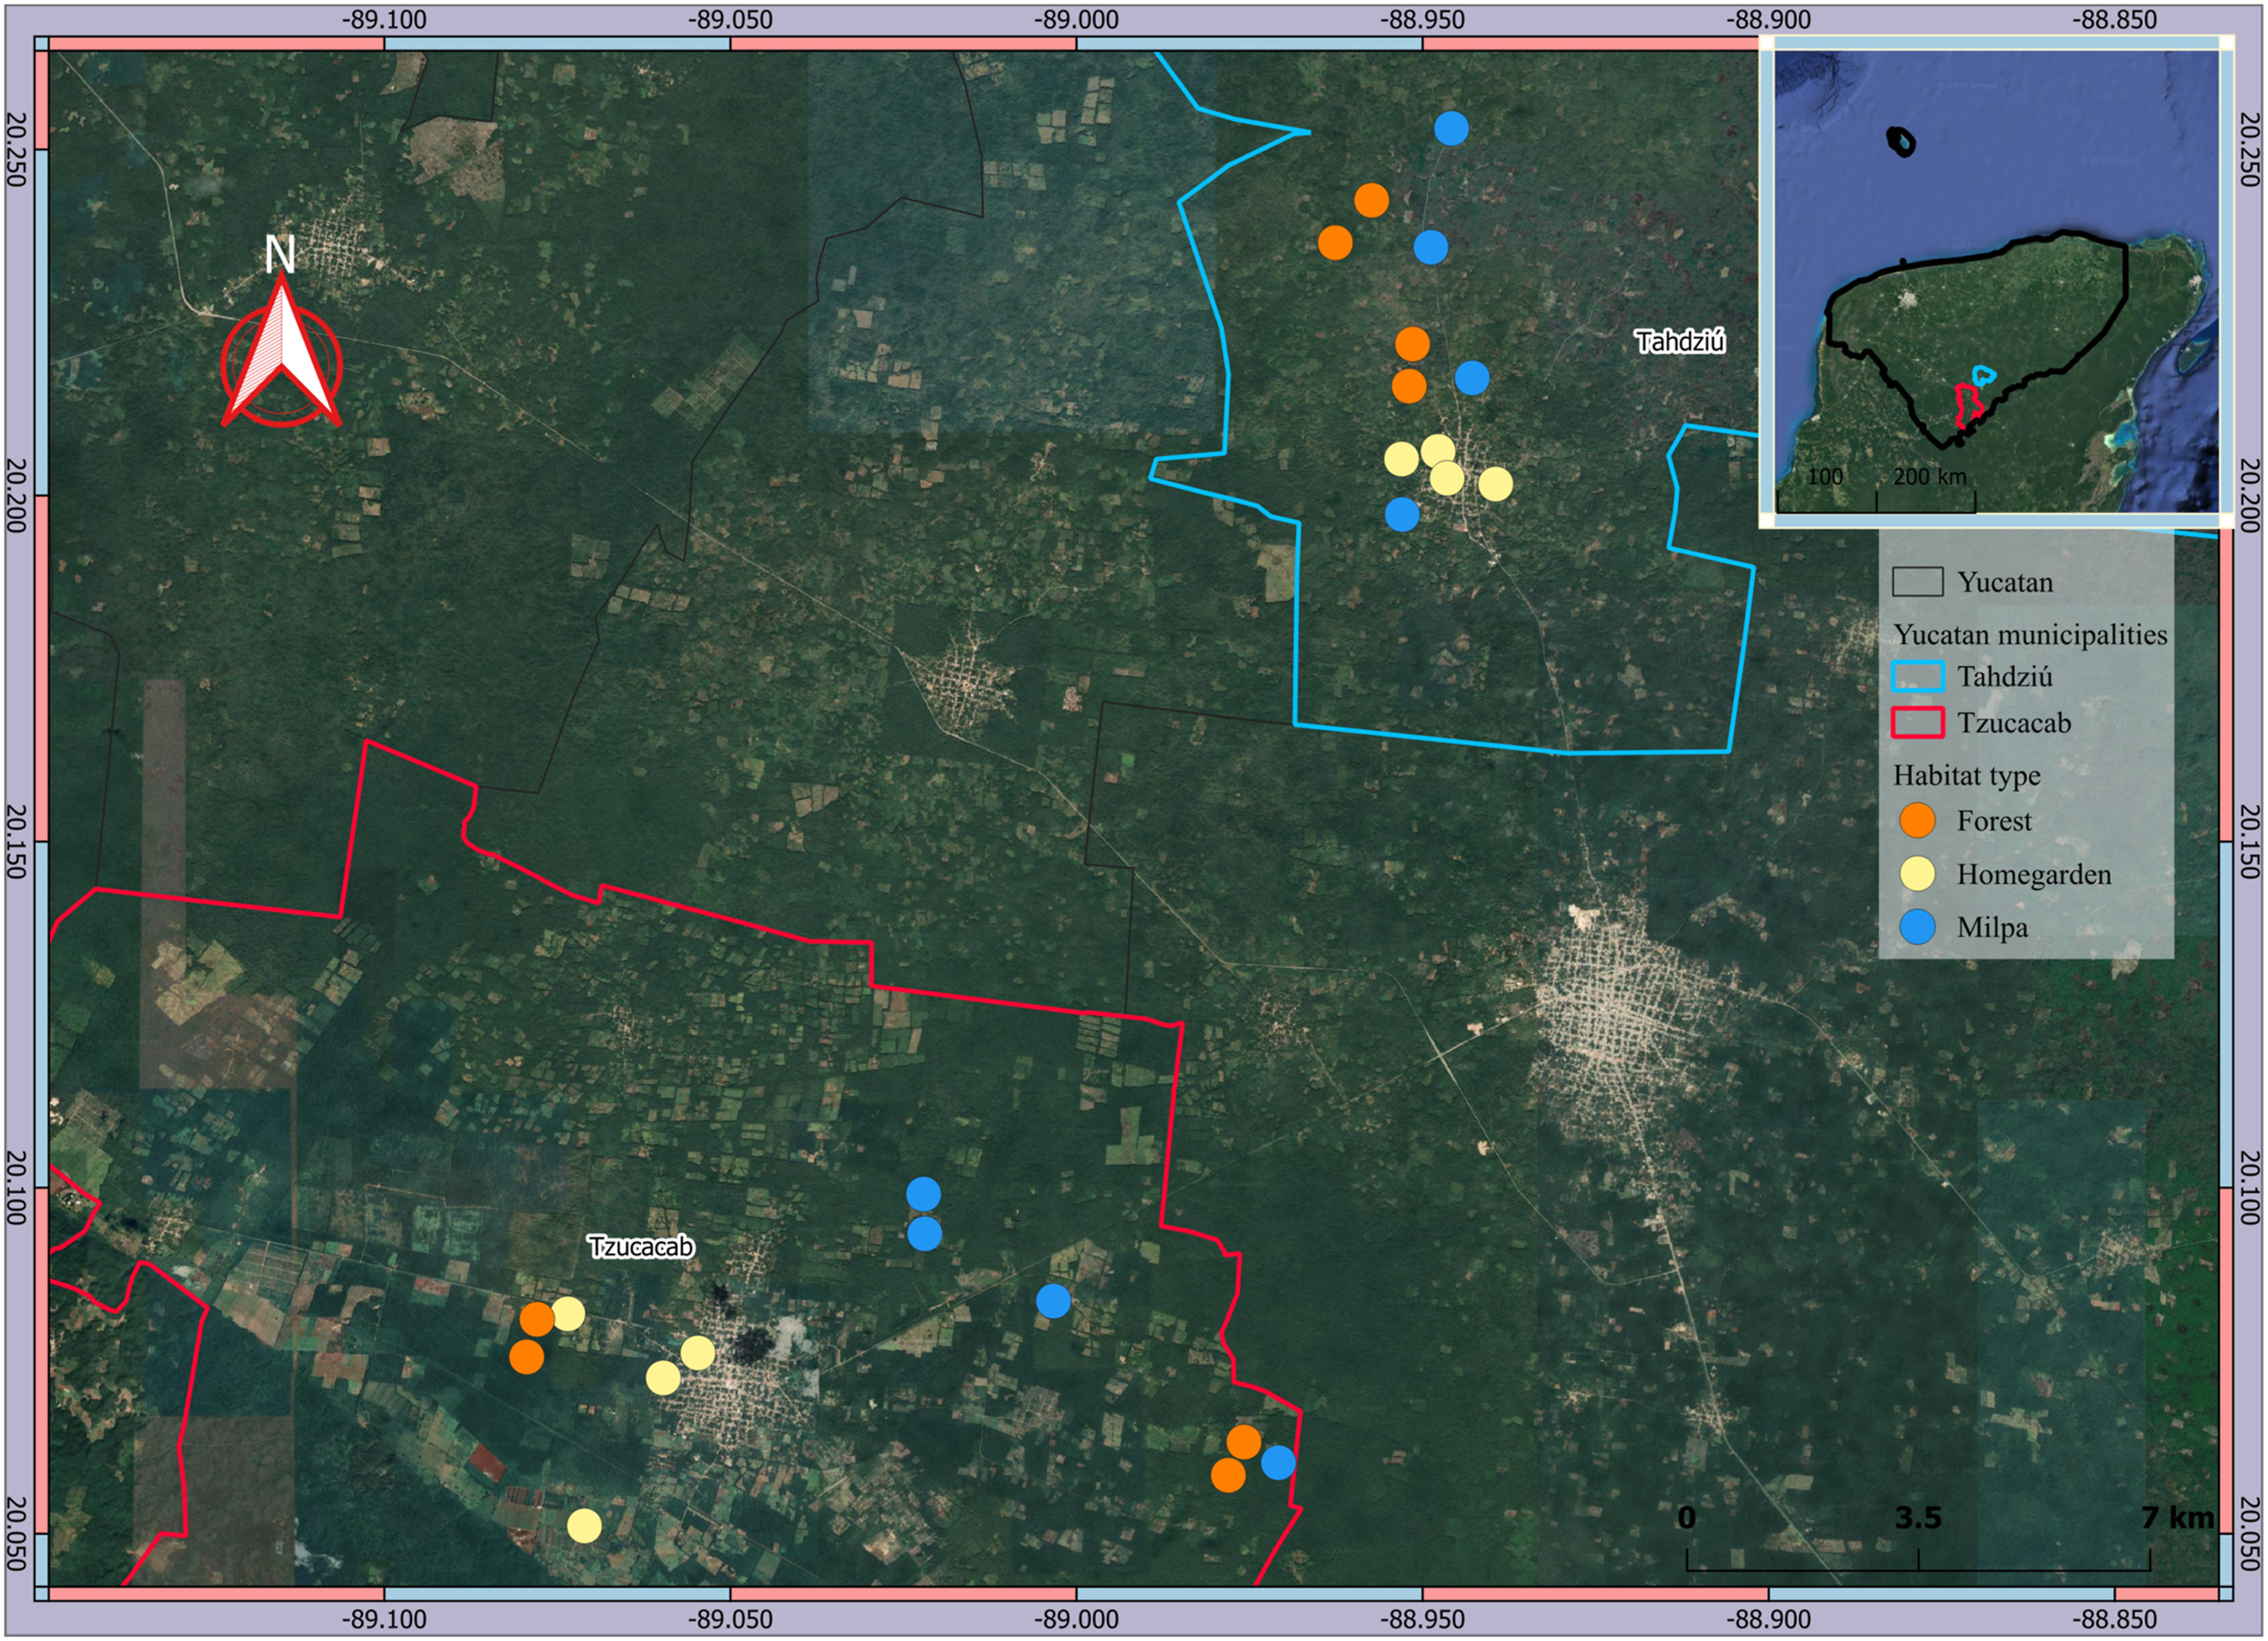
In contrast to traditional itinerant milpa, the current milpa in the study area is sedentary (cultivated in the same place every year), rainfed, and has an average area of 1.57 ± 0.28 ha (n= 8; hereafter: mean ± 1 SE), a plant species richness of 35 ± 4.2 species, and a Shannon-Wiener diversity (H´) of 2.9. The dominant species in the milpa are Zea mays, Phaseolus vulgaris, and various species of Cucurbita. On the other hand, the homegardens in the area present a richness of 71 ± 1.4 plant species and H´= 3.8. The average area of the sampled homegardens was 0.8 ± 0.22 ha (n= 8). The dominant species in this agroecosystem were Citrus aurantium, C. sinensis, Capsicum chinense, and Cnidoscolus aconitifolius (Serralta-Batun et al., 2024).
The traditional agroecosystems (homegarden and milpa) in the region typically do not have irrigation systems. Irrigation of the homegardens is manual, selective (for some species only), and conducted during the dry season. In the case of the milpa, it is a rain-fed system, which means that it is dependent on the occurrence and quantity of rainfall. There are initiatives to maintain the use of agroecological practices in the region, such as the application of organic fertilizers and pest management with bioinsecticides (Serralta-Batun et al., 2024). Forty percent of the study milpas did not use any herbicides and the remaining 60% had only used herbicides on one occasion over the last three years.
The milpa and the homegardens are both surrounded by a secondary tropical sub-deciduous forest at different stages of succession. In the region, a woody plant richness of between 42 and 65 species has been reported (Rico-Gray & García-Franco, 1992), with an H´ index of 3.55-.82, and a dominance of the species Bursera simaruba, Croton reflexifolius, Diospyros cuneata, Gymnanthes lucida, and Lysiloma latisiliquum (Zamora-Crescencio et al., 2008). Some extractive activity is maintained in the forest patches to obtain firewood or construction materials (Serralta-Batun et al., 2024). Some wild plant species and wild relatives of cultivated plants are shared between the homegardens and forest remnants (e.g. L. latisiliquum; Cordia dodecandra; wild Carica papaya and wild Cnidoscolus aconitifolius), while only a few species are shared between forest and milpa (wild Capsicum annum; wild Cnidoscolus aconitifolius) since most plants cultivated in the latter are fully domesticated and thus rely on human assistance for their reproduction.
Sampling
The study was conducted during the time that the milpa is cultivated (May 2021 and January 2022, a period of nine months), which is when the three habitat types considered in this research are found simultaneously, and coincided with the rainy season in the study area. The main factor of interest was habitat type, with three levels: forest patches, homegardens, and milpas. Eight sites per habitat type were selected, for a total number of 24 sites. This sample size is similar to those in previous studies on the topic (e.g. Rader et al., 2014; Forrest et al., 2015; Vides-Borrell et al., 2019). In the case of the secondary forest, site selection was random. The selected patches had between 8 and 15 years of regeneration, a successional stage locally known as Ka'anal hubché (“tangle of tall trees” in Maya; González-Cruz et al., 2015). In the case of the agroecosystems, selection depended on authorization from the landowner. Therefore, in the case of no authorization, the closest alternative site with authorization was selected. The average distance between the 24 selected sites was 5.96 ± 1.70 km (range 4.63-9.33 km), which exceeds the average distance (2.7 km) that some bees can fly in a single day (Greenleaf et al., 2007).
Native bees were sampled in the 24 sites (eight per habitat type) with three-bowl pan traps: one blue bowl, one white bowl, and one yellow bowl, colors that mimicked those of the flowers of the dominant species in the three habitat types (Parys et al., 2020). Nine such traps were established in each of the 24 sites (8 sites x 3 habitats x 9 traps= 216 traps in total), at a height of 50 cm above ground level and 5 m apart. Each bowl was filled with 150 mL of water and 2 mL of liquid detergent as a surfactant, and each trap was left for 7 h (08:00-15:00 h). This procedure was repeated approximately bimonthly (every 8-9 weeks) for each habitat during the nine months in which the study was conducted (four sampling periods during the study). Thus, the pan traps were left in each site for 28 h in total (7 h x 4 periods). The time elapsed to complete the sampling of the 24 sites was 10-14 days within each sampling period. Although the total area sampled (400 m2) was kept constant in all habitat types, the distance between traps and their spatial arrangement varied slightly due to differences in vegetation distribution and plant density among the habitats. In the milpa and homegardens, the traps were distributed in a 20 x 20 m (400 m2) quadrat with a distance of 3-4 m between traps, while in the forest, two 20 x 1 m strip transects (2 transects x 20 m2 = 400 m2 sampled) were established at a distance of 20 m apart.
In addition to the sampling technique with pan traps, complementary sampling was conducted with a sweep net for two hours at a distance of at least 30 m from the traps to avoid interference. Both sampling techniques are suitable for forest and agroecosystems (Prado et al., 2017). As with the pan traps, sweep netting was conducted at a frequency of once every ca. two months per site for the total duration of the study (2 h x 24 sites x 4 times = 192 h of sampling in total). To reduce the border effect, the traps were set and netting was conducted in the central area of the quadrants/transects. The bee specimens collected (using both sampling techniques) were preserved in 70% alcohol and subsequently identified to the lowest taxonomic level possible. When this manuscript was submitted, the collected and identified specimens were in quarantine, pending admission to the Regional Entomological Collection of the Autonomous University of Yucatan (CER-UADY, by its Spanish acronym). The collection sites were not located within a protected natural area, nor were they found within the distribution range of any species on the IUCN red list; consequently, a collection permit was not required.
Data Analyses
Once the collected bee specimens were identified to the finest level possible, the Hill numbers, or effective number of species of order 0 (D0), order one (D1), and order two (D2), were calculated (Jost, 2006). We chose these metrics because they have intuitive mathematical properties, are easily interpreted, and are highly comparable since they feature commonly in the literature. D0 corresponds to species richness, while D1 weights species by their frequency, without favoring rare or common species, and its relationship to other common diversity indices is known (D1= exp H'), and D2 is influenced by abundant and common species and is also the inverse of Simpson's diversity index (Jost, 2006). The expected richness was calculated with the Chao1 estimator. All these metrics were calculated with the iNEXT package version 3.0 (Hsieh et al., 2016) and were compared among habitats with a Chi-squared test of homogeneity, which tested the alternative hypothesis that the observed values of the metrics will differ from that expected by chance. Since our study was focused on native bees, Apis mellifera was excluded from this and all data analyses.
Functional traits and trait categories (trait state) of the bees used in this study. Each category is described in the last column.

Once the bees were characterized within different trait states, frequency distributions were compared among habitat types for each trait with a Chi-square test of homogeneity, in which the null hypothesis was that the frequency distribution per functional trait category will be equal across the three habitat types.
Since all bee functional traits considered in this study were categorical, a first approach to functional diversity was made using an analysis based on functional entities (FE), which are categories defined from the unique combinations of all of the traits (Mouillot et al., 2014). From the frequency distribution analysis of these FE, relevant aspects of the community can be inferred, including its level of redundancy vs. functional vulnerability (Mouillot et al., 2014). The metrics calculated from the FE were (i) functional redundancy (FRed), defined as the average number of species per FE, (ii) functional over-redundancy (FOR), defined as the percentage of FE with more species than the average of all FE, and (iii) functional vulnerability (FVuln), which is the percentage of FE with a single species (Mouillot et al., 2014). These metrics were calculated with the mFD package of R, 4.0.3 (Magneville et al., 2022), and compared among habitats with a non-parametric Kruskal-Wallis test using the same package and version.
As a complement to the FE-based analysis, a series of functional metrics were calculated that collectively describe the species distribution in the multivariate functional space using the convex hull approach generated from a Gower distance matrix based on the characters described above (Villéger et al., 2008). The multivariate functional metrics calculated were (i) functional richness (FRic), which represents the functional space occupied by the species (Mason et al., 2005), (ii) functional evenness (FEve), which indicates the regularity with which species are distributed in this space, (iii) functional divergence (FDiv), which is a measure of functional similarity among the dominant species in a community, where high values are associated with a high degree of niche differentiation between dominant species, which could act to reduce competition and increase the magnitude of ecosystem processes as a result of more efficient resource use (Mason et al., 2005; Mouchet et al., 2010), and finally (iv) functional dispersion (FDis), which defines how far the most abundant species move away from the center of the functional space (Banaszak-Cibicka & Dylewski, 2021). The formulae for calculating these metrics were those outlined by Mason et al. (2005), Villéger et al. (2008), and Laliberté & Legendre (2010), which are presented in the online Appendix S1. These metrics were calculated for each site and compared among habitats (fixed effect) using a linear mixed- effects model with the municipality as a random effect. The multivariate functional diversity metrics and linear mixed-effect model were calculated with the FD package and lme4 packages, for R, version 4.0.3, respectively. The raw data from this study are available as supplementary material in Appendix S3.
Results
Taxonomic Diversity
A total number of 451 individual bees were recorded, belonging to 50 species across the entire landscape. The family Apidae was the best represented in terms of species richness (48.2% of the species recorded), followed by the family Halictidae (46.3%) and, in third place with much lower richness, the family Megachilidae (1.7%). The Apidae species with the highest relative abundance were: Nannotrigona perilampoides (7.7%), Trigona fulviventris (7.3%), and Peponapis limitaris (6.4%). While in the family Halictidae these were: Lasioglossum sp2 (7.7%), Lasioglossum sp1 (7%), and Augochloropsis metallica (6.8%).
Observed (D0) and expected species richness of bees, true diversity of order 1 (D1) and of order 2 (D2; Inverse of Simpson’s diversity index) in tropical forest patches (Forest) and two traditional agroecosystems: Homegarden and Milpa on the Yucatan Peninsula, Mexico. The results of the statistics are shown in the last column. Different superscript letters indicate statistically significant differences between habitat pairs.
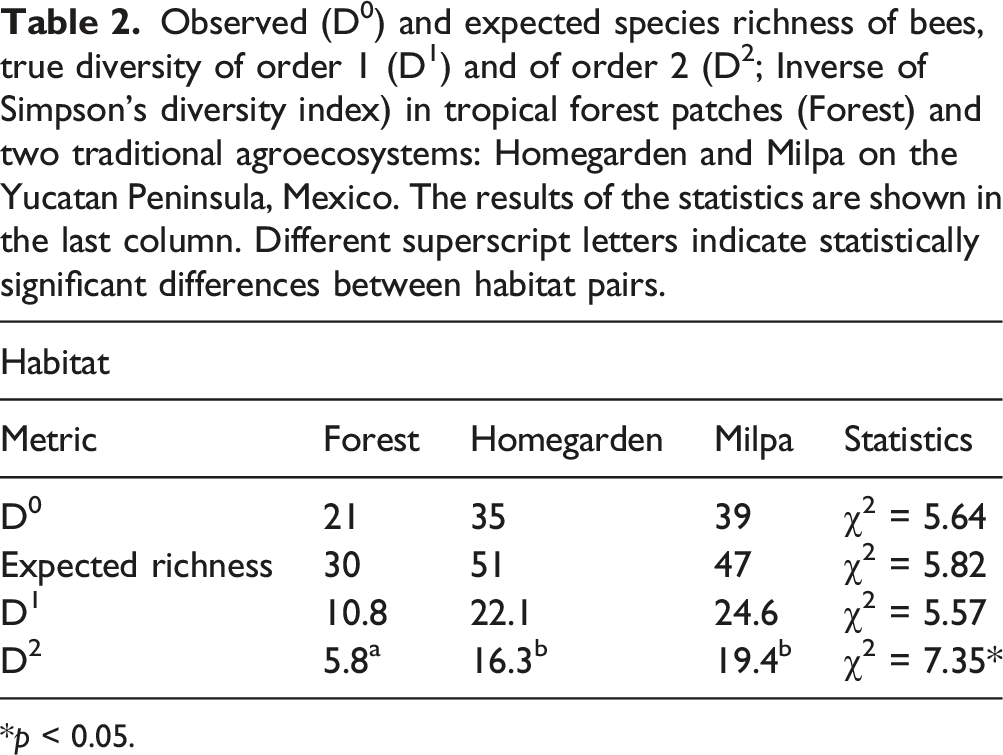
*p < 0.05.
Exclusive bee species and their relative abundance (values in brackets) found in forest patches (Forest), homegardens, and milpas in an agricultural landscape of the Yucatan Peninsula, Mexico. Different morphospecies within the same genus are identified with consecutive numbers (e.g. sp1, sp2…sp n).

The NMDS demonstrated a considerable overlap among the three habitats in terms of species composition (Figure 2). This result agreed with that of the PERMANOVA, where no significant differences were found among habitat types (F2, 16 = 0.36, P = 0.13; Figure 2) or between municipalities (F1,16 = 0.57, P = 0.11). Ordination plot of bee species composition in forest patches, home gardens and milpas (ellipses) in an agricultural landscape of Yucatan, Mexico. The dimensions of the axes were obtained from non-metric multidimensional scaling based on the Bray-Curtis dissimilarity index. Ancsp1 = Ancyloscelis sp1; Antmacu = Anthidium macusolum; Augauri = Augochlora aurífera; Augnyg = Augochlora nygrocyanea; Augsma = Augochlora smaradigma; Augsp = Augochlora sp; Augsp1 = Augochlora sp1; Augsp2 = Augochlora sp2; Augsp3 = Augochlora sp3; Augsp4 = Augochlora sp4; Augneg = Augochlorella neglectula; Augmet = Augochloropsis metallica; Centrig = Centris trigonoides; Cerexi = Ceratina eximia; Cernau = Ceratina nautlana; Cersp2 = Ceratina sp2; Cersp3 = Ceratina sp3; Cersp5 = Ceratina sp5; Cersp6 = Ceratina sp6; Coesp1 = Coelioxys sp1; Eugvir = Euglossa viridissima; Eulpol = Eulaema polychroma; Exomel = Exomalopsis mellipes; Exosp1 = Exomalopsis sp1; Frinig = Frieseomelitta nigra; Gaesp1 = Gaesischia sp1; Hylsp1 = Hylaeus sp1; Lasisp = Lasioglossum sp; Lassp1 = Lasioglossum sp1; Lassp2 = Lasioglossum sp2; Lassp3 = Lasioglossum sp3; Lassp4 = Lasioglossum sp4; Megalb = Megachile albitarsis; Megha = Megachile habilis; Megsp1 = Megachile sp1; Megsp2 = Megachile sp2; Megsp3 = Megachile sp3; Nanper = Nannotrigona perilampoides; Parmoe = Paratetrapedia moesta; Parbil = Partamona bilineata; Pepli = Peponapis limitaris; Pepsmi = Peponapis smithi; Pepsp1 = Peponapis sp1; Peput = Peponapis utahensis; Plefro = Plebeia frontalis; Scapec = Scaptotrigona pectoralis; Triful = Trigona fulviventris; Xylmus = Xylocopa muscaria; Xylona = Xylocopa nautlana.
Functional Diversity
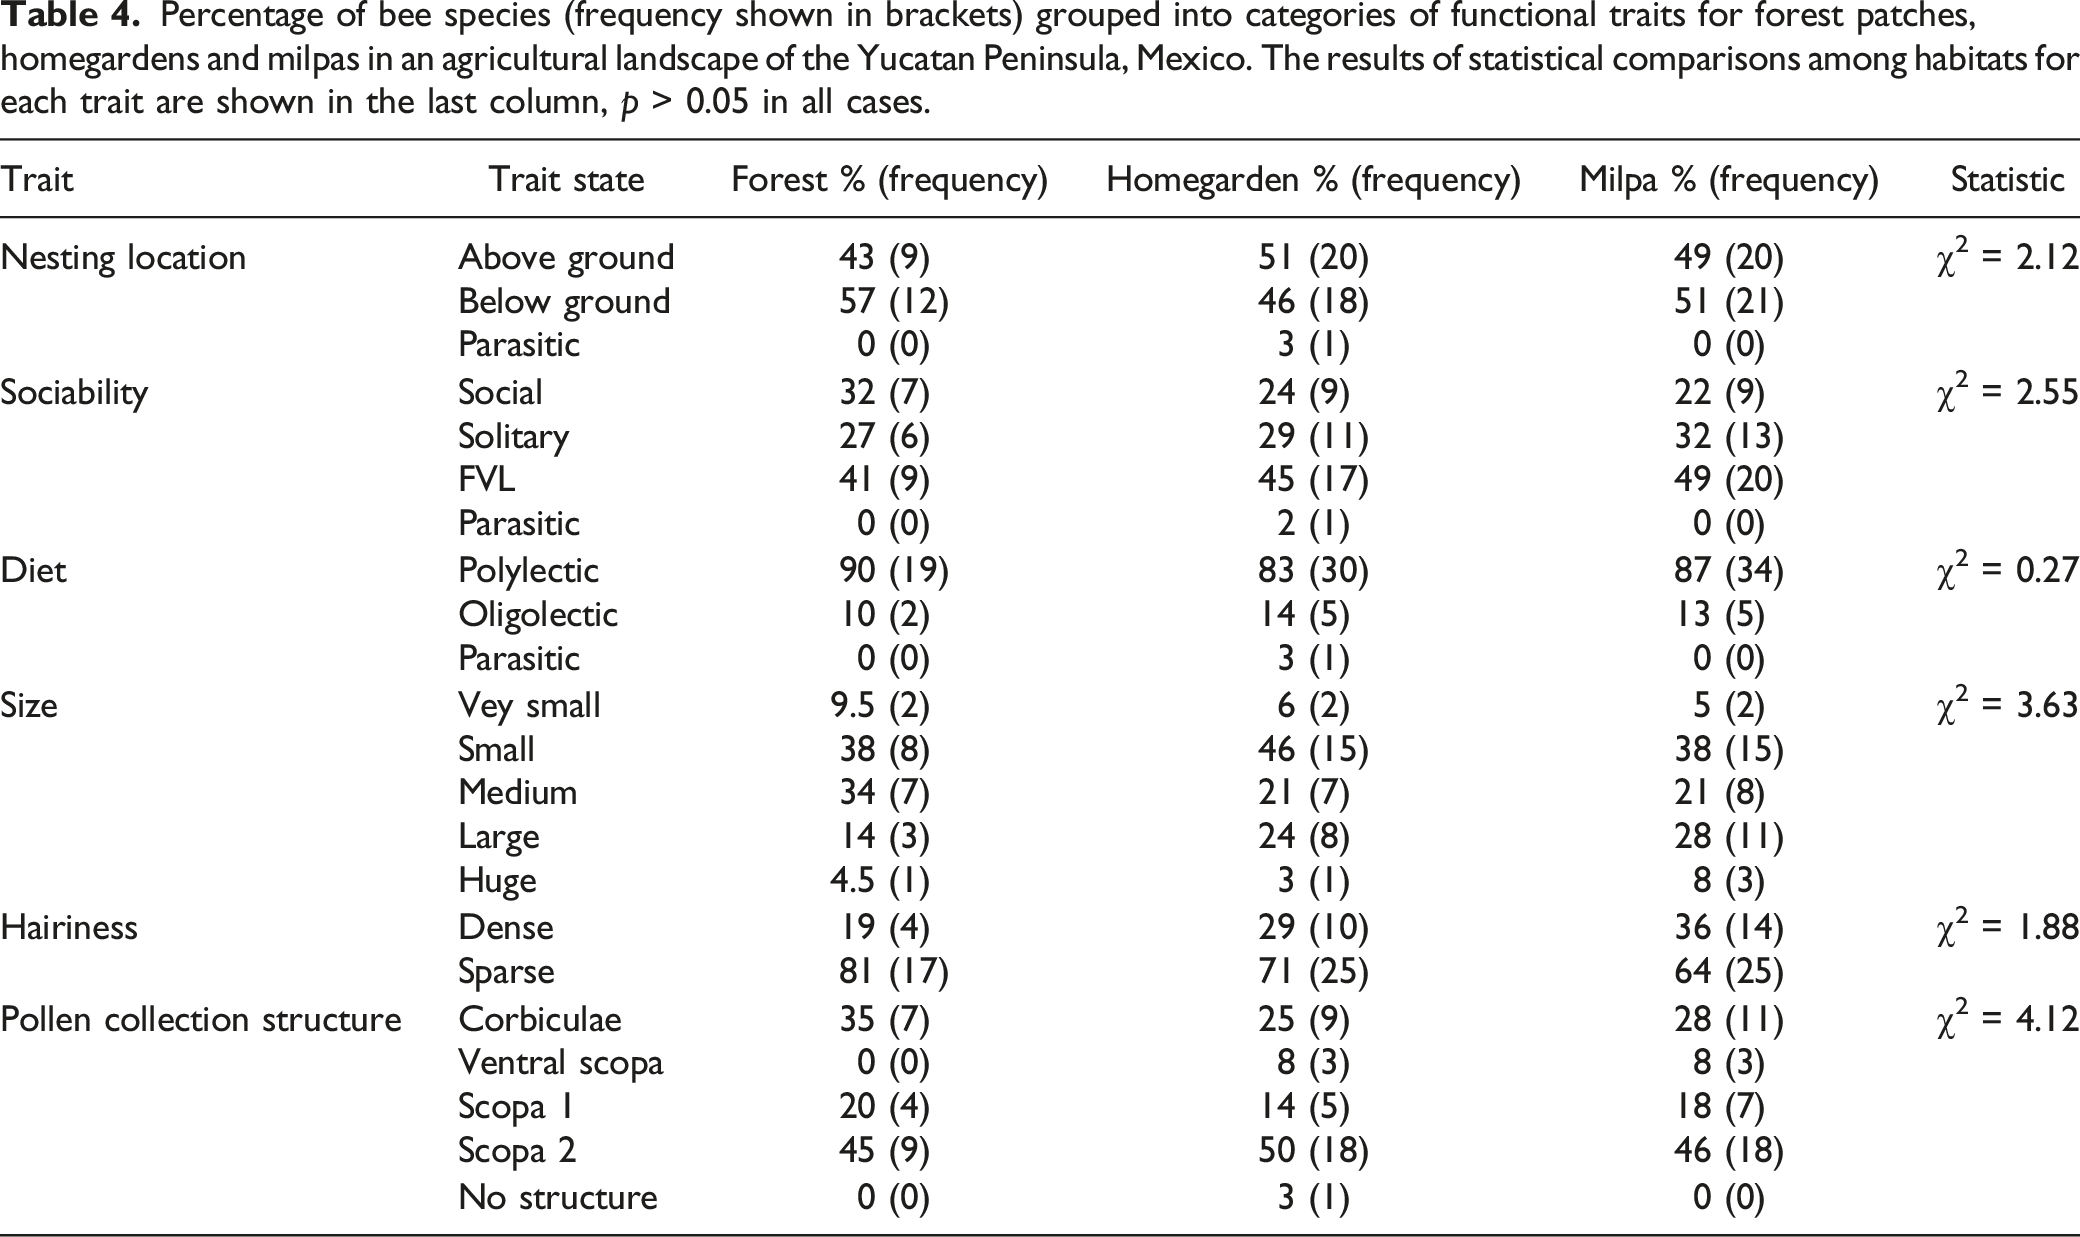
Percentage of bee species (frequency shown in brackets) grouped into categories of functional traits for forest patches, homegardens and milpas in an agricultural landscape of the Yucatan Peninsula, Mexico. The results of statistical comparisons among habitats for each trait are shown in the last column, p > 0.05 in all cases.
Results of functional analyses based on the functional entities of bees in three habitat types: forest patches (Forest), homegardens and milpas in an agricultural landscape on the Yucatan Peninsula, Mexico. The number of functional entities (FE), functional redundancy (FRed), over-functional redundancy (FOR) and functional vulnerability (FVuln) are shown. Data are mean values ± 1 SE. The results of statistical comparisons between habitats are shown in the last column.

*p < 0.05.
Metrics of functional diversity (functional richness [FRic], functional evenness [FEve], functional divergence [FDiv] and functional dispersion [FDis] of bees in tropical forest patches (Forest) and two traditional agroecosystems (Homegardens and Milpas) in an agricultural landscape of the Yucatan Peninsula, Mexico. Data are mean values ± 1SE. The results of the statistical analyses are shown in the last column, p > 0.05 in all cases.

Discussion
Contrary to our expectations, we found that traditional agroecosystems were similar to forest remnants in terms of the taxonomic and functional diversity of native bees in an agricultural landscape of the Yucatan Peninsula. The similarity among these landscape units suggests that bees can move across these, use them as habitats, and/or exploit the resources they offer. Moreover, the fact that a proportion of contrasting bee functional groups were found in the main habitats found in the study area (forest, homegarden, and milpa) suggests that management practiced in traditional agroecosystems does not represent an important environmental filter for any bee functional group, even for those bee species that are highly sensitive to anthropogenic disturbance, such as specialists and solitary bees. Given the suitability of traditional agroecosystems as bee habitats and the fact that they represent a dominant cover type in the rural landscape of the Yucatan Peninsula and other regions of the tropics (Altieri & Nicholls, 2017; Villicaña-Hernández et al., 2020; Méndez et al., 2022), we consider that these areas may offer an option of biodiversity-friendly agriculture that could be incorporated into an integrated strategy of landscape management. The maintenance of low-intensive agriculture, along with the conservation of forest remnants, may represent a suitable strategy for the conservation not only of bees but also other components of biodiversity (i.e. birds, mammals) that provide valuable environmental services (Schroth et al., 2004; Gehring et al., 2005).
Taxonomic Diversity
According to the NMDS and PERMANOVA analyses, species composition was similar between the forest patches and the two traditional agroecosystems studied. This is a surprising result because higher diversity was expected in the forest since it represents the original cover of this landscape, harbors higher plant diversity, and is subjected to management of the lowest relative intensity. This finding may be because the management practices used in the agroecosystems did not negatively affect the native bee species and/or the resources they use. For example, herbicides and other agrochemicals were not used in homegardens and manual weeding was the most common practice undertaken to control weeds in the milpas (pers. obs.). On the other hand, although relatively less diverse, the milpa is a polyculture of plants with a very attractive floral display for the bees that occurs synchronously over a small window of time (3 to 4 months). This could generate a magnet effect and attract bees that are not residents of the milpa, but inhabit nearby sites (Holzschuh et al., 2013; Gilpin et al., 2019). For example, Meléndez-Ramírez et al. (2002) reported a richness of 58 bee species associated with some Yucatan cucurbit crops, which are common species in the milpa, while Vides-Borrell et al., (2019) report a richness of 101 bee species in milpa areas of another site on the Yucatan Peninsula (Campeche). Landaverde et al. (2017) suggest that the moderate disturbance that typically exists in and around the Yucatan milpa could also be an element that favors high bee diversity in this agroecosystem due to the presence of a mix of ruderal wild and cultivated species that are attractive to the bees that tend to occur in areas with intermediate disturbance.
The similarity in the taxonomic composition of the bee community between the forest and homegardens is not surprising, as these agroecosystems are similar in terms of plant community structure and diversity (Poot-Pool et al., 2012). It has even been reported that the mixture of native and exotic species in the homegarden, as well as their low-intensity management, may act to favor native fauna, including the bees, as a result of the high availability of floral resources and nesting sites in these agroecosystems (Hass et al., 2018; Schrader et al., 2018; Escobedo-Kenefic et al., 2020; 2022). On the Yucatan Peninsula in particular, homegardens are often located close to patches of forest or regenerating vegetation (Villicaña-Hernández et al., 2020), and such proximity is often positively associated with bee species richness and abundance (Motzke et al., 2016). Sixteen bee species were shared among the three habitat types, suggesting that movement of these species occurs among the habitats. Previous studies have already shown that biodiverse matrices with arboreal elements, such as homegardens, facilitate the movement of vagile organisms, such as bees, between different habitats in heterogeneous landscapes (Kremen & Merenleder, 2018; Von Thaden et al., 2022). For example, Escobedo-Kenefic and colleagues (2022) found no effect of land use unit (forest, semi-natural vegetation, and cropland) on the abundance and species richness of bee flower visitors in a landscape mosaic of Mesoamerica. Thus, agroecosystem and forest patches may function as complementary habitats (Armas-Quiñonez et al., 2020), or as stepping stones, facilitating the movement of bees over open areas (Cadavid-Florez et al., 2020). Although the milpa has no arboreal elements in its interior, some milpas in the study area conserve belts or barriers of trees that extend 5 to 20 m in length around them (known in Mayan as tolché). Added to the large amount of floral resources available, these tree belts could explain the suitability of the milpa as a habitat or foraging site for bees (Briggs et al., 2013; Levy-Tacher et al., 2019; Fonteyne et al., 2023).
Although the general trend shows no differences in bee species composition among habitat types, we found differences in the inverse of Simpson’s diversity index, which is related to a turnover in species dominance. The forest patches were dominated by eusocial bees such as N. perilampoides, which nests in tree trunks (Cab-Baqueiro et al., 2022), and T. fulviventris, which usually nests in rock holes, soil banks, or dead branches (Michener, 2007). The homegardens were dominated by A. metallica, a species that also nests in the ground (Portman et al., 2022), and P. bilineata, which can nest in cultivated tree species such as the Chrysophyllum cainito present in this agroecosystem (Cab-Baqueiro et al., 2022). The milpa was dominated by P. limitaris, an oligolectic species that has been found nesting in soils in the vicinity of crops and is an active visitor of flowers of milpa crops such as species of Cucurbita (Meléndez-Ramírez et al., 2002; Cordeiro et al., 2021).
The number of exclusive species was relatively low in the three habitats under study. The forest harbored some solitary species, such as A. macusolum, which usually nests in trunks and uses plant trichomes to build its nest, and Hylaeus sp., a species reported as rare given its low abundance, which nests in dead stems (Michener, 2007; Gonzalez & Griswold, 2013). Species of Ceratina were found in both the forest and homegardens. These species often nest on dead stems but can also nest in human-made areas (Mikát et al., 2022). In addition, Gaesischia sp., a specialist bee of the Ipomea species that commonly inhabits anthropogenic areas, was found in the homegardens (Araujo et al., 2018). In both the homegardens and milpa, species of the genus Augochlora were recorded. These bees build nests in cavities in soft or rotten wood (Michener, 2007; Dalmazzo & Roig-Alsina, 2012) and their presence in the milpa could therefore only be for foraging and not for nesting. Lasioglossum species were also found in these agroecosystems. These nest in the ground and are favored by open areas (Brown et al., 2020) as well as being important for the pollination of the C. chinense and B. orellana, plants present in these agroecosystems (Landaverde et al., 2017; Rocha et al., 2023). The species exclusive to the milpa were Paratetrapedia sp., a specialist bee that collects floral oils from Malpighiaceae species (Aguiar & Melo, 2011), and leafcutting bees (Megachile sp.), which are often associated with the distribution of Asteraceae and Fabaceae species since they use the leaves for nest construction (Kambli et al., 2017). Both species probably make use of the wild herbaceous resources or wild woody species found in the surroundings of the milpa.
Functional diversity
Functional diversity was similar in the agroecosystems and forest patches. Again, this could be due to the suitability of traditional agroecosystems as a habitat for a functionally diverse community of native bees. In the agricultural landscape of the Yucatan Peninsula, the traditional practices that the Maya have historically carried out have generated a matrix of diverse native crops, surrounded by fragments of highly biodiverse native vegetation (Ford & Topsey, 2019). This produces a mosaic of habitats with agroecosystems that share species (local and cultivated varieties that coexist with their wild relatives) and surrounding vegetation that together provide complementary food resources (Lichtenberg et al., 2017). This allows a diverse set of floral traits that, in turn, attracts a diverse assemblage of bee species, thus favoring the complementarity of plant-pollinator interactions and enhancing crop reproductive success (Badillo-Montaño et al., 2019; Laha et al., 2020; Escobedo-Kenefic et al., 2022; Peralta et al., 2023). In addition to functional similarity, the availability of nesting sites (e.g. trunks, dead stems, herbaceous crops, areas without shade or forest at different successional stages), the null or low use of agrochemicals in these agroecosystems could foster the presence of bee species with the ability to move, but a sensitivity to these substances (Vides-Borrell et al., 2019; Brown et al., 2020; Marcacci et al., 2022).
In contrast to the relative homogeneity across habitats found in the multivariate metrics of functional diversity, we found that the number of functional entities differed among habitats. Again, in contrast to our prediction, we found a greater number of functional entities in the traditional agroecosystems. This is consistent with the evidence that bees are frequently found in areas of abundant floral resources, such as nectar- or pollen-rich crops (Hall et al., 2019) since these habitats offer a wider spectrum of temporarily available resources due to human intervention (Banasza-Cibika & Dylewski, 2021). The bee species found in these habitats share generalist traits, nest in the ground, and are noted for their ability to exploit crop and herbaceous resources; however, there are also species with specialized habits such as squash bees (Peponapis sp.) and some meliponini species that nest in arboreal substrates. These species can thus find resources (mainly food) of importance to their permanence in these traditional agroecosystems.
Limitations and Future Direction
It should be noted that this study was conducted for only part of the year, so it is impossible to guarantee that the pattern described in this study will be maintained during the part of the year not covered by the study. For instance, over an entire year, Meléndez-Ramírez et al. (2016) found two times more bee species than we found in a conserved forest, at a different locality in Yucatan Peninsula. However, although our results may only apply to one particular part of the year, they do show that, when all three habitats are available simultaneously, these offer habitat, food and nesting resources to bees with different mobility and dietary requirements. It is true that milpa is not present throughout the year, however, it has been planted in the study area for centuries and has thus become a seasonal but predictable resource (Ford & Topsey, 2019). Future research exploring seasonal patterns in bee distribution over an entire year may also provide valuable information regarding the seasonal use of habitat by different functional groups of bees.
Although our sampling effort allows a valid comparison among habitats since it was the same in all three habitat types, we may have failed to detect some rare species or those that are perhaps more abundant during the non-sampling period. A longer-term study involving more intensive sampling of study sites (i.e. every month for more than one year) may be required to detect rare species. Our study focused mainly on alpha diversity and future research with an adequate in-depth approach to beta diversity, both taxonomic and functional, could therefore elucidate the complementarity and turnover in the bee community within and among the three main habitats of the studied landscape and other habitats.
Conclusion
In conclusion, taxonomic and functional diversity was similar in the traditional agroecosystems and remnant forest patches, suggesting that, in addition to the forest, traditional agroecosystems can offer important resources to the native bee community and are suitable for contrasting functional groups of native bees.
Implications for Conservation
As demonstrated in this study, homegardens, milpa, and forest all provide food and habitat resources for various functional groups of bees. In addition to their importance in conserving this important group of organisms, traditional agroecosystems contribute to food production and thus ensure food security for the local communities. It is therefore necessary to incorporate the region's traditional agroecosystems into a comprehensive landscape management program. Currently, these agroecosystems face important challenges for their conservation, such as abandonment and the devaluation of agricultural labor, aspects that threaten their existence and the agrobiodiversity they protect. The consideration of agroecosystems as elements that conserve and connect biodiversity and agricultural landscapes is a priority. One way to promote the conservation of this and other biodiversity-rich agroecosystems is to disseminate traditional knowledge and traditional agricultural practices as well as to create local markets for the sale of the products of local agroecosystems (Nimmo et al., 2023). Inclusion of the forest remnants located in the private/communal (i.e. ejido) lands in a scheme of payment for environmental services has also been shown to reduce forest fragmentation in Mexico (Ramírez-Reyes et al., 2018). Agroforestry systems such as home gardens could also be included in a similar scheme of payment already implemented in Mexico as the Sembrando vida program (Gómez-Rodríguez et al., 2023). Preventing the transformation of traditional agroecosystems into more intensive systems, as well as the maintenance of forested areas in the region, should also be a priority.
Supplemental Material
Supplemental Material - Taxonomic and Functional Diversity of Bees in Traditional Agroecosystems and Tropical Forest Patches on the Yucatan Peninsula
Supplemental Material for Taxonomic and Functional Diversity of Bees in Traditional Agroecosystems and Tropical Forest Patches on the Yucatan Peninsula by Laura P. Serralta-Batun, Juan J. Jiménez-Osornio, Virginia Meléndez-Ramírez and Miguel A. Munguía-Rosas in Tropical Conservation Science
Footnotes
Acknowledgments
E Moo, E Rivero, D Ruiz, A Marote, and G Jiménez helped with the fieldwork. E González-Iturbe produced the map. We thank S Villeger for his advice with the package mFD. We thank the families of Tahdziú and Tzucacab for giving us the access and trust necessary to work in their agroecosystems. K MacMillan translated this manuscript from Spanish to English.
Declaration of Conflicting Interests
The authors declare no potential conflicts of interest concerning the research, authorship, and/or publication of this article.
Funding
The author(s) disclosed receipt of the following financial support for the research, authorship, and/or publication of this article: This study was supported by CONAHCYT (Project: M0037-2019-05-305870), SISTPROY CIRB-FMVZ (2020-0015), and the W.K. Kellogg Foundation (Project: Agencias de desarrollo humano local (ADHL-Alianzas).
Supplemental Material
Supplemental material for this article is available online.
References
Supplementary Material
Please find the following supplemental material available below.
For Open Access articles published under a Creative Commons License, all supplemental material carries the same license as the article it is associated with.
For non-Open Access articles published, all supplemental material carries a non-exclusive license, and permission requests for re-use of supplemental material or any part of supplemental material shall be sent directly to the copyright owner as specified in the copyright notice associated with the article.