
Abstract
Raptor birds have widespread distributions in different environments throughout the planet. Yet, they are highly sensitive to landscape disturbances. We studied raptors in northern-central Mexico at the Highland plateau of San Luis Potosí and Zacatecas, in three landscape types that differed in proportion of agriculture. Our main goal was to determine whether small proportion of agriculture at the landscape level influences species richness, ecological diversity, and functional diversity. We conducted raptor road surveys during 1 year, from April 2015 to February 2016. We registered a total of 332 birds belonging to 14 diurnal raptor species. The most abundant species were Cathartes aura (turkey vulture), Falco sparverius (American kestrel), Caracara cheriway (crested caracara), and Buteo jamaicensis (red-tailed hawk). Three species: Aquila chrysaetos (golden eagle), Pandion haliaetus (osprey), and Falco columbarius (merlin) were exclusively recorded in the less-degraded, scrubland landscapes. However, no significant differences on average diversity were found between landscape types. Contrastingly, scrubland landscapes had the highest average functional diversity, followed by mixed landscapes, and then by agricultural landscapes, with significant differences in functional diversity between scrubland and agricultural landscapes. Overall, observed species richness in the study area formed four functional groups. These groups change and loose species as proportion of agriculture in the landscape progressively increases. The results suggested that the contribution of species richness to functional diversity, both for scrubland landscapes, which have the greatest functional diversity, and agricultural landscapes, which hold the smallest functional diversity, is important because there is substantial functional redundancy among landscape types.
Introduction
Raptor birds require large territories and are highly sensitive to anthropogenic disturbances such as habitat loss and fragmentation (Tinajero, 2012). In addition, these organisms are highly dependent on complex interactions among species (Ellis & Smith, 1986; Márquez, Bechard, Gast, & Vanegas, 2005; Sergio et al., 2008). In general, this has been reported for several groups of organisms, including small avian species and food generalists which have high tolerances to habitat changes (Fahrig, 2003; Sekercioglu, 2012). Highly specialized raptors, and organisms of large body mass, on the other hand, are among the most sensitive to habitat changes. Therefore, it is often assumed that the presence of some raptors is related to the existence of high biodiversity (Iñigo, Ramos, & Gonzáles, 1989; Sergio et al., 2008; Sergio, Newton, & Marchesi, 2005). Consequently, raptors are excellent bioindicators of ecosystem health, habitat degradation, and habitat loss (Sergio et al., 2008). On the other hand, they are present in most ecosystems throughout the world, and within individual ecosystems they deliver different functions as they control populations of other species and promote ecosystem stability.
Based on the aforementioned information, we propose that raptors are good study subjects to evaluate effects of anthropogenic activities on ecosystem functioning. Evaluating functional diversity in relation to habitat loss and degradation should provide knowledge related to mechanisms through which losses or additions of species having specific functional traits influence ecosystem functioning (Kremen, 2005). A strategy to test this premise is through functional diversity analysis, which evaluates the magnitude of functional differences among species in a community. These differences may relate to a large variety of genetic, morphological, physiological, functional, and biogeographic features (Gaston, 1996; Gaston & Spicer, 2004). It is for this reason that functional diversity is defined as a component of biodiversity that describes the degree of functional differences among species (e.g., the form in which organisms use resources) and measures the distribution and range of influences that the organisms have on the ecosystem.
Therefore, functional diversity considers redundancy and complementarity among co-occurring species (Díaz & Cabido, 2001; Petchey & Gaston, 2006). In fact, it considers the presence of more than one species within each functional group (Walker, 1992). Functional redundancy takes place when different species deliver the same functional role in the ecosystem. Under this situation, it is assumed that changes in species diversity may not affect ecosystem functioning (Lawton & Brown, 1994). Small organisms and food specialists are more likely to provide functional redundancy to the ecosystem than larger and more specialized organisms, simply because species richness decreases with body size in the animal kingdom (Scheffer et al., 2015). High redundancy may provide resilience against loss of function and ecosystem services (Naeem, 1998). Greater species richness increases the probability of finding species with different attributes that are important for ecosystem functioning, it has been postulated that ecosystem functioning is provided by species richness (Díaz & Cabido, 2001). When communities contain species requiring different niches, some species may have unique functional contributions to the ecosystem. Under these circumstances, negative changes on biodiversity may translate into lineal-type changes between species richness and functional diversity. The loss of a functional type (i.e., a specific functional attribute) may indeed have greater effects on ecosystem functioning than the species loss itself (Díaz & Cabido, 2001).
Previous studies have evaluated effects of land use change on species loss, functional diversity, and on long-term environmental services (Flynn et al., 2009; Laliberté, Paquette, Legendre, & Bouchard, 2009; Mayfield, Ackerly, & Daily, 2006). On the other hand, fewer studies have examined how species redundancy in functional groups relates to land use change effects. However, species redundancy in functional groups may be used as a null hypothesis for studies focusing on consequences of loss of biodiversity on ecosystem functioning (Laliberte et al., 2010; Loreau, 2004).
Our study was conducted in an area of northern and central Mexico that is mostly dominated by dryland environments (Challenger & Soberón, 2008). In this region, a great variety of microenvironments are present due to frequent temperature changes and low precipitation. Dryland ecosystems typically have rapid and unpredictable climate fluctuations (Rzedowski & Huerta, 1978). Land use changes and anthropogenic plant cover degradation threaten these ecosystems and as a result, biogeochemical cycles are modified, and habitats are deteriorated and fragmented (Millennium Ecosystem Assessment, 2005). Consequently, the rate of negative changes on biodiversity is accelerated, and ecosystem functioning is modified. This scenario is further complicated because in these ecosystems, recovery rates are particularly slow; recovery times vary significantly as a function of impact nature and magnitude. Plant cover and biomass recovery in these environments, for instance, may range between 50 and 300 years (Lovich & Bainbridge, 1999).
In general, raptor territories are located in areas that are highly complex structurally. This is why raptors are sensitive to habitat degradation. On the other side of the coin, it has been found that certain human activities, such as agriculture, may benefit some raptor species because new niches with greater prey availability and visibility for hunting are provided. These fine-scale land use changes usually generate landscape heterogeneity (Duerr et al., 2015; Murgatroyd, Underhill, Rodrigues, & Amar, 2016; Rodríguez-Estrella, 2007; Rodríguez-Estrella, Donázar, & Hiraldo, 1998; Tella & Forero, 2000; Williams, Applegate, Lutz, & Rusch, 2000). The objective of our study was to determine if small proportions of agriculture at the landscape level associate to raptor species richness, ecological diversity, and functional diversity during two seasons of year. We also aimed at exploring which is the role of species redundancy in these changes in arid environments of northern-central Mexico. Considering that in general, agriculture has negative effects on biodiversity, affecting the prey of some, but not all raptors (Simes et al., 2015), and that some raptors are among the most sensitive organisms. Our prediction was that different raptor species would respond differently to presence of agriculture in the landscape such that large body-sized and diet specialists would be highly sensitive to the extent that even small proportions of agriculture in the landscape would associate to negative changes in their abundances.
Due to the presence of both, raptor species that require conserved landscapes and species that adapt well and even benefit from landscape degradation in our study region, we hypothesized that the responses to establishment of agriculture would be more evident in terms of functional diversity in comparison to ecological diversity. We also hypothesized that raptor responses to the presence of small amounts of agriculture in the landscape would be greater than those of seasonal variation. Finally, we predicted that in some cases, especially when functional groups include species of small body mass, there would be some redundancy of species. Therefore, a species that is lost could be substituted, and thus the function would not be altered drastically. However, in some other cases, where large raptor species are involved, species redundancy would be less likely to occur. Consequently, the function that these species provide would be lost in response to small proportions of agriculture in the landscape.
Methods
Study Area
Our study was conducted in northern-central Mexico at the Highland plateau of San Luis Potosí and Zacatecas (Figure 1). This region belongs to portions of the central Mexican plain and “Sierra Madre Oriental” and is representative of the southern portion of the Chihuahuan Desert. Sampling was conducted in portions of San Luis Potosí and Zacatecas sates. Average temperature in this region is 17℃. Annual precipitation fluctuates between 300 and 600 mm, and the prevailing climates are dry, temperate, warm, semidry temperate, and temperate subhumid with summer precipitations in some areas (INEGI, 2014).
Location of transects surveyed for raptors in the highland plateaw of San Luis Potosí and Zacatecas in central-northern Mexico. Mexico is shown at the the small upper box, the small box below Mexico shows Zacatecas and San Luis Potosí states, and the larger box shows the area surveyed. The landscape types of each transect are as follows: 1 to 3 = agricultural landscape; 4 to 5 = mixed landscape; 6 to 8 = scrubland landscape.
Natural vegetation communities in this region are grasslands, desert microphilous scrublands, crasicaulus scrublands, and rosetophilous scrublands including Yucca forests. The most dominant tree species in this region are mesquite (Prosopis laevigata), yuca (Yucca spp.), and huizache (Acacia farnesiana). The main land uses are agriculture and grazing by goats and sheep. Corn and beans are the principal crop types (INEGI, 2012; Rzedowski & Rzedowski, 1961). In Mexico, large portions of the Chihuahuan Desert have been altered by human activities and thus converted into secondary vegetation and crops. Agriculture indeed imposes the strongest pressure on native plant communities (Dinerstein et al., 2000). A large portion of the central high plateau subregion of the southern Chihuahuan Desert is altered due to intensive agriculture. For the year 2000, it was reported that approximately 55% of this subregion was covered by desert scrublands, whereas 13% corresponded to grasslands, and less than 5% to montane forests. Finally, agricultural fields covered 23% of the total regional area (Dinerstein et al., 2000).
Sampling Design
Within the study region, eight 30-km long transects were established. Three of these transects were located in highly agricultural landscapes having 84% of agriculture within 500 m of these transects, two were located in landscapes consisting of mosaics of agriculture (15% agriculture) and moderately degraded scrublands (thereafter mixed landscapes), and the three remaining transects were located in moderately degraded scrublands (thereafter scrubland landscapes), with low agricultural presence (<7% agriculture).
The purpose of having these last two types of landscapes both having small proportions of agriculture within the landscape was to evaluate if raptors would tolerate small changes in proportion of agriculture without losing their ecosystem function as a group. To guarantee independence among samples, the minimum distance among transects was 10 km. To measure percentage of agriculture within these landscapes, satellite images from 2016 available in Google earth were used to digitize agricultural areas within the Google earth environment. Then these polygons were exported to ArcView 3.2 and within this software, 500 -m buffers around the central transect line were generated, and percentages of agriculture within these buffers were quantified.
Raptors were recorded using the methods proposed by Fuller and Mosher (1987). Each transect was traversed in a vehicle at a moderate speed (<40 km/h). During the entire duration of each transect, all observed raptor individuals were recorded. To locate and identify raptors, Zeiss 10 × 50 binoculars were used. All transects were surveyed five times during the spring-summer season (April through August 2015), and five times during fall-winter season (October 2015 through February 2016). This allowed us to increase species detectability and reduce the probability of obtaining false absences. Because individuals maintain territories throughout the season, it is reasonable to assume that occurrence of the species remains constant within seasons. In our study region, migratory species are present in both seasons; some migratory species such as the American kestrel have both resident and migratory populations, but during the fall-winter season they are found in greater abundances. All transect surveys were conducted during mornings (09:00 through 12:00) and in the afternoons (16:00 through 18:00) because these are the main activity times for raptors (Bunn, Klein, & Bildstein, 1995; Vergara, 2010).
Functional Traits
Raptor species functional traits included in this study were grouped in the following categories (Table 1):
Seasonal status: Whether the species is a year-round resident (i.e., spends the entire year in the study area), winter resident (i.e., is absent from the study area in summer but present in winter), or summer resident (i.e., is absent from the study area in winter). Diet specialization: Whether the species is a specialist which prefers a particular food (more than 90% corresponds only to one type of food preference category from those categories described later) or a generalist (has no food preference) in terms of its diet. Food preference: The main food items that have been reported as being consumed by raptors include carrion, fish, rodents, birds, lagomorphs, and invertebrates. Foraging strategy: Raptor species have specialized in terms of their abilities to secure food capture success. These categories include foraging from perches and hunting flights. Hunting flights include hovering, chasing or ambush flights, and glide-search flights. Social behavior: This classification includes solitary versus flocking species. Life expectancy (in years): average lifespan based on information from the literature. Average weight (g): average weight combining males and females. Wingspan: length in cm from the edge of one wing to the edge of the other wing. Raptor Species Functional Traits at the High Plateau of San Luis Potosí and Zacatecas, Mexico.
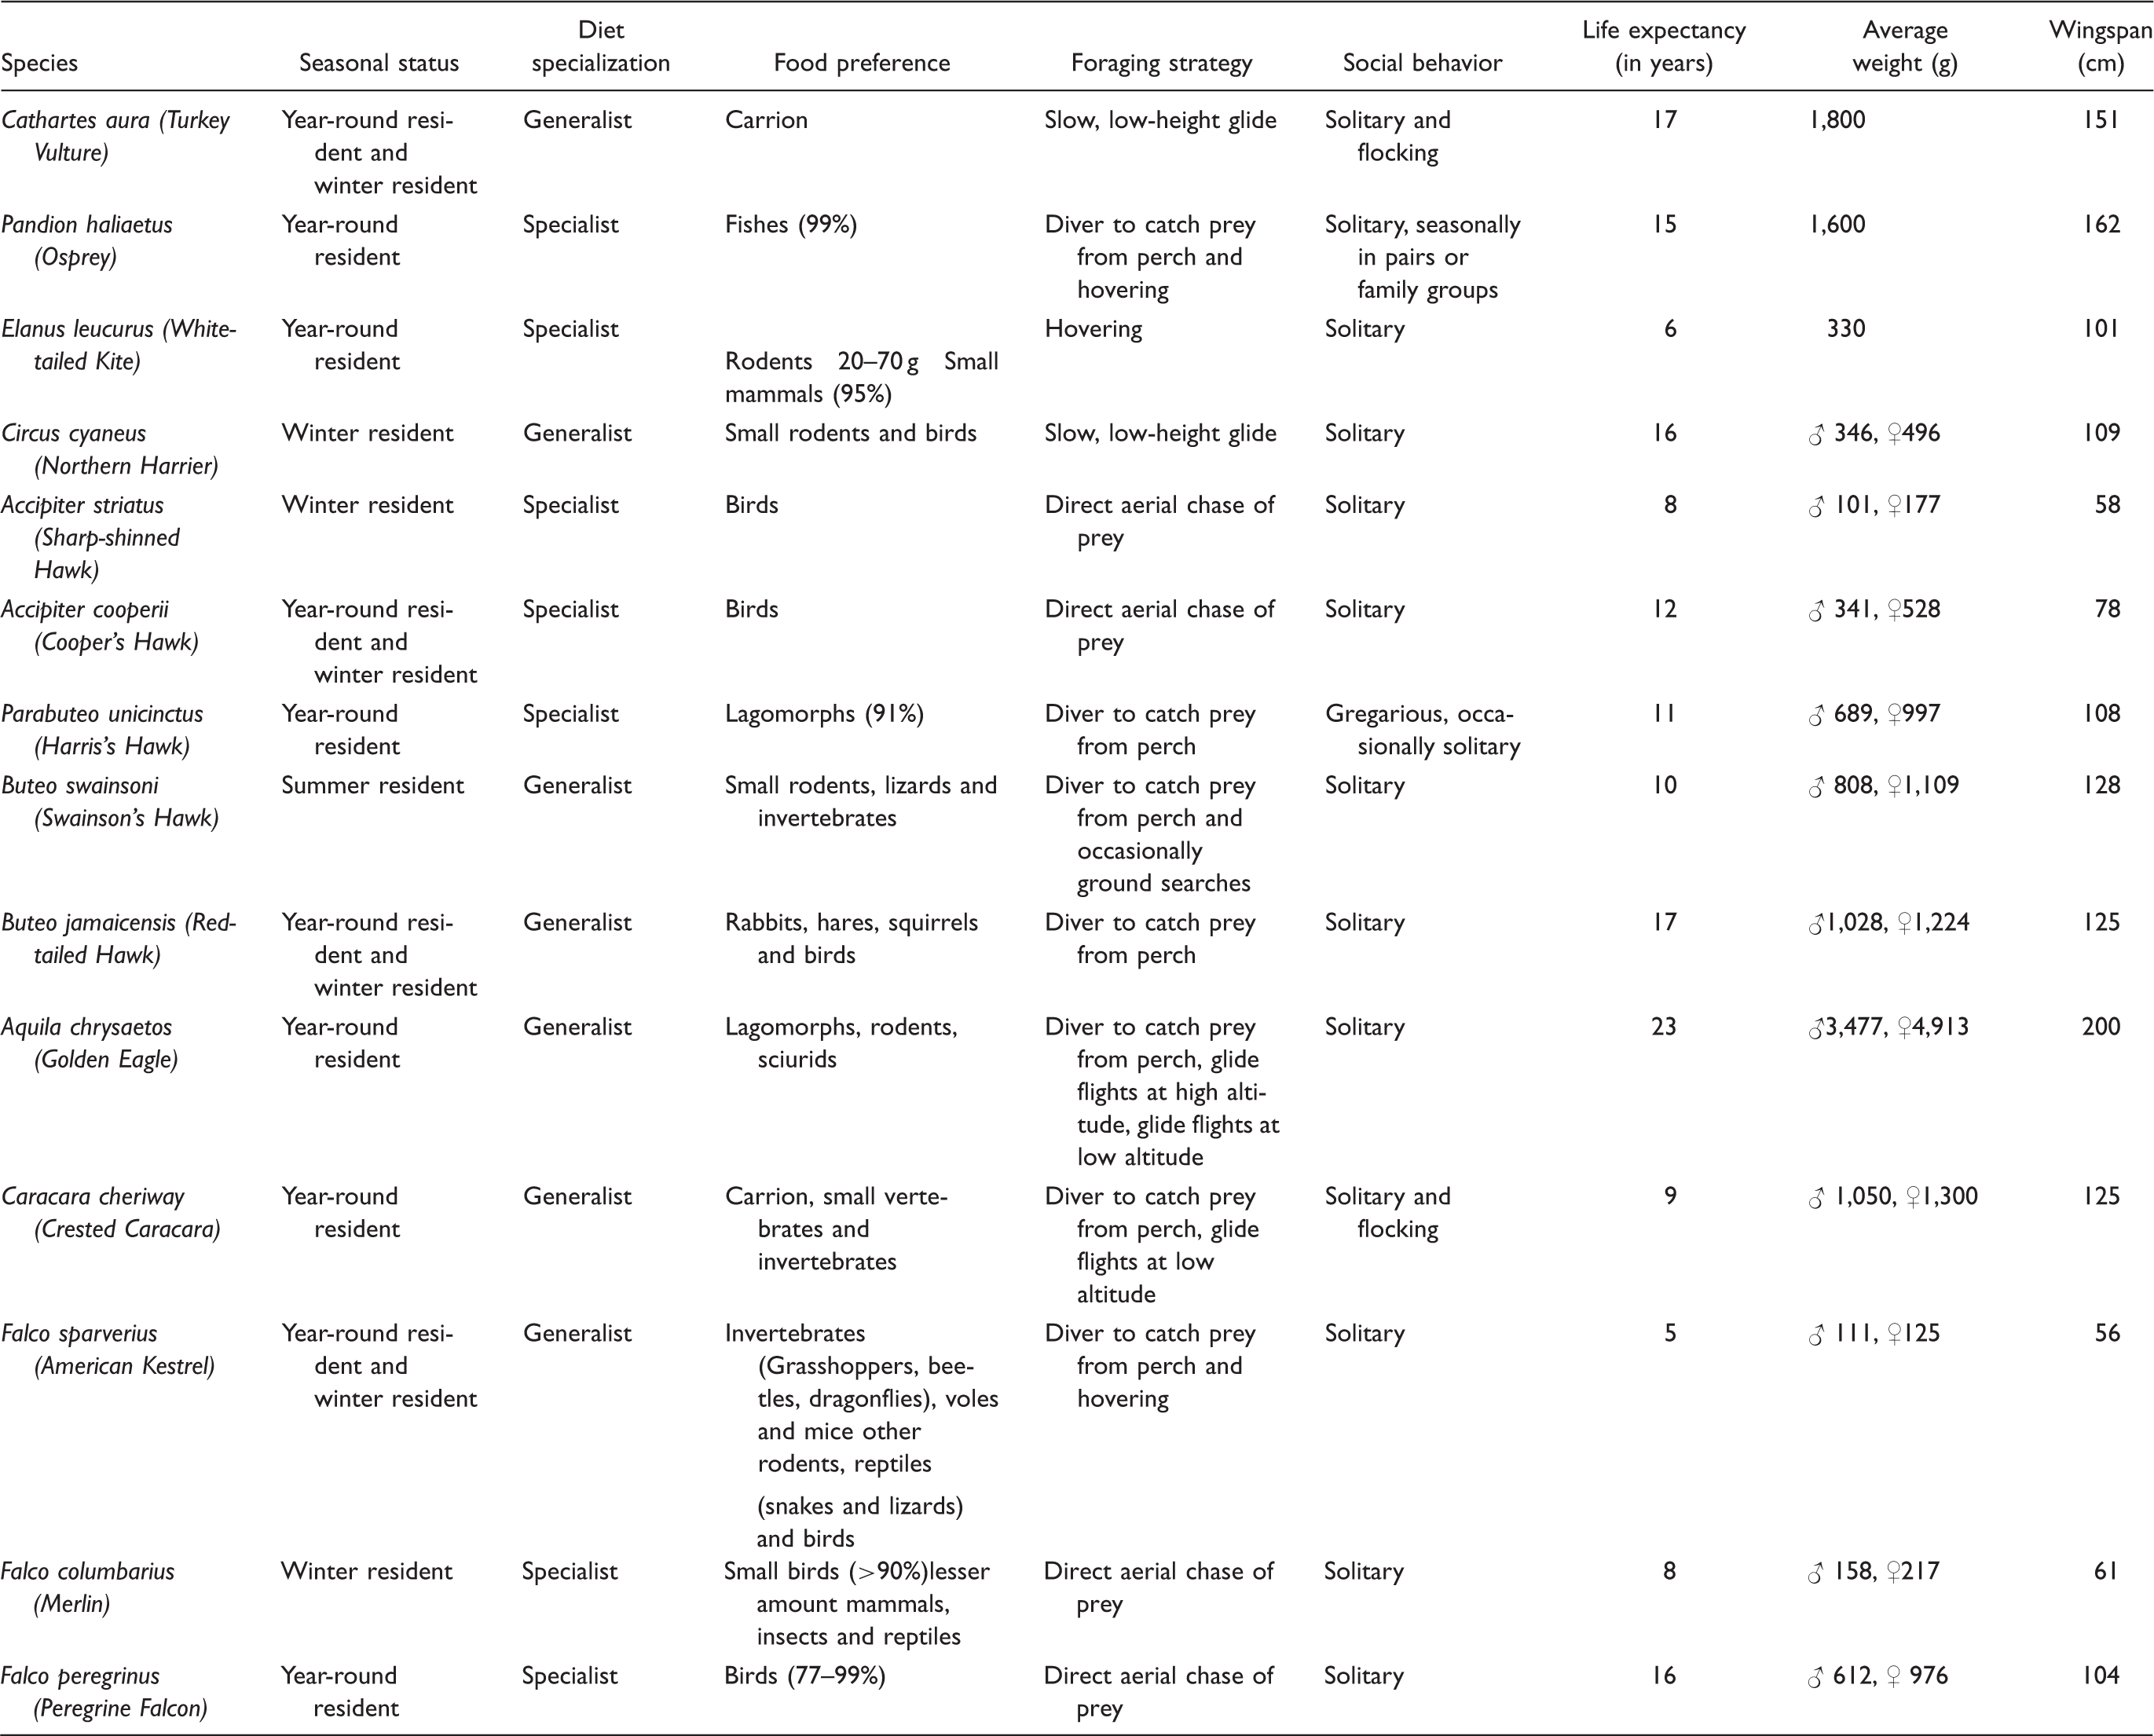
Information on functional traits was compiled from various publications (Cornell Lab of Ornithology, 2015; Ferguson-Lees & Christie, 2001; Rodewald, 2016; Wheeler, Clark, & Dunne, 1995).
Data Analysis
We assessed the completeness of our species inventories at each site by calculating the percentage of species observed relative to the total number of species predicted by the Chao 2 estimate of richness (Chao, 1984); this analysis was based only on species richness in each community. Therefore, information for all five surveys within seasons was combined for the calculations.
Abundance estimator
For these calculations, we used the information corresponding to the survey replicate that yielded the highest count for each species in order to simultaneously avoid pseudo replication and to manage to use the largest possible amount of data (see Appendix B). We implemented this analysis strategy because bird abundance estimation methods require the largest possible number of detections (reviewed in Buckland et al., 2001; MacKenze et al., 2006), and raptor populations naturally have low abundances.
Diversity analysis
Keeping in mind that sample size was small to conduct parametric inference for diversity based on the raw data, we performed this analysis based on parametric estimation through the construction of confidence intervals from resampling techniques (1,000 interactions without replacement). The rarefaction analysis is a method that was proposed to compare the number of species when the samples differed in size, and estimates the species richness for all samples at the sample size of the smallest sample (Gotelli & Colwell, 2011; Pla & Matteucci, 2001). Therefore, possible differences among landscape types were assessed through these 95% confidence intervals. Average alpha diversity was also obtained from resampling (1,000 iterations without replacement) estimates of the exponential of the Shannon index. The exponential of this index allows converting diversity measures into effective numbers for a more robust comparison among samples. This further allows graphically representing the magnitude of change in each comparison (Jost, 2006). This index was compared among the three studied landscape types.
Changes in species composition among all possible landscape type—season combinations were analyzed using permutational multivariate analysis of variance (Anderson, 2001b; Anderson, Ellingsen, & McArdle, 2006). These comparisons were plotted using principal coordinates analysis. This classification method is robust, and its interpretation is simple. It rests on the assumption that the measure of dissimilitude is monotonically related to ecological distance (Alvarado, Escobar, & Montero-Muñoz, 2014; Quinn & Keough, 2002). These procedures allowed us to assess potential differences in composition and its variation among all three landscape types for each season. We used 719 permutations for comparisons between seasons and 999 permutations for comparisons among landscapes. These analyses were conducted using the Vegan library within the R programming environment (R Core Team, 2013).
Functional diversity
For the functional diversity analysis, we used an estimate of functional richness based on dendrogram length, FRD (Petchey & Gaston 2002), which is defined as the total branch length of the functional dendrogram that can be constructed from information about species’ functional traits. For this purpose, a functional features matrix was created. This matrix was transformed into a distance matrix in order to group functional groups through a dendrogram deriving the formation of functional groups. To generate this dendrogram, the euclidean distance modified by Pla, Casanoves, and Di Rienzo (2012) was used. The functional diversity index and dendrogram were obtained in the FDiversity software (Casanoves, Pla, Di Rienzo, & Díaz, 2011); this analysis is based on species richness in each community exclusively. To determine statistical differences in FRD values between landscapes, a mixed effects analysis was performed using landscape type and season as fixed effects, transects, which were replicated five times each within season, were treated as a nested factor within landscape types, and as a random factor. We further constructed and examined residual plots in order to verify that the assumptions of the analysis were met. These analyses were conducted using r and the lme4 library.
Finally, in order to explore species redundancy in the functional groups, Pearson correlations between FRD values of each landscape type and observed richness were obtained. We assumed that if the correlation was linear, it would indicate that the redundancy was null since each species would increase the function.
Results
Raptor Diversity
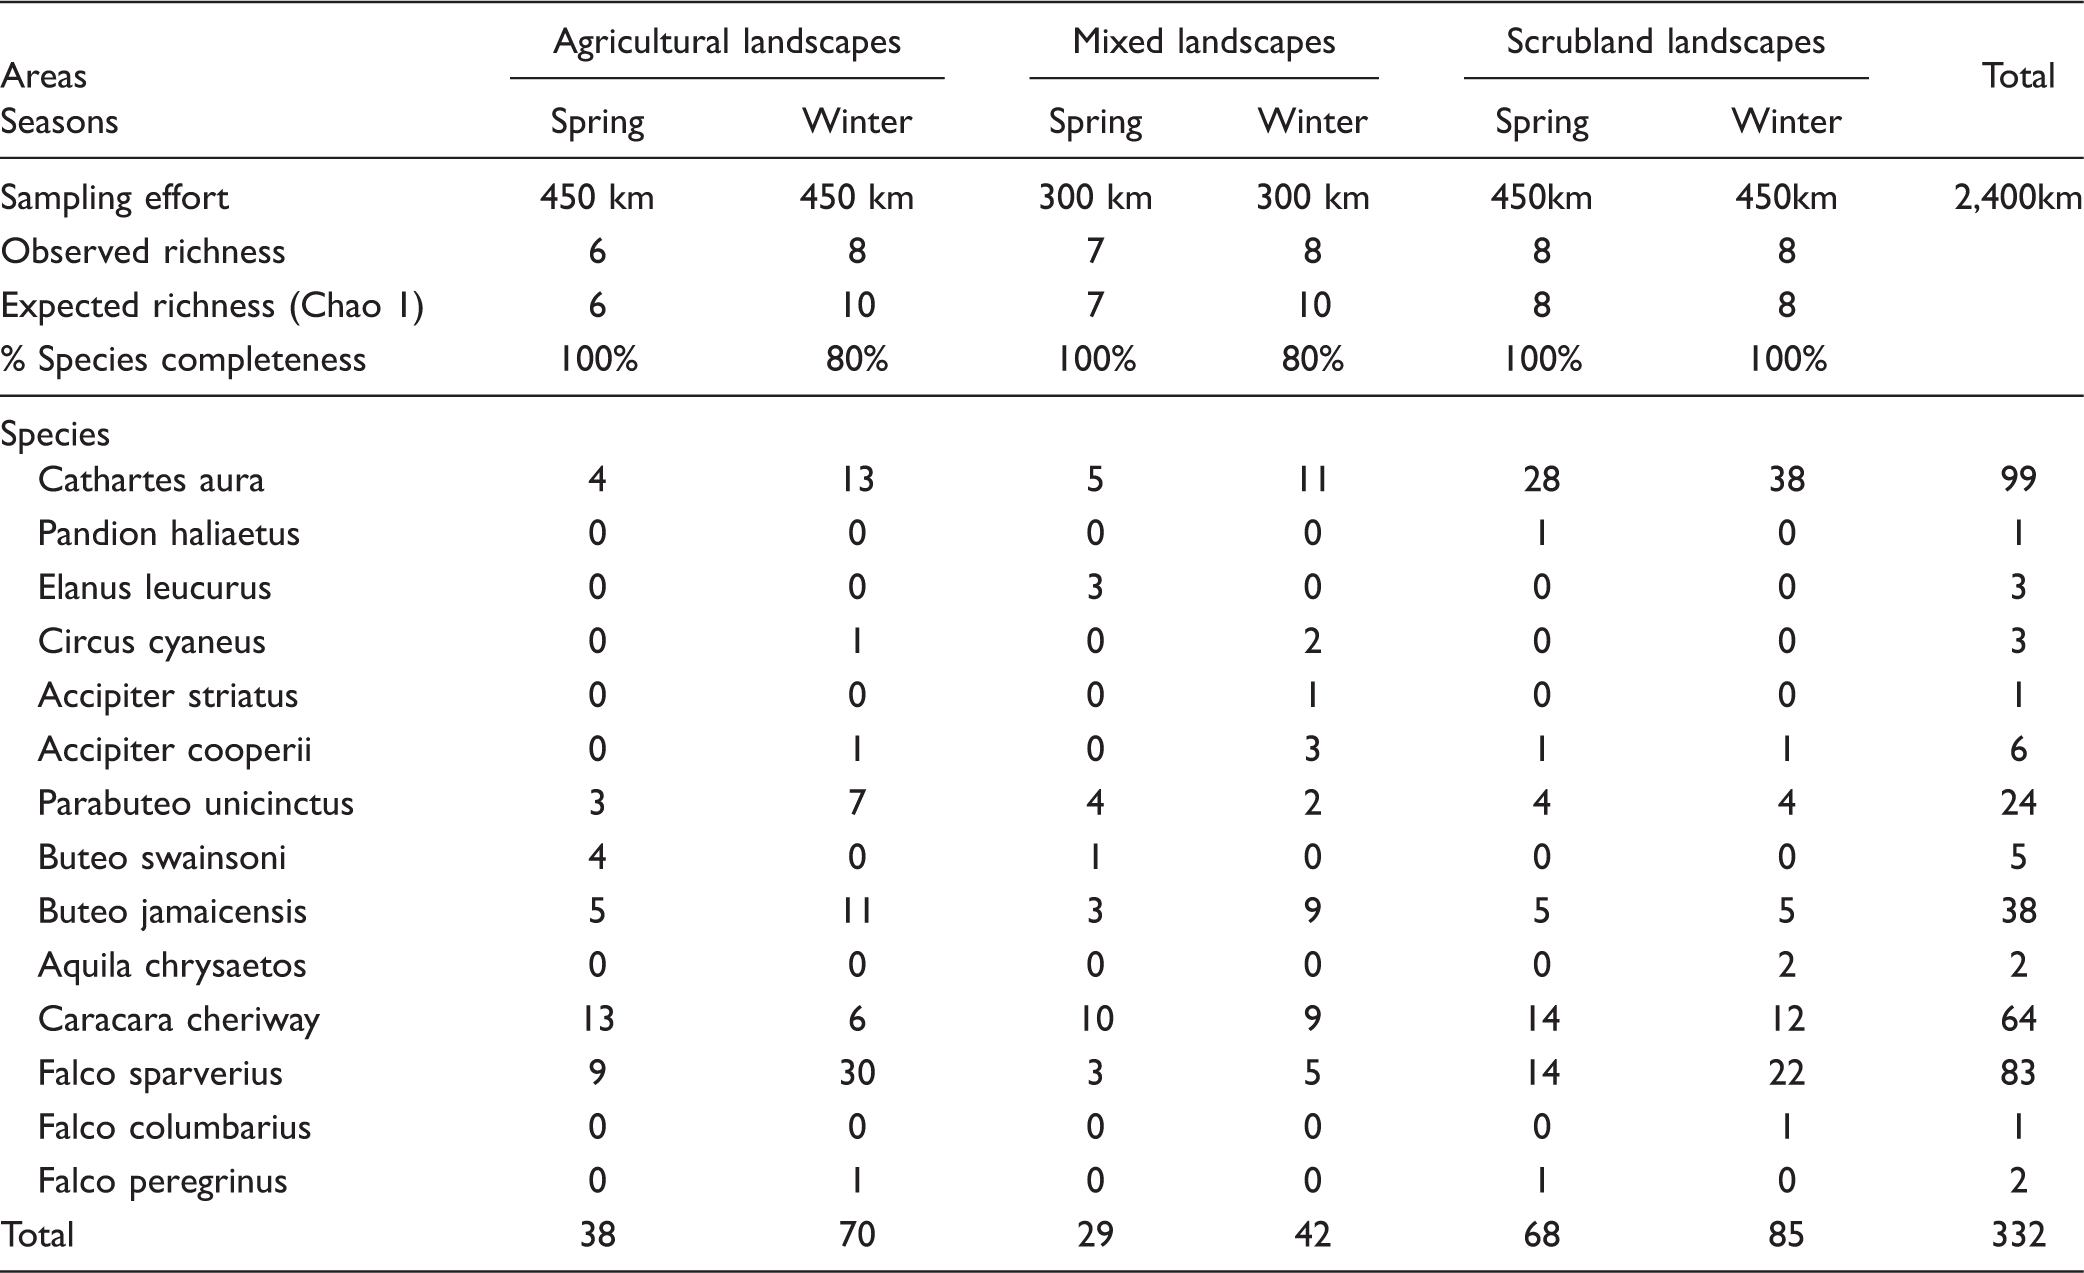
A total of 80 raptor bird census transects were completed, yielding an overall sampling effort of 2,400 km. Percentage of completeness of species ranged between 80% and 100% (see Appendix A). In all, 644 sightings for a total of 332 individuals and 14 diurnal raptor species were obtained in the study area. Of these, 10 species were recorded in spring-summer and 11 in fall-winter. The most abundant species were the turkey vulture (Cathartes aura), American kestrel (Falco sparverius), crested caracara (Caracara cheriway), and red-tailed hawk (Buteo jamaicensis; Appendix A). During both seasons, spring-summer and fall-winter, the greatest average diversity was recorded in mixed landscapes followed by agricultural landscapes, and the smallest average diversity was found in scrubland landscapes. Differences in diversity among landscape types, however, were not significant (Figure 2(a) and (b)).
Changes in raptor species diversity among landscape types (agricultural vs. mixed vs. scrubland) in two seasons: spring-summer (a) versus fall-winter (b). 95% confidence intervals are shown.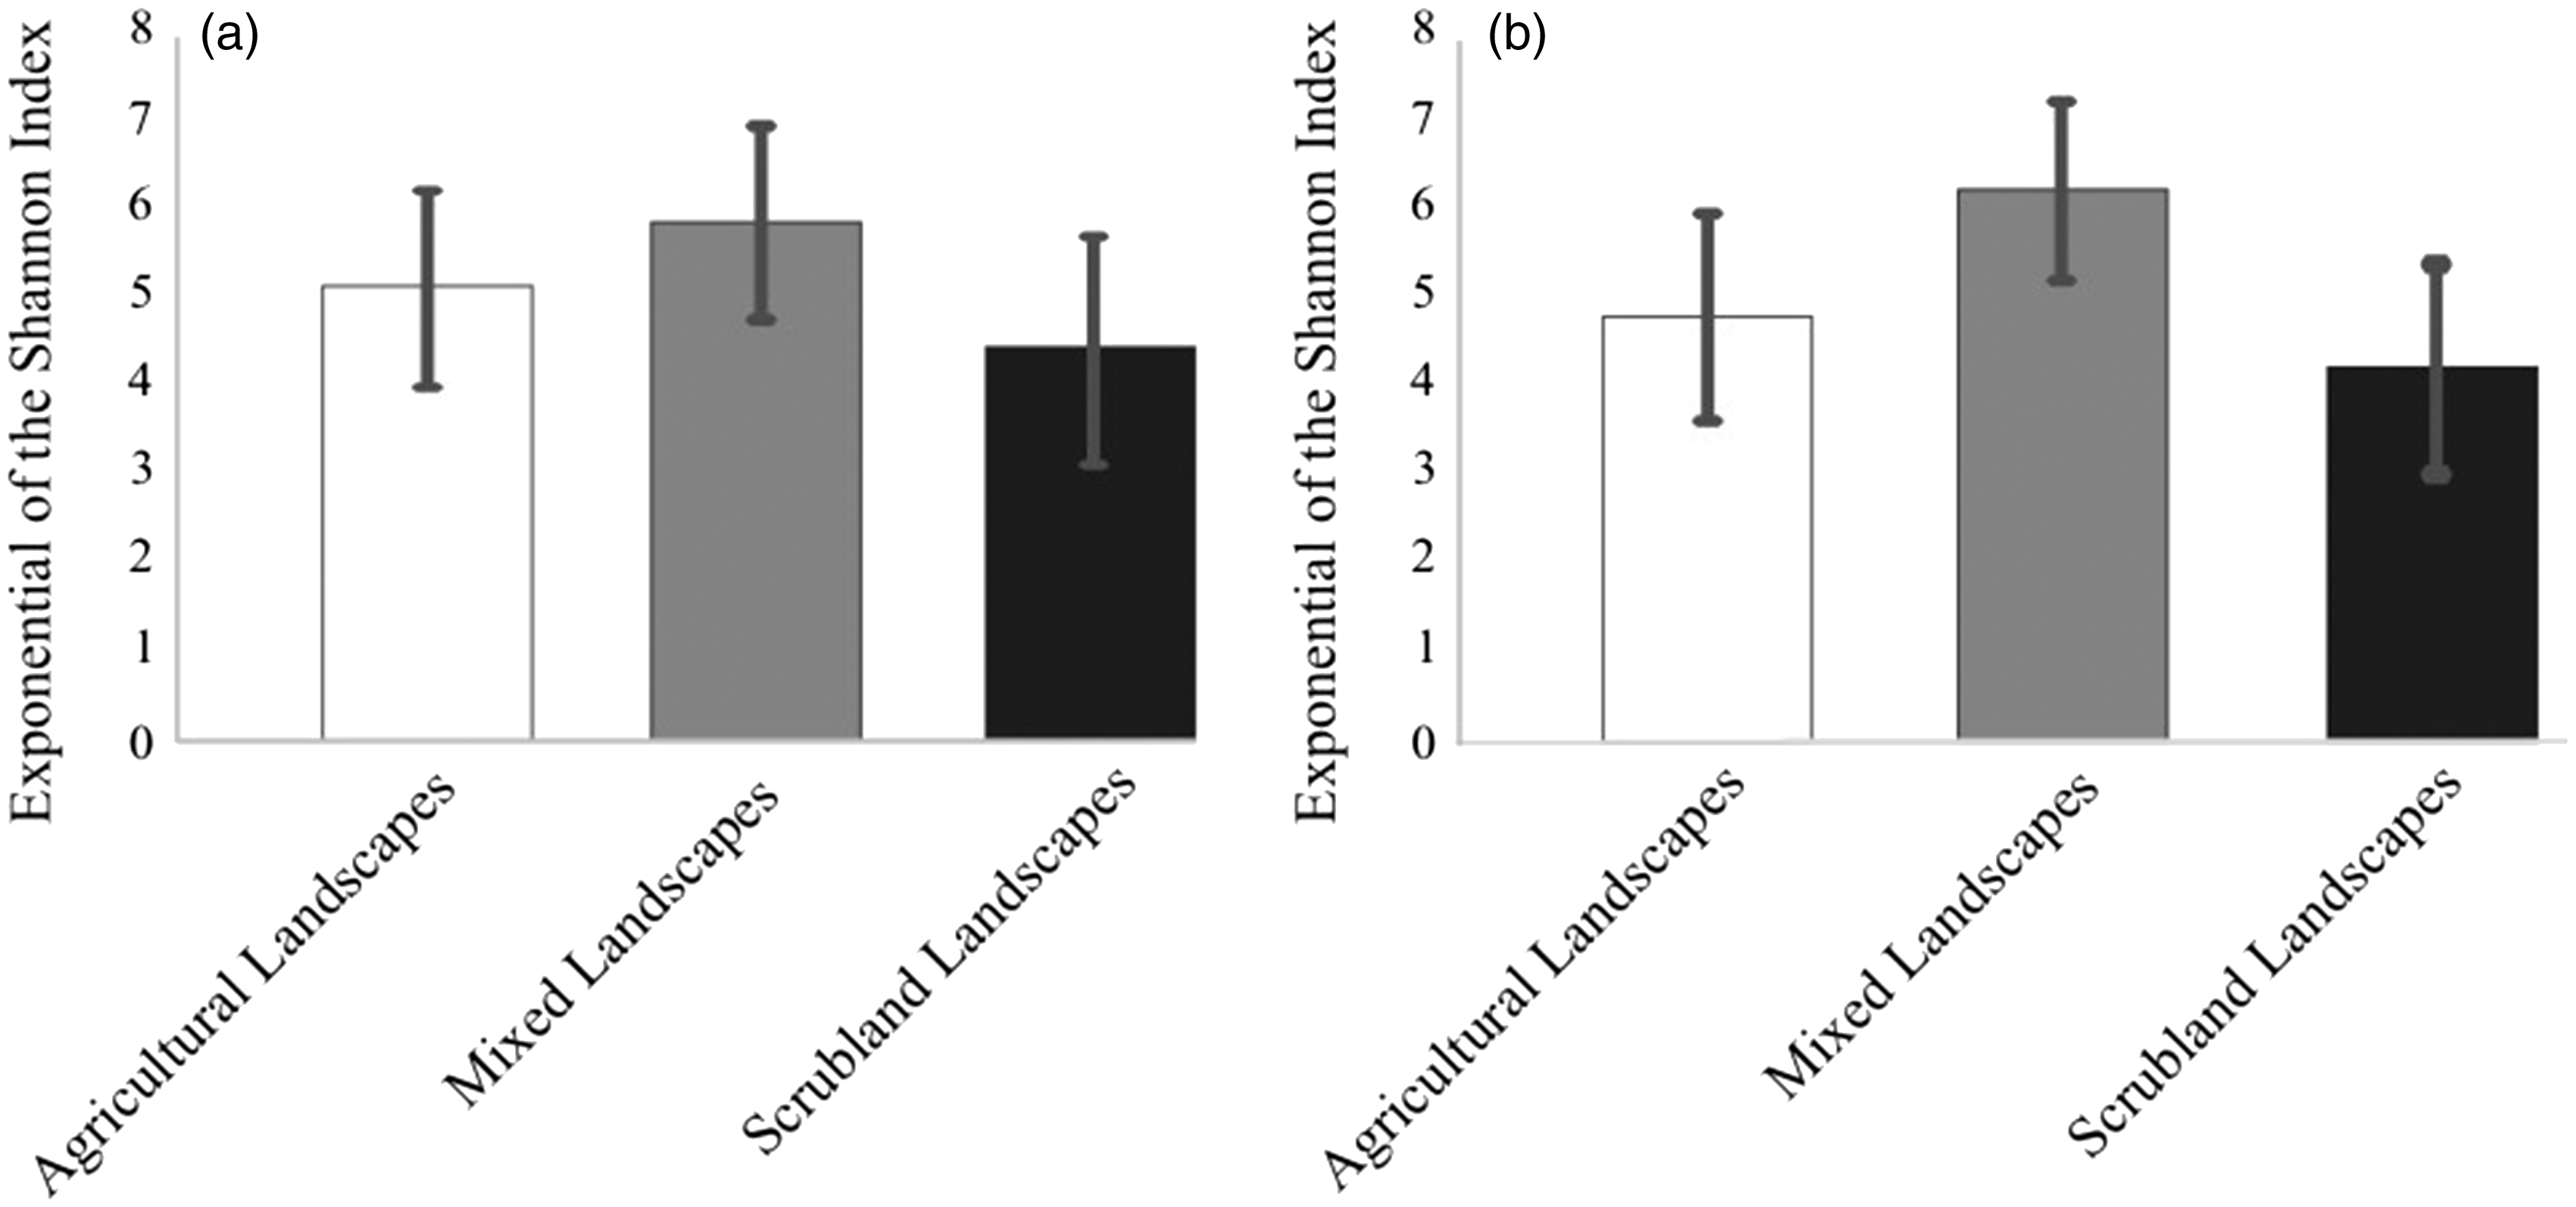
The permutational multivariate analysis of variance did not yield any differences in relation to the expectancy among landscape types during spring-summer (pseudoF = 0.246, df = 2, p = .84; Figure 3). Although during fall-winter, species composition contrasted more among landscape types, significant differences were also not found (pseudoF = 1.430, df = 2, p = .45; Figure 3).
Principal coordinates graph from permutational multivariate analysis of variance (PERMANOVA) for the two seasons surveyed (spring-summer and fall-winter). Dots represent location of samples (transects) in the space defined by two axes based on species composition. The centroid of each graph is also shown. For both seasons, the box plots show the differences in the distribution of means (distance to the centroid) and quartiles for each landscape type.
Between seasons in scrubland, changes in composition were also not significant relative to the expectancy (pseudoF = 0.197, df = 1, p = .70) and in agricultural landscapes (pseudoF = 1.187, df = 1, p = .40; Figure 4). Contrastingly, in mixed landscapes, composition yielded significant changes relative to the expectancy in fall-winter in comparison to spring-summer (pseudoF = 591530, df = 1, p = .04). However, we observed some changes in species composition between seasons; in agricultural landscapes, one species was exclusive of spring-summer, and four species were exclusive during fall-winter (Figures 5(a) and 6(a)). In mixed landscapes, two species were found exclusively in spring-summer and three in fall-winter (Figures 5(b) and 6(b)). In contrast, in scrubland landscapes, two species were unique to each season (Figures 5(c) and 6(c)).
Principal coordinates graph from permutational multivariate analysis of variance (PERMANOVA) for the three landscape types (agricultural, mixed, and scrubland). Dots represent location of samples (transects) in the space defined by two axes based on species composition. The centroid of each graph is also shown. For each landscape type, the box and wisker plot shows the difference in the distribution of means (distance to the centroid) and quartiles for each season. Functional groups and raptor bird species included in each landscape type (a) to (c). Branching of each cluster represents the entire raptor community present in spring-summer. Empty lines in each cluster represent species absent from each landscape type. In addition, the relationships between the functional diversity and species richness (d) to (f) are graphically presented. Functional groups and raptor species included in each landscape type (a) to (c). Branching of each cluster represents the entire raptor community present in fall-winter. Empty lines in each cluster represent species absent in each landscape type. In addition, the relationships between the functional diversity and species richness (d) to (f) are graphically presented.


Functional Diversity
Overall observed species richness in study sites assembled the following four functional groups. Group 1: Aquila chrysaetos (golden eagle); Group 2: Falco columbarius (merlin), F. sparverius, Accipiter striatus (sharp-shinned hawk), A. cooperii (Cooper’s hawk), Circus cyaneus (Northern harrier), and Elanus leucurus (white-tailed kite); Group 3: Cathartes aura and Pandion haliaetus (osprey); and Group 4: Caracara cheriway, Buteo jamaicensis, B. swainsoni (swainson’s hawk), Falco peregrinus (peregrine falcon), and Parabuteo unicinctus (Harris’s hawk).
In spring-summer season, only three functional groups were maintained in all three landscape types (Figure 5(a) to (c)). On the other hand, during fall-winter, no differences in species richness were recorded among landscape types as all three landscapes had eight species. In this season, however, there were differences in the number of functional groups formed (Figure 6(a) to (c)).
Regarding the contribution of species richness to functional diversity, in spring-summer, the results suggested that both for agricultural landscapes (r2 = .80, p = .001) which have the greatest functional diversity, and scrubland landscapes (r2 = .87; p = .001), which hold the smallest functional diversity, there is evident redundancy of species (Figure 5(d) and (f)). This trend, however, was not observed for mixed landscapes (r2 = .93, p = .01, Figure 5(e)). During fall-winter, agricultural was the only landscape showing redundancy of species (r2 = .83, p = .001; Figure 6(d)), while in the other two landscapes, redundancy was not evident (r2 = .80, p = .01; r2 = .80, p = .001; Figure 6(e) and (f)).
In terms of functional diversity analysis, one transect from scrubland landscapes during spring-summer yielded no raptor records in two occasions. For the functional diversity, these results cannot be reported as zero values because zero corresponds to the presence of one species in the sample. Therefore, we eliminated these two replicates from the sample for this analysis. Scrubland landscapes had the highest average values, followed by mixed landscapes, and then by agricultural landscapes (Figure 7). Functional diversity was higher in fall-winter than in spring-summer (F = 7.07, df = 1, 76, p = .01; Figure 7(a)). In spring-summer, species richness was higher in scrubland landscapes in comparison to agricultural landscapes (eight vs. six species). These differences were sufficient to yield significant changes in functional diversity between agricultural and scrubland landscapes in spring-summer (F = 3.77, df = 1, 26, p = .03; Figure 7(b)), but no differences among landscape types were significant in fall-winter (F = 2.63, df = 1, 28, p = .09; Figure 7(c)). Regarding the random effect nested within landscape types, the standard deviation due to this effect was negligible (0.00 for agricultural landscapes, 1.59e-8 for mixed landscapes, and 1.79e-8 for scrubland landscapes). Residual standard deviation was also small (0.13). Finally, inspection of residual plots did not reveal any evident deviations from normal distribution of error terms and from homoscedasticity.
Changes in raptor community functional diversity among landscape types (agricultural vs. mixed vs. scrubland) between two seasons (a), and into of each season: spring-summer (b), fall-winter (c). Standard errors are shown in each figure.
Discussion
Previous studies have reported that raptor species richness and diversity decrease with increasing habitat modification by anthropogenic activities (Butet et al., 2010; Carrete, Tella, Blanco, & Bertellotti, 2009; Chamberlain, Fuller, Bunce, Duckworth, & Shrubb, 2000). We did not record significant differences in diversity among landscape types. However, results may be inconsistent among regions as illustrated from findings from South America (Ellis, Glinski, & Smith, 1990), and from forests in Honduras (Anderson, 2001a) where raptor diversity, density, and richness increased with increasing landscape heterogeneity. These heterogeneous landscapes and the presence of low levels of agriculture may benefit some raptor species because new niches are created with greater prey availability and visibility for hunting.
Our results suggest that less species are present in landscapes with greater proportion of agriculture. However, because our study only included 1 year, more study is needed to make inferences related to changes in species richness through time associated to changes in landscape composition.
Most raptor species included in our study were recorded in all three landscape types. This result owes to the fact that these species are habitat generalists that adapt to the types of conditions typical of dryland habitats. However, many species are food specialists, and there is substantial variation in body size. Consequently, our analysis based on functional attributes revealed trends that we would otherwise have not managed to identify. Ecological diversity, as analyzed by the exponential of the Shannon–Wiener index, which has been used for many raptor studies in the past, was not sensitive to differences among landscape types. In contrast, the functional analysis revealed some differences between seasons and between landscape types within the fall-winter season. The degrees of freedom for the functional analysis are somewhat small because we had a small number of landscape types and seasons. Therefore, this result should be viewed conservatively. However, the inclusion of the functional analysis, in addition to the taxonomic analysis allowed us to increase our understanding of how functional diversity decreases as agricultural cover increases in the landscape.
The main characters that separated the four functional groups that were formed included: (a) size (mass and wingspan), as the first functional group included the largest species (≥4 kg), the third group included species ranging from 1.5 to ≤ 4 kg, the fourth group included species ranging from 0.5 to 1 kg, and the second group included the smallest species (<0.5 kg); (b) foraging strategy, which helped define Groups 4 and 1 that included species that mainly forage from perches, whereas Group 3 has more diverse foraging techniques; (c) diet specialization, as most species in Groups 2 and 3 specialize in specific types of food, whereas the remaining groups are generalists; and (d) seasonal status, a character that was especially important for Group 2 which contains winter migrants, a group of organisms that spend the winter in the region.
In our study, the most contrasting changes had to do with species composition. These changes were evident both for landscape type and season. In agricultural landscapes, for instance, five species were absent, three of which were exclusive to scrubland landscapes, and two of which were exclusive to mixed landscapes. Similar results were found in Uganda, where forest raptors were absent from agricultural areas (Seavy & Apodaca, 2002). In addition, six species were present in all landscape types.
Two of the species included in our surveys, the golden eagle (Aquila chrysaetos) and the osprey (Pandion haliaetus) are of special interest because they were recorded only in scrubland landscapes and were absent even from landscapes with very small percentages of agriculture (7%). This result may be related to their sensitivity; the golden eagle, for instance, has special requirements in terms of huge home ranges as well as food consisting on large prey (Cornell Lab of Ornithology, 2015). The osprey, on the other hand, has very specific food requirements consisting exclusively of fish. As a consequence, landscapes having even very moderate percentages of agriculture loose important functional components such as species that control rodent and fish populations.
In these modified landscapes, the Harris’s hawk, a species that is similar to the golden eagle in terms of food specialization is present. Its functional role, however, is different in comparison with the golden eagle because its effect on regulation of populations of other species varies considerably; the biomass that the Harris’s hawk consumes mainly corresponds to lagomorphs which constitute 91% of its diet (Bednarz, 1988). This species, however, forms groups of two to seven individuals that generally occupy relatively small territories (<3 km2, Bednarz, 1995; Dawson & Mannan, 1991). Contrastingly, the golden eagle, which also feeds on lagomorphs, holds larger territories of up to 15 km2 during spring-summer and 65 km2 during fall-winter (Kochert, Steenhof, McIntyre, & Craig, 2002; Marzluff, Knick, Vekasy, Schueck, & Zarriello, 1997). Therefore, more than 20 Harris’s hawk groups are required to cover an area equivalent to that of a golden eagle territory. Moreover, Harris’s hawks occur on very low abundances in our study region, even in areas that are not occupied by golden eagles. In this respect, the ecosystem function varies between these two species, and the absence of the golden eagle due to abandonment of formerly occupied territories as a result of anthropogenic-induced habitat degradation, as has been recently documented (Ortíz, 2016), translates into losses of ecosystem functions.
On the other hand, some species were recorded in all landscape types. The American kestrel (Falco sparverius) is a small raptor species with populations that migrate from North America to Central and South America where individuals of the species spend several months, from September to February. This species also has resident populations that spend the entire year in North America (Cornell Lab of Ornithology, 2015; Farmer & Smith, 2009; Howell & Webb, 1995; Ruiz-Campos et al., 2005). Despite landscape changes, this species appears to keep providing its ecosystem functions. However, as populations of this species have been in decline during recent years, their actual status in terms of diseases, number of offspring, and so on has been questioned. These factors may be affected to some extent by landscape degradation.
The American kestrel is included in Functional Group 2. In fact, this is the only species in this group that is present in the region throughout the year in all three studied landscape types. Therefore, the ecosystem function that this group provides largely depends on the kestrel. This fact indeed constitutes a potential risk; if kestrel populations decline within the region, as it is happening in some regions of North America, the functional group could disappear or at least would be left with only one species, especially during spring-summer. During fall-winter, however, additional species including Circus cyaneus, A. striatus, and Falco columbarius arrive, thus complementing the ecosystem functions of this group.
Two species were only recorded in the most degraded landscapes, these included a winter migrant (C. cyaneus) and a summer resident (B. swainsoni). Swainson’s hawk is a generalist species that lives in a wide variety of open habitats including desert, shrubsteppe, grassland, and agricultural habitats (Bednarz, 1988; England, Bechard, & Houston, 1997; Fleishman et al., 2016; Nishida, Boal, DeStefano, & Hobbs, 2013; Smallwood, 1995). However, studies have found that for this species, the presence of trees within agricultural areas is important for the nesting process (Nishida et al., 2013). On the other hand, visibility for hunting is important for C. cyaneus. This species usually flies slowly and at low altitudes, near the ground in search for food items such as voles or mice during winter when this species uses open habitats such as croplands, grasslands, and old fields.
Our results seem to indicate that raptors are affected by the degree and magnitude of degradation associated to land use changes. These responses vary among species and are determined by their individual degrees of persistence and tolerance. The effects of some anthropogenic activities, such as agriculture, are contrasting; whereas most raptors respond negatively, some others such as C. cyaneus and B. swainsoni tolerate these changes (Rodewald, 2016). However, there may be a tolerance threshold above which, even for the most adaptable species there may be negative consequences (Andersen, Rongstad, & Mytton, 1990; Strasser & Heath, 2013).
Raptor size and diet appear to be the most important attributes conferring them tolerance to modified environments, this appears to be a widespread pattern for all birds (Sekercioglu, 2012). It has been previously reported that some species from the Falco genus, especially those of small body size, are the most tolerant to anthropogenic-driven habitat changes. These species take advantage of open habitats that apparently provide hunting opportunities (Filloy & Bellocq, 2007; Jensen, Gregory, Baldassarre, Vilella, & Bildstein, 2005; McCrary, McKernan, Wagner, & Landry, 1985).
In the Mediterranean region, for instance, it has been reported that populations of the common kestrel (Falco tinnunculus) have greater abundances in areas with greater grass cover and in agricultural fields (Campion, 2004). In Mexico, a study from desert areas of Southern Baja California reported that the American kestrel persists in the spring-summer season in agricultural areas at densities and abundances that are similar to those in natural areas (Tinajero & Rodríguez-Estrella, 2012). This result is consistent with our findings. Moreover, similar results were also recorded for the American kestrel at the Dutch Antilles (Nijman et al., 2009). However, recent studies indicate that ecological stress in these habitats is higher in comparison with moderately disturbed habitats (Strasser & Heath, 2013).
Some medium-sized species such as the caracara are commonly associated to agricultural areas. For Argentina, it has been reported that medium-sized species such as the chimago caracara (Phalcoboenus chimango) and the southern caracara (Caracara plancus) are the most abundant in crop fields (Carrete et al., 2009; Goldstein & Hibbitts, 2004). Similarly, in Southern Baja California, Mexico, crested caracaras appear to benefit from disturbance (Rodríguez-Estrella, 2007). On the other hand, caracaras prefer natural environments in Florida and in the Dutch Antilles (Dwyer, Fraser, & Morrison, 2013; Nijman et al., 2009). We found that low caracara abundances were associated to agricultural and scrubland landscapes. Therefore, it appears that mixed landscapes in our study region have a positive effect on this species (Appendix A).

S = surveys, HNI = highest numbers of individuals.
Implications for Conservation
Our results contribute to the limited information related to raptor community ecology in semiarid environments of northern-central Mexico and are useful for agencies dedicated to natural areas management such as the National Commission for Natural Protected Areas (CONANP), the Federal Secretariat for the Environment and Natural resources (SEMARNAT), and the State Secretariat for Ecology and Environmental Management (SEGAM), among others. Our results suggested that if these agencies are interested in maintaining raptor functional attributes in dryland habitats of central Mexico, agriculture should be avoided in some large areas comparable to those of golden eagle territories. We believe that implementation of such strategy is realistic considering both, that agriculture in these drylands is not highly productive and logistically difficult to implement due to the absence or abundant water sources, and that agriculture in portions of this region covers small proportions of the land. However, alternative development strategies that would both enhance livelihoods of local inhabitants and promote scrubland habitat conservation should be developed.
Footnotes
Appendix A
Acknowledgments
The authors would like to thank A. Lugo, A. Ortiz, G. Ham, and V. Torres who helped during fieldwork.
Declaration of Conflicting Interests
The author(s) declared no potential conflicts of interest with respect to the research, authorship, and/or publication of this article
Funding
The author(s) disclosed receipt of the following financial support for the research, authorship, and/or publication of this article: This work was funded by the Basic Science CONACYT program (project grant number CB-2012-1-183377).