
Abstract
Collecting data for reports on online wildlife trade is resource-intensive and time-consuming. Learning often focuses on the main item traded by each country only. However, online trade is increasing, providing potential to update the conversation from a national scale to a global scale. We demonstrate how hierarchical clustering can identify wildlife items that follow similar trading patterns. We also ordinate the clusters, and seek correlations between the clusters and global measures, such as Worldwide Governance Indicators. We primarily use a sample dataset from a published report of online traded wildlife, covering 16 countries and 31 taxa or product types. Clustering provided immediate insights, such as rhinos and pangolins were traded similarly to ivory and suspected ivory. Five out of eight clusters represented items predominately traded by one country. An ordination of these clusters, and representation of global measures on the ordination axis, show a strong correlation of the ‘Voice and accountability' score with the clusters. Consequently, from the ‘Voice and accountability' score of the United States, a country not included in our dataset, we inferred that it traded elephant items (not ivory) and owl items during 2014.
Over-exploitation and the illegal trade in wildlife can threaten the survival of those traded species, as well as other species that are associated through by-catch (Broad et al., 2001). It can also impact local communities through social instability (Duffy, 2014), and result in the loss of access to resources and the benefits which they may have brought (Hinsley & Roberts, 2018). This has led to renewed interest in the illegal wildlife trade, particularly in the past decade, culminating in a number of inter-governmental conferences, beginning with the London Conference on the Illegal Wildlife Trade (2014). More recently, the illegal wildlife trade, and more broadly the wildlife trade (including legal trade), has come under the spotlight due to risks to human health. This has resulted from the wide reporting of, although yet to be proven, links between the coronavirus SARS-CoV-2 that caused the COVID-19 pandemic and wild animal consumption (Petrovan et al., 2020). Developing interventions around the wildlife trade is challenging due to the diversity of species being traded, the form in which the species are traded (from whole live species to parts and derivatives), and the countries in which the trade is taking place (from supply-side through to demand-side) (Roberts & Hinsley, 2020). Added to this is the often-forgotten challenge of legislative diversity between countries (for example, see Wingard & Pascual, 2018).
The rise in the online trade represents a significant challenge. The International Fund for Animal Welfare (IFAW), as well as other organizations, have published a number of reports into the online trade in wildlife since IFAW's first report in 2005 (IFAW, 2005). Nonetheless, these studies are often limited due to the resource-intensive nature of data collection and monitoring (Hernandez-Castro & Roberts, 2015). Furthermore, analysis has been rudimentary, largely focusing on identifying the species and/or product type (e.g. elephant ivory versus non-ivory elephant products) in trade, where the trade is taking place (the country and/or internet platform), and the size of the trade (the numbers of items and/or value). This form of analysis is suitable for highly traded items which are primarily traded by a single country. However, such an approach ignores less dominating, but not necessarily less important, information that can be extracted from the data. For example, focusing on these dominant items and dominant countries overlooks species that are traded more homogeneously across countries. As this data is hard-won, it is important to maximize its use by going beyond simple descriptive statistics.
Mirroring the data collected, and the analyses conducted, interventions often focus on specific species or products within specific countries; see Veríssimo and Wan (2019) for a review of behavior change campaigns. Intervention choices are unlikely to use resources efficiently, such as following the same trade routes, or being in demand by the same consumers. Additionally, implementing interventions is generally more difficult across multiple countries, particularly when it comes to legality (i.e. what is illegal in one country may be legal in another; see Wingard & Pascual, 2018).
Most studies into wildlife trade report basic statistics on the species they found and where the item was sold; either country and/or the online platform studies (e.g. IFAW, 2005; Hastie & McCrea-Steele, 2014). Highly traded items will dominate any analysis on wildlife trade, nonetheless, maximizing our understanding of the wildlife trade, beyond basic counts, requires the use of more sophisticated analytical techniques. For example, hierarchical agglomerative cluster analysis, with an ordination, is often used in community ecology to understand community structure. However, the authors are unaware of the same analysis being applied on wildlife trade data, likely due to a deficiency of suitable datasets. This deficiency is likely to be temporary as data continues to accumulate and becomes more readily available. However, such data sharing is not without its challenges due to consideration such as privacy and copyright.
This paper aims to highlight the need to move beyond simple descriptive statistics to gain a deeper understanding of the online wildlife trade. We illustrate this by using two datasets extracted from two already published NGO reports, and apply clustering and ordination. Specifically we ask two questions: (a) Do wildlife items show similarities in trade, and if so which items? (b) How does this trade correlate with global measures such as the GDP per capita of the trading countries? To answer (a) we perform a cluster analysis on two sample datasets which list wildlife items traded by different countries. To answer (b), where possible, we correlate the ordinated clusters with global measures, such as the GDP per capita of the trading countries. We discuss results, including challenges faced with the second dataset.
Methods
Large datasets from wildlife trade investigations are rare due to the process of data collections being intensive and resource-intensive. For example, of the 10 reports published by IFAW between 2005 and 2015, half looked only at a single country and half looked only at elephant products. Much of the data was fragmented and, based on the information presented in the reports, lacked sufficient detail to analyze with the methods we present here. However, two datasets are particularly extensive in terms of number of taxa and countries covered, and therefore are suitable for our simple clustering analysis. Both datasets are from the International Fund for Animal Welfare (IFAW): the first is from a 2014 report (Hastie & McCrea-Steele, 2014), and the second is from a 2008 report (IFAW, 2008).
Our primary dataset is from an extensive study of online wildlife trade (Hastie & McCrea-Steele, 2014) which investigated the trade of Convention on International Trade in Endangered Species (CITES) Appendix I animals (including live animals, parts and derivatives), over 280 open online marketplaces, across 16 countries, during a six week period in 2014. It should be noted that they did not specifically investigate the legality of the trade rather the presence of CITES Appendix I species in trade. Their report considers the main items traded by each country. Specifically the report focuses on more frequently traded items such as ivory, turtles and tortoises, and exotic birds, which are predominately traded by China, Germany and Ukraine respectively (see Figure 1).

The Number of Wildlife Items Traded Over the 6-Week Period in Early 2014 (Hastie & McCrea-Steele, 2014), According to (a) Wildlife Item Type and (b) Country.
The secondary dataset was from IFAW’s ‘Killing with Keystrokes’ report (IFAW, 2008). This report covered 11 countries, 183 websites and classified items into 16 product types of which half of these products were only traded by a single country. Again, the report did not specifically investigate the legality of the trade rather the presence of CITES Appendix I species in trade. Compared to our primary dataset, this dataset classed wildlife items differently. For example, in the 2014 report, elephant items are separated into those that are ivory related, and those that are not. Similarly, the 2014 report separated birds into exotic birds and birds of prey. These separations were not performed with the ‘Killing with Keystrokes’ dataset. Consequently, it is not possible to make comparisons across the two datasets. For both reports, data was simply transcribed from the tables presented within the reports.
To investigate whether wildlife items show similarities in trade, we perform an agglomerative hierarchical clustering analysis on both datasets separately. Therefore, wildlife items traded by the same countries will be in the same cluster. Hierarchical clustering first puts each species item in its own cluster, and then groups the closest two clusters to make one cluster. This process is repeated until all points are in one cluster. To implement the clustering, we use hclustvar from the ClustOfVar package for R v. 3.4.4 (R Core Team, 2018). This uses the principal component method, and singular value decomposition approach (Chavent et al., 2012; Kiers, 1991) such that the quantitative central synthetic variable (centroid) of a cluster is the first principal component. The algorithm maximizes the correlation between the variables and the centroid of their proposed cluster (Chavent et al., 2012).
To investigate how wildlife trade correlates with global measures, we ordinate the clusters using Nonmetric Multidimensional Scaling (NMDS). NMDS does not use the absolute number of items traded by each country, but rather their rank orders. By using a distance matrix, or a matrix of dissimilarities, NMDS determines the stress, or the disagreement, between a two-dimensional configuration and predicted values from the regression. There are many dissimilarity measures which reflect different aspects of the data. We test four different measures: Horn, Bray-Curtis, Euclid, and Manhattan. The best fitting measure was chosen using Spearman's rho, and the stress value noted. A low stress value corresponds to a good two-dimensional configuration, with less than 0.1 being ideal.
Next, we fit global factors to the ordination. These factors are the GDP per capita (from DataBank, World Bank, 2019a), and the six Worldwide Governance Indicators (World Bank, 2019b), as of 2014. The GDP per capita is a measure of a country's economic output that accounts for its number of people. It divides the country's gross domestic product by its total population. That makes it the best measurement of a country's standard of living. The six indicators measure separate, but related, concepts regarding the quality of governance (Thomas, 2010). The authors of the Worldwide Governance Indicators (Kaufmann et al., 2010) summarize the definitions as:
‘Voice and accountability' captures perceptions of the extent to which a country's citizens are able to participate in selecting their government, as well as freedom of expression, freedom of association, and a free media. ‘Political stability and absence of violence' measures perceptions of the likelihood that the government will be destabilized or overthrown by unconstitutional or violent means, including politically-motivated violence and terrorism. ‘Government effectiveness' captures perceptions of the quality of public services, the quality of the civil service and the degree of its independence from political pressures, the quality of policy formulation and implementation, and the credibility of the government's commitment to such policies. ‘Regulatory quality' captures perceptions of the ability of the government to formulate and implement sound policies and regulations that permit and promote private sector development. ‘Rule of law' captures perceptions of the extent to which agents have confidence in and abide by the rules of society, and in particular the quality of contract enforcement, property rights, the police, and the courts, as well as the likelihood of crime and violence. ‘Control of corruption' captures perceptions of the extent to which public power is exercised for private gain, including both petty and grand forms of corruption, as well as ‘capture' of the state by elites and private interests.
To ordinate the clusters, and fit the environmental effects, we use the Vegan package for R v. 3.4.4 (R Core Team, 2018). This package was designed for community ecology. Codes are included in the Supplementary Materials (1).
Results
Whilst we could cluster both datasets, the secondary dataset (IFAW, 2008) was too small to find correlations between the global factors and the clusters (see Supplementary Materials 2). We also note that due to different classifications of wildlife items, the clusters between both sets cannot be compared. As a result, the analysis of the secondary dataset (IFAW, 2008) is presented in the Supplementary Materials (2), and the paper focusses on the primary dataset (Hastie & McCrea-Steele, 2014).
From the primary dataset (Hastie & McCrea-Steele, 2014), our analysis grouped items that are traded by the same countries (Table 1 and Figure 2). We chose the optimum number of clusters such that entries are well represented within the cluster, but there are not as many clusters as there are entries. We identified the squared loading correlations – the correlation between wildlife item and the centroid of their respective cluster. From this measure we chose eight clusters since, except for a single outlier, the squared loading correlations are above 0.7, meaning that each item is well represented by the centroid. The outlier is Foxes (minimum squared loading of 0.177), which were only recorded for sale once by the UAE. The split at the highest level separated the clusters into those that have a dominant country that trades items from these clusters, Clusters 1, 2, 5, 6, 8; and clusters that do not have a dominant trading country, Clusters 3, 4, 7, see Figure 2 and Table 2. Those items in Clusters 1, 2, 5, 6 and 8 are traded predominately by China, Germany, the Netherlands, the UK and Poland respectively (Table 1). This initial split supports the appropriateness of agglomerative hierarchical clustering for this dataset, and confirms that the rudimentary analysis of focusing on the trade of highly popular items, which are predominately traded by one country, captures a lot of information. Indeed, as this is the first split, it captures the main trading behavior that differentiates items. Nonetheless, as we have shown, it does not capture all the information – it is only half the story.
The Species Clusters Ordered by Size, the Total Number of Trades for a Given Cluster, and the Country Which Prioritizes Trading of These Species.

The species within each cluster are listed in order, such that the first species listed (e.g. Wolves) is the most commonly traded within that cluster.
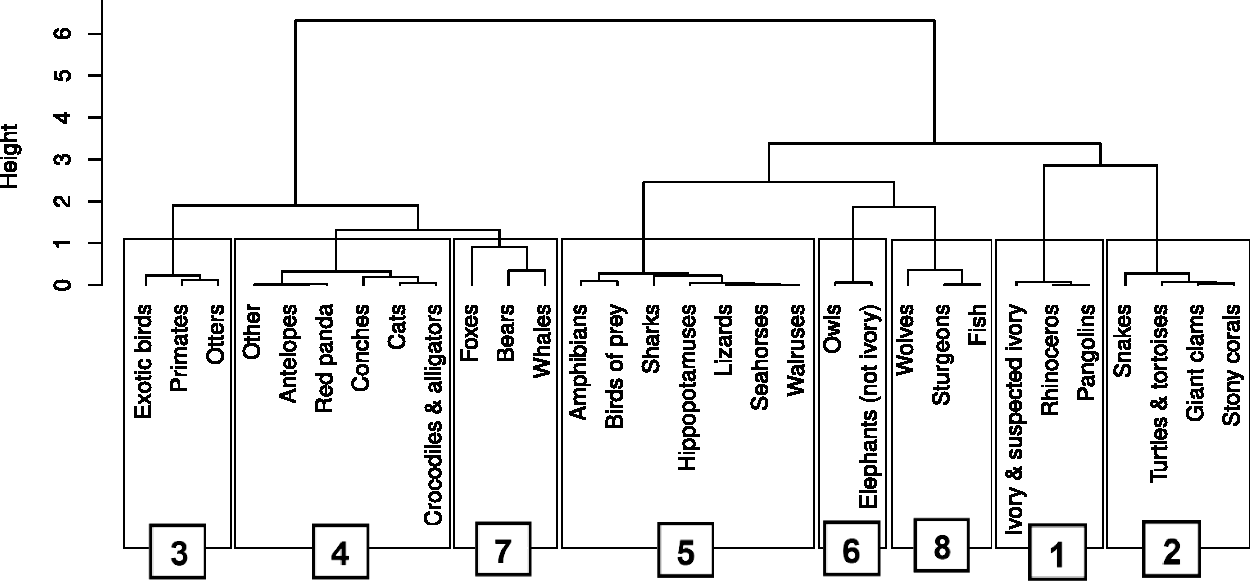
The Dendrogram When Clustering According to Wildlife Item Traded. The Labels Refer to the Cluster Number, Where 1 Is the Cluster With the Largest Number of Items Traded.
The Proportion of Items Traded by a Given Country (Rows), Differentiated by Cluster (Columns).

The dominant country for each cluster is highlighted in bold. Note that Clusters 1, 2, 5, 6, and 8 have a dominant country that was responsible for more than 50% of the trade within the cluster.
To best represent clusters in two-dimensions, the clusters were divided according to those with a dominant trading country (1, 2, 5, 6, 8), and those with several key trading countries (3, 4, 7); essentially a preliminary high-level clustering. Therefore, we have reduced the data from 31 dimensions (one dimension representing the number of that item traded by each of the 16 countries), to two sets of a two-dimensional representation. The ordination in Figure 3A (Clusters 1, 2, 5, 6 and 8) used the Manhattan dissimilarity measure, and has a stress value of 0.054. The ordination in Figure 3B (Clusters 3, 4 and 7), used the Bray-Curtis dissimilarity measure, and has a stress value of 0.082. Both of these stress values are less than 0.1, indicating a good fit. We note that the chosen dissimilarity measure differ in these two cases because the behavior of the rankings of the items within each cluster is different. The key feature of clusters 1, 2, 5, 6 and 8 is that each cluster primarily refers to a single item traded by a single country. As such, the Manhattan dissimilarity measure is a suitable measure because it considers the absolute magnitude – and hence captures this dominating feature well. Conversely the Bray-Curtis dissimilarity measure considers the relative magnitudes, so compares the overall behavior of the trade of the items within each cluster, without focusing on the absolute values.

The Two-Dimensional Ordination, Using Nonmetric Multidimensional Scaling (NMDS). The size of the points corresponds to the number of trades of the item, such that more popular traded items are presented by a larger circle. Worldwide Governance Indicators, and the GDP per capita, are shown when they are statistically significantly correlated with the ordination scores. (a) Clusters 1, 2, 5, 6, 8; (b) Clusters 3, 5, 7.
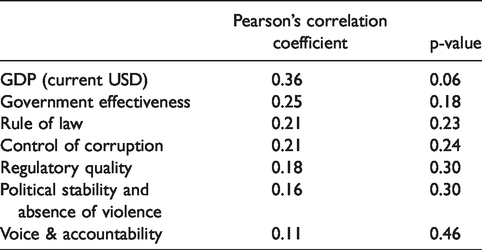
For Clusters 1, 2, 5, 6 and 8, there is a significant correlation between ordination scores and ‘Effective government', ‘Regulatory quality', ‘Rule of law', and ‘Voice and accountability' (Table 3). Although all four measures are statistically significantly correlated, ‘Voice and accountability' has the strongest correlation with the clusters (Figure 3A). As a simple reference, consider that items in Cluster 5 are predominately traded by the Netherlands, which had the highest ‘Voice and accountability' score from countries in our dataset, 1.55. Whereas items in Cluster 1 are predominately traded by China, which had the lowest ‘Voice and accountability' score from countries in our dataset, −1.62. Accounting for all countries, and weighting by the proportion that each country trades each item, the expected ‘Voice and accountability' for Clusters 1, 2, 5, 6 and 8 are −0.49, 1.20, 1.30, 1.06 and 0.99. From low to high scores, the order of Clusters is 1, 8, 6, 2, 5, which is also apparent from Figure 3A. The ‘Political stability and absence of violence' and GDP per capita seem to have no correlation with the clusters of wildlife items traded.
Pearson's Correlation Coefficient and p-Value for Each Worldwide Governance Indicator, and the GDP Per Capita (Factors Are Ordered by Statistical Significance to Clusters 1, 2, 5, 6 and 8).

For Clusters 3, 4 and 7 (Figure 3B), firstly, as a contrast, they are more scattered on the two-dimensional ordination, compared with Figure 3A. Secondly, there is no significant correlation of the ordination axis and Worldwide Governance Indicators (Table 4). However, there is a correlation with the GDP per capita (Pearson's correlation coefficient 0.3630, p = 0.06). Specifically, exotic birds, primates and otters are traded by countries with slighter lower GDP per capita. Accounting for all countries, and weighting by the proportion that each country trades each item, the expected GDP per capita for Clusters 3, 4 and 7 are 2.49, 2.65 and 2.67 trillion US dollars. From low to high expected GDP per capita, the order of Clusters is 3, 4, 7. However, the range of these expected GDP is small considering that the range of the GDP for all countries in the dataset is from 0.03 to 10.48 trillion US dollars. Consequently, it is more challenging to observe the order (3, 4, 7) in the plot shown in Figure 3B.
Pearson's Correlation Coefficient and p-Value for Each Worldwide Governance Indicator, and the GDP Per Capita (Factors Are Ordered by Statistical Significance to Clusters 3, 4, and 7).
Discussion
Going beyond the simple descriptive statistics often presented in wildlife trade reports, we can gain a deeper understanding of the nature of the trade. We analyzed two datasets on wildlife trade, one from 2008 and one from 2014. The more recent dataset is richer, which supports the sentiment that because the body of available wildlife trade data is increasing, the analysis should advance alongside. Our analysis represent an appropriate advancement because the 2008 dataset is rich enough to cluster, but insufficient to perform an ordination, and the 2014 dataset is rich enough for both analyses. Focusing on the 2014 dataset, we discuss insights from the clustering directly, and then discuss insights from further correlations with the global measures. First, we briefly compare how our hierarchical clustering choice compares to other clustering methods.
Hierarchical clustering provides different levels of clustering. The dendrogram is a useful visual tool that can provide information beyond simply the final clustering result. This proved useful here because our clustering initially splits the items into those that are predominately traded by one country, and those that are not – an intuitive split that highlights that current analysis techniques (which focuses on highly traded items by a few countries) captures only half the story. For comparison, we also performed divisive clustering, another hierarchical clustering technique, and k-means, arguably one of the most common clustering algorithms. Divisive clustering does not highlight any intuitive features, and clear clusters are not apparent (see dendrogram in the Supplementary Materials 3). Similarly, k-means struggles to define partitions (see Supplementary Materials 3). For comparison with our analysis here, applying k-means clustering, with a choice of eight clusters (the number of clusters used here), gives cluster sizes 1, 1, 1, 2, 3, 4, 5 and 14. However, these results vary from application to application, since another application gives cluster sizes of 2, 2, 3, 3, 3, 3, 4 and 11. These cluster sizes, and the relative difference in suggested clusters, imply that k-means clustering is not reliable for this dataset. This paper shows that a simple ascendant hierarchical clustering is a good starting place for analysis on future datasets of wildlife trade. Nonetheless, clustering methods are advancing and therefore we do not advocate that ascendant hierarchical clustering is the only method applied on further datasets. For example, a recent paper advances upon k-means clustering to account for outliers and noise variables (Brodinová et al., 2019). As always with analysis of datasets, it is necessary to explore the available tools to find an appropriate choice.
We now discuss the clusters which have a predominant country trading those items (clusters 1, 2, 5, 6 and 8), namely how our clusters correspond to the current knowledge of the trade of these items. We then discuss how the ordination of the clusters identified correlations between the countries which trade these items and global features. From Clusters 1, 2, 5, 6 and 8, familiar patterns emerge, indicating that our clustering approach is capturing known trade behavior. For example, Germany is the main trader of items from Cluster 2, (Turtles and tortoises, Snakes, Giant clams, Stony corals), and the Netherlands being the main trader of items from Cluster 5 (Amphibians, Birds of prey, Lizards, Sharks, Seahorses, Hippopotamuses, Walruses). Germany has an established community of marine fish keepers, and reptile keepers. It is host of one of Europe's largest reptile trade shows, Hamm Terraristik (http://www.terraristikahamm.de), as well as its associated online trading platform (http://terraristik.com/tb/list_classifieds_int.php). Similarly, the Netherlands has an established community of amphibian and reptile keepers, and are host to another major European amphibian and reptile trade show, Terraria-Houten. This is potentially amplified by the Netherlands' close proximity to other nations that are also considerable consumers of reptiles and amphibians such as Germany and Poland. While other products, such as seahorses, may represent their interest in specialist keeping and breeding, and the close proximity to marine fish keeping countries including Germany and Poland.
Items from Cluster 1 (Ivory and suspected ivory, Rhinoceros, Pangolins) are predominately traded by China. However, other countries appear to be significantly involved in the trade (France, the UK, Belgium). This pattern may reflect the historic trading route from African countries to Belgium, France and the UK, particularly for ivory. While Belgium, France and the UK may no longer be significant demand countries, their historic links mean that they now act as transit routes for the trade to China (Somerville, 2016). There are, however, significant sources of antique elephant ivory (Cox, 2017) and rhino horn (Brace & Dean, 2018) that is also being shipped to China. Interestingly, unlike the other high trading countries (Germany, France, the UK, Ukraine and Russia), the trade of China is focused on Cluster 1 items. This makes analysis of wildlife trade in China particularly suited for the commonly used, standard count analysis. However, other high trading countries trade across a diverse range of wildlife items. This is especially true of France, which may be linked with the long history of the keeping of exotic pets and natural history items in France and the UK (Grigson, 2016; Kisling, 2000).
To compare with global measures, we first split the clusters into those whose items were predominately traded by one country (Clusters 1, 2, 5, 6 and 8), and the other clusters where this was not the case (Clusters 3, 4 and 7). This was necessary for a two-dimensional ordination to be suitable, which ensures clear interpretation of results. The clusters whose items are predominately traded by one country are correlated to some Worldwide Governance Indicators (most strongly to ‘Voice and accountability'), but not the GDP per capita. Whereas items that are traded by a range of countries are not correlated to any Worldwide Governance Indicators, but to the GDP per capita. However, this relationship with the GDP per capita was not very strong, with only a small range of expected GDP per capita. Inferences should therefore be limited to the items in clusters 1, 2, 5, 6 and 8. To demonstrate how our clustering and ordination analyses can infer trading activities, consider the United States (US), a country not included in the primary dataset. In 2014 the ‘Voice and accountability' score of the US was 1.1, which places it closest to the expected ‘Voice and accountability' score of Cluster 6 (1.06). We can therefore infer that the US is likely to have traded in Cluster 6 items: owls and elephants (not ivory) in 2014. Expanding the inference, consider that the secondary dataset (IFAW, 2008) stated that the US was responsible for 75% (3921/5223) of the trade of elephant items (see Supplementary Materials 2). This dataset does not separate elephant trade from ivory trade. Moreover, ivory trade was placed in Cluster 1, which had an expected ‘Voice and accountability' score of -0.49, considerably different to that of the US. Combining our analyses with the secondary dataset, suggests that a least a significant proportion of the 3921 elephant items traded by the US were not ivory (assuming similar trading pattern in 2008 and 2014) as compared to other countries. Moreover, to monitor the trade of elephant items, it is worthwhile separating these items into at least ivory and non-ivory elephant items.
We used the Worldwide Governance Indicators as they are aggregate measures that provide general information about differences between nations (Langbein & Knack, 2010). However, whether they are in fact reflective measures, and independent from each other, has been the topic of much discussion (Knack & Manning, 2000; Oman, 2006; Van de Walle, 2006; Brewer et al., 2007; Johnston, 2007; Knack, 2007). Our analysis suggests, at least, that ‘Political stability and absence of violence' is unrelated to the other indicators, since the p-value for this indicator was much larger than the corresponding p-values for the other five indicators.
Beyond specific analyses is the fact that valuable, hard to obtain, datasets on the wildlife trade have the potential to provide deeper insights into the trade. Studying online trade is currently resource-intensive in terms of data collection (Hernandez-Castro & Roberts, 2015). It is therefore important that we maximize the use of such data beyond counting, whether for research or law enforcement. We do not advocate the analysis of data for the sake of it. In fact, our work suggests that in some circumstances focusing on the most traded items within each country may be justified, as in the case of China. However some large traders, such as France, trade a diverse range of items, and thus simple counts of items traded is not illuminating. Clustering and ordination analyses allow us to capture patterns of global trade, and visually represent them in an easily interpretable fashion. As more data is gathered, global patterns will emerge, and the inferences from the analyses will be more versatile. For example, when inferring which items were traded by countries excluded from the dataset, we were limited to the items in Clusters 1, 2, 5, 6 and 8. However, for larger datasets, and different global measures, correlations may be stronger and consistent across all clusters in a manner that allows the whole dataset to be represented in two-dimensions.
The success of ordination on one dataset, and fail on another, demonstrates current challenges in wildlife trade data. Nonetheless, as with all fields, wildlife trade data is becoming more readily available. Therefore, as wildlife item trade data becomes more abundant, it will be interesting to perform clustering and ordination analyses on these future datasets. We could not compare the clustering results from both datasets due to different classifications. This demonstrates a need for organizations to discuss standardizing data collection. Such an initiative would allow a greater understanding of trade patterns across multiple countries and multiple species. This, however, is not a simple task compared to pooling from, for example, camera trap images, as online data comes with a number of challenges, including contract law, copyright, privacy. An additional challenge within this space is the lack of funding for tackling cyber-enabled wildlife trafficking. This is like due to the nebulous nature of online trade and the fact that much of the money available to tackle the illegal wildlife trade is from government aid budgets that have a requirement to tackle poverty alleviation. Further, the countries that are eligible for such aid do not have significant online trade (particular exceptions being Indonesia and Vietnam), and that articulating the links between online trade and poverty alleviation is challenging. Until these are overcome it is unlikely we will see efforts to pool data other than within organizations. However, organizations should consider engaging with statisticians before, during and after data collection (Moshier et al., 2019).
Implications for Conservation
Here we call for a move beyond simple descriptive statistics, as often presented in reports, to bring a deeper understanding of the illegal wildlife trade. While many of the reports on cyber-enabled wildlife trade are often produced with a specific audience or role in mind, provision of more detailed methods, such as a separate online appendix to a report, would aid in understanding how the data were collected, and the potential biases that may exist. Access to the data beyond that which is published in the reports would aid the potential for deeper analyses. While access may be on a case-by-case basis, providing specific contact points and pre-prepared data files for potential requests, would aid in this process.
Supplemental Material
sj-zip-1-trc-10.1177_1940082920958401 - Supplemental material for Moving Beyond Simple Descriptive Statistics in the Analysis of Online Wildlife Trade: An Example From Clustering and Ordination
Supplemental material, sj-zip-1-trc-10.1177_1940082920958401 for Moving Beyond Simple Descriptive Statistics in the Analysis of Online Wildlife Trade: An Example From Clustering and Ordination by Tamsin E. Lee and David L. Roberts in Tropical Conservation Science
Supplemental Material
sj-pdf-2-trc-10.1177_1940082920958401 - Supplemental material for Moving Beyond Simple Descriptive Statistics in the Analysis of Online Wildlife Trade: An Example From Clustering and Ordination
Supplemental material, sj-pdf-2-trc-10.1177_1940082920958401 for Moving Beyond Simple Descriptive Statistics in the Analysis of Online Wildlife Trade: An Example From Clustering and Ordination by Tamsin E. Lee and David L. Roberts in Tropical Conservation Science
Supplemental Material
sj-pdf-3-trc-10.1177_1940082920958401 - Supplemental material for Moving Beyond Simple Descriptive Statistics in the Analysis of Online Wildlife Trade: An Example From Clustering and Ordination
Supplemental material, sj-pdf-3-trc-10.1177_1940082920958401 for Moving Beyond Simple Descriptive Statistics in the Analysis of Online Wildlife Trade: An Example From Clustering and Ordination by Tamsin E. Lee and David L. Roberts in Tropical Conservation Science
Footnotes
Declaration of Conflicting Interests
The author(s) declared no potential conflicts of interest with respect to the research, authorship, and/or publication of this article.
Funding
The author(s) disclosed receipt of the following financial support for the research, authorship, and/or publication of this article: D. L. R. received funding from the Oxford Martin School’s Programme on Illegal Wildlife Trade.
Supplemental Material
Supplemental material for this article is available online.
References
Supplementary Material
Please find the following supplemental material available below.
For Open Access articles published under a Creative Commons License, all supplemental material carries the same license as the article it is associated with.
For non-Open Access articles published, all supplemental material carries a non-exclusive license, and permission requests for re-use of supplemental material or any part of supplemental material shall be sent directly to the copyright owner as specified in the copyright notice associated with the article.