
Abstract
Introduction
Eco-friendly textile finishing has recently become an alternative to conventional treatments. This imparts both coloration and antimicrobial properties to cotton, which is highly susceptible to microbial attack.
Objective
This study aimed to assess the coloring potential and antibacterial activity of cotton fabric treated with A. nilotica algae methanolic extracts cross-linked with chitosan.
Method
A.nilotica algae was collected, dried, and methanol-extracted. Quantitative phytochemical screening tests were performed, followed by characterization using fourier transform infrared spectroscopy (FTIR), gas chromatography mass spectrometry (GC-MS), and thermogravimetric analysis (TGA). Chitosan was applied to cotton fabric through the pad-dry-cure method as a cross-linker to impart a cationic bio-mordant, followed by treatment with the extract.
Results
The optimized result for the extract yield achieved was 39.46%. Its anti-bacterial activity was assessed qualitatively with a zone of inhibition method for both chitosan-treated cotton fabric with a value of 8 mm S. aureus and 6 mm E. coli, and chitosan/extract-treated cotton fabric with a value of 11, 17, and 18 mm for E. coli and 15, 20, and 21 mm for S. aureus. The physical properties of the treated and untreated cotton fabrics, with respect to air permeability and tensile strength, were also evaluated. There was a little reduction in elongation, decreasing from 19.1% to 18.7,17.4 and 12.1% in the warp direction and from 14.5% to 13.2 11 and 10.5% in the weft direction.
Conclusion
The results of this study suggest that A. nilotica algae extract, a low-cost and abundant source, can effectively be used for coloring and antibacterial treatments. Consequently, it presents a promising, affordable, and efficient alternative for textile finishing.
Introduction
Textile finishing is the application of active agents onto a fabric to improve the look and quality of the fabric by changing its appearance.1,2 The purpose is to make textiles more flexible during their end-use, such as coloring and anti-microbial effects. 3 There may be a basic or a functional finish based on the intended application. The basic finish includes preparatory finishing (such as de-sizing, scouring, bleaching and mercerization) and aesthetic finishes (such as calendaring, embossing, glazing, etc,). 4 Functional finishes are applied to improve the performance and utility of the fabric, including anti-static, wrinkle-resistant, 5 flame-retardant, 6 water-repellent, 7 antimicrobial, 8 antifungal and UV-protective finish. 9 Microorganisms capable of degrading textiles are found everywhere. This leads researchers to develop antimicrobial textiles for the prevention of healthcare-associated infections. Typically, focused on pathogenic bacteria found on textiles such as Escherichia coli and Staphylococcus aureus. 10 People are aware of pathogenic bacteria, which has led to the growing popularity of textiles treated with antibacterial agents, not just to prevent fabric deterioration, but to actively protect the wearer from bacterial contamination, combining personal health protection with enhanced fabric durability and hygiene in everyday use. 11 For instance, Yılmaz, F.12,13 used industrial waste from tea and tobacco to make antibacterial cotton fabric. Numerous antimicrobial compounds, which fall into two categories natural and synthetic are employed as textile finishes. The use of natural antimicrobial agents in medical and healthcare textiles has grown significantly because of their advantages over synthetic ones, including being safe, non-toxic, skin-friendly, and environmentally friendly. 14
In early human history, natural dyes were utilized for dyeing leather, food, plastics, and natural fibers like cotton, silk, and wool as these have complete shades, level dyeing, and lustrous. Nowadays, one of the most promising fields of new textile materials is the manufacturing of antimicrobial medical textiles. 15 The antibacterial properties of several secondary metabolites, including terpenoids, alkaloids, and phenolic chemicals, are present in plants. 16 Roots, leaves, petals, and seeds are among the plant parts from which extracts have antimicrobial qualities. 17 For instance, a study found that aloe vera and turmeric are natural antibacterial plants with numerous components that work best on textiles. 18 These antioxidants are applied in different methods, such as direct and microencapsulation techniques. 19 Another plant-based source reported is the Achillea millefolium plant, which was used to dye woollen textiles, and the resulting textiles have antibacterial properties against two distinct bacterial species, E. coli (ATCC 25922) and S. aureus (ATCC 29213). In particular, a very high value of 99.99% was obtained against Staphylococcus aureus germs in the dyeing experiment without the use of a mordant.20,21 Algal extracts with high potential as food preservatives and their capacity to suppress microorganisms in a variety of meat items were used to inhibit pathogenic bacteria. 22 Natural dye was extracted from the brown alga S. polycystum using a microwave-assisted extraction method to dye wool fabric. The results show that dyeing of wool fabric processed under optimal conditions showed strong anti-bacterial and anti-fungal activity and good colour-fastness properties. 23
Animal-based ingredients like chitosan, sericin, lanolin, and casein were used to provide eco-friendly textile finishing, according to previous studies.24,25 Cotton fabrics loaded with amino trimethylene phosphonic acid chitosan (ATMP-CS) were prepared through a padding-drying-curing process. The coating exhibited excellent film-forming properties, and it imparted a uniform protective layer onto the surfaces of the cotton fabrics. When the load capacity reached 11.5%, the coated fabrics achieved a limiting oxygen index of 29.7% and successfully passed the vertical flame test (VFT). 26 For the production of multipurpose cotton fabric with antibacterial and UV-protective qualities, bio-based resources are crucial. In order to improve hydrophobicity and UV protection without compromising mechanical characteristics, viscose fibers were coated with a long-lasting lanolin/silicone. Natural solutions provide sustainable, environmentally safe alternatives for antimicrobial textile treatment. 27 This has opened up new avenues in the field of textile finishing. 28 Although there are many natural sources rich in antimicrobial agents, the study on their use in textiles is very limited and not documented. 29 The major challenges in the application of natural sources for textile application are majority of the sources are complex mixtures of several compounds and also the composition varies in different species of the same plant. 30 However, because of their eco-friendly nature and non-toxic properties, they are still considered a novel means of niche applications such as medicine and healthcare since natural dyes are safe, healthy, and environmentally beneficial in contrast to synthetic dyes.
Despite the growing preference for natural dyes as safe and eco-friendly alternatives to synthetic ones, few studies have explored combining natural colorants with functional properties using natural cross-linking agents. This study aimed to assess the coloring potential and antibacterial activity of cotton fabric treated with A. nilotica algae methanolic extracts by cross-linking the fabric with chitosan for the first time. Optimization for the application process using Box-Behnken Design (BBD) was done. The antibacterial performance was then evaluated for both chitosan-treated cotton and cotton treated with the combined chitosan and algae extract, demonstrating the functional enhancement achieved through this sustainable finishing approach. The outcomes contribute to the development of eco-friendly, functional textiles with practical antibacterial applications.
Materials and Methods
Experimental Materials and Apparatus
The fabric and the extract were crosslinked with citric acid (99.8% pure), whereas acetic acid (99.5% pure) was used to dissolve chitosan, which is used as a cationic mordanting. Chitosan, derived from fish scales, with a molecular weight of 125,707, a degree of deacetylation of 90.2%, and nitrogen content of 6.9%, was extracted from fish scales and used in this study. The process for extracting chemical components from the A. nilotica algae extract was followed in the preparation of methanol (CH3OH, 99% purity). To guarantee thorough wetting and consistent absorbency of the solution throughout the pad-dry-curing procedures, this study used 100% bleached plain cotton fabric with a specification of count (Ne) is 30 s, with 60 ends per inch (EPI) and 60 picks per inch (PPI). The weight is 145 g/m², and its thickness is 0.1 cm. Ultrasonic extractor, electronic balance, oven dryer, Whatman filter paper No. 1, pH meter, condenser, crucible, fourier transform infrared spectroscopy (FTIR), thermogravimetric analyzer (TGA), and padding mangle were utilized in this investigation.
Preparation of the Sample
The algae were collected from Hawassa, Fiker Haik, Ethiopia, and washed with tap water, rinsed with distilled water, cleaned, sun-dried, and cut into small pieces for further size reduction into fine powder. The resulting powder was passed through a 250μm sieve mesh. The major chemical ingredients of A. nilotica algae extract include phenolic acid, anthocyanin tannin, and flavonoids. 31
Factor Selection for the Extraction Processes
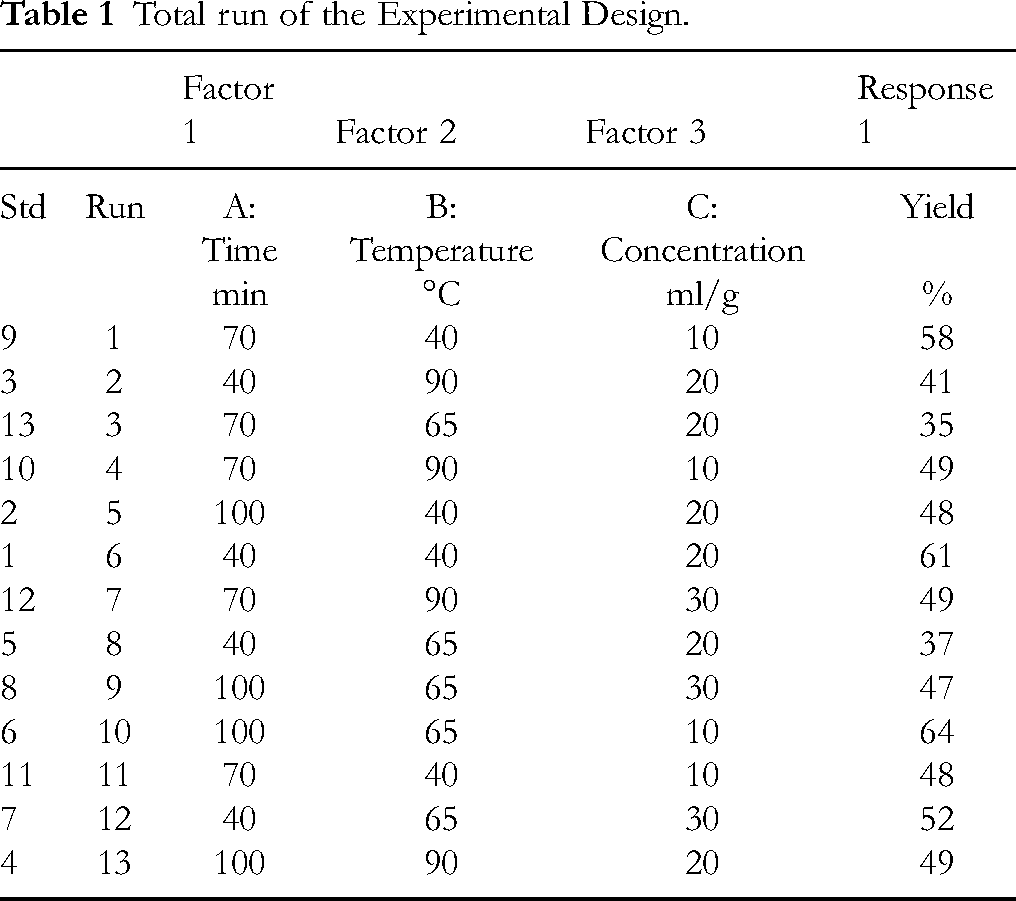
Important phytochemicals were extracted, and the number of trials was designed and generated using Box-Behnken Design (BBD), design expert stat-ease® 360 software with an experimental plan having three variables. These variables include extraction time, temperature and concentration, with the factor set in the range of 40–100 min, temperature of 40 °C-90 °C and concentration of 10-30 ml/g, respectively. The extraction condition was adapted from Moges, G., et al 22 with some modifications. The results for the experimental run are summarized in Table 1. The extracted active agents were applied using the pad-dry-cure method to the cotton fabric with a material to liqueur ratio (MLR) of 1:20. It was dried at 80˚C for 30 min and cured at 130˚C for 3 min.
Total run of the Experimental Design.
Ultrasonic-Assisted Extraction Method
The ultrasonic-assisted extraction method is a straightforward, economical, and successful technique for extracting phytochemical components.
32
The extracts were obtained using a Hielscher UP400St system (400 W, 24 kHz) under optimized sonication parameters with power and frequency of 400 W, 24 kHz. It is appropriate for large-scale industrial applications due to its minimal organic solvent consumption, quick extraction times, and good dependability in a variety of organic solvents.
33
In this research, 400 ml of 99% methanol and 20 grams of sun-dried A. nilotica algae powder were combined, and the mixture was extracted ultrasonically as per the experimental set shown in Figure 1. Then, after passing the extract through Whatman No. 1 filter paper, the methanol was concentrated using a rotary evaporator at reduced pressure. For later use, the concentrated extract was kept in a refrigerator in airtight glass bottles. The percentage yield of the extraction was calculated using the following formula.

Experimental set-up of ultrasonic-assisted extraction processes.
Determination of Total Phenolic Content (TPC)
The total phenolic content in A. Nilotica Algae Extracts was determined using the Folin Ciocalteu reagent method following the Belew, A.A., et al
34
with slight modification. The calibration curve was prepared by using 100 ppm gallic acid stock solution was prepared by dissolving 10 mg of gallic acid (Sigma-Aldrich) in a few drops of 97% methanol within a 100 mL volumetric flask, followed by dilution to the mark with methanol. A 50 ppm intermediate standard was then prepared via dilution of the stock. Serial dilutions yielded six calibration standards (2, 4, 6, 8, 10, and 12 mg/L) in methanol. Then, for each standard, 1.0 mL was transferred to a 25 mL volumetric flask, combined with 5 mL of Folin-Ciocalteu reagent (pre-diluted 1:10 with ultrapure water), and mixed. A methanol blank (1.0 ml) was prepared identically, omitting gallic acid. After 2 min, 4 ml of 7.5% (w/v) sodium carbonate solution was added to all flasks. Samples were incubated for 2hr at 24 °C-26 °C to allow full chromogenic development. Absorbance was measured at 765 nm using a UV-Vis spectrophotometer. Total phenolic content was calculated using a dilution factor of 15 using the following formula.
Where, C = concentration of phenolics from calibration curve (mg GAE/g), V = volume of extract used (mL), D = dilution factor, and M = mass of sample (g)
Determination of Total Flavonoid Content
Total flavonoid content was determined using the Al (III) chloride colourimetric method.
35
Typically, 0.5 mL of algae extract was diluted with methanol (1:10) and mixed in a test tube with 0.1 mL of 10% aluminium nitrate and 0.1 ml of 1 M aqueous potassium acetate, followed by 4.3 ml of methanol. After incubating for 40 min at room temperature, the absorbance of the reaction mixture was measured at 510 nm. Quercetin standards (2, 4, 6, 8, 10, and 12 mg/L) were used to prepare the calibration curve. To determine flavonoid concentration, a dilution factor (df) of 10 was applied, and results were expressed as milligrams of quercetin equivalents (mg QE/100 g). All measurements were performed in triplicate (n = 3).
Where C = concentration of flavonoid from the standard curve (mg/mL), V = volume of extract (mL), DF = dilution factor (if the sample was diluted before measurement), M = mass of the sample used (g)
Characterization
Fourier transform infrared was carried out using a Nicolet iS20 FTIR (Thermo Fisher Scientific) with a spectral range of 4000-500 cm−¹ (experimentally validated). It is a powerful technique used to identify functional groups in molecules by analyzing the wavelengths of light absorbed. By interpreting the infrared absorption spectrum, the chemical bonds within a compound can be determined, providing insight into its molecular structure. A TA Instruments TGA 5500 system was used to conduct thermal gravimetric analysis. To assess thermal stability, samples (10 mg) in alumina crucibles were heated from 0 °C-900 °C at 15 °C/min while being supplied with 50 mL/min of nitrogen. The device's platinum crucibles and 0.1μg resolution allowed for accurate tracking of decomposition events, and TRIOS software examined mass loss trends typical of the constituents of the A. nilotica extract in an inert environment. Further, gas chromatography-mass spectrometry (GC-MS) has been used to identify the important functional groups and phytochemical constituents.
Application Procedure
The pad-dry-cure method was used for 100% bleached cotton fabric with a dimension of 20 × 30 cm. First, 2% (w/v) chitosan was dissolved in water with the gradual addition of 1% acetic acid, stirred and allowed to form a clear viscous solution at 50 °C to prepare a chitosan solution at a pH of 5 for cationization purposes. Subsequently, 4.5% citric acid was incorporated as a cross-linking agent to facilitate covalent bonding between chitosan, the cotton hydroxyl groups, and bioactive compounds from the plant extract during thermal curing, ensuring durable fixation of the functional finish to achieve an 80% wet pickup with a corresponding nip pressure of the laboratory padder 1.6 bar. To remove solvents and form a covalent bond, the fabric was dried for 3 min at 100 °C and then cured for 2 min at 150 °C. The treatment condition was taken from36,37 with slight modification. After preparing extract solutions at concentrations of 10% v/v, 15% v/v, and 20% v/v from the optimized yield of 18 mL/g methanolic extract, the chitosan-treated fabric was padded in a laboratory padder with a material-to-liquor ratio of 1:20 at the same pressure of chitosan treatment. Then, it was dried for 3 min at 80˚C and cured for 2 min at 130˚C. Finally, rinsed with cold water to get rid of any unbound extract. A schematic diagram of the application procedure is shown in Figure 2.

A schematic diagram of the treatment process.
Testing and Evaluating
Antibacterial Test
The antibacterial test was conducted using a qualitative agar diffusion plate test using the AATCC standard test method 100:2004 to evaluate the effectiveness of antimicrobial agents against both Gram-positive bacteria (S. aureus) and Gram-negative bacteria (E. coli). 38 The effectiveness was evaluated by measuring the zone of inhibition of bacterial growth, offering a clear and reliable indication of the fabric's antimicrobial properties and its ability to prevent bacterial proliferation. Tryptic Soy Agar (TSA) for bacterial growth has been used. The bacteriostatic agar medium was made by mixing dried agar powder with distilled water, heating the mixture to a boil, and autoclaving it for 15 min at 121 °C. After autoclaving, the agar was cooled to 45-50 °C and then put into sterile Petri dishes. Using a sterile inoculating spreader, the agar was then allowed to solidify at room temperature until the depth reached 2 mm. To inoculate the agar plate, a 24-h culture of the test bacteria was made. The agar plates were then incubated at 37 °C for 24 h larger zone of inhibition suggested increased bacterial inhibition efficacy. 39
Air Permeability and Tensile Strength Tests
The FX 3300 air permeability tester, under ASTM D737-96, was employed to assess the fabric's breathability. This test is crucial in evaluating comfort, as it depends on factors like the fabric's porosity, yarn specifications, and thickness. The tensile strength test, conducted according to ISO 13934/2 guidelines, was used to assess the fabric's strength and flexibility after the chitosan and extract treatment. This test offers insights into how the treatment with algae extract impacts the fabric's mechanical properties, specifically its tensile strength and elongation. 40 Together, these tests provide a comprehensive evaluation of the fabric's properties after antimicrobial treatment.
Results
Ultrasonic-Assisted Extraction Yield
In determining the yield in the regression equation, only the coefficients of significant factors are included. The quadratic model of three factors is given by the following formula to determine the effect of main factors and their interaction effect on the response.
In this equation, Y is the predicted response, and A, B, and C are the values of the independent variables, time, temperature, and concentration, respectively.
Fit Statistics
The predicted R² of 0.95 is very close to the adjusted R² of 0.981, showing the model predicts yield reliably. This alignment indicates a strong diffusion-to-noise ratio above 0.2, suggesting minimal unexplained variation. Furthermore, the model's adequate precision, reflecting the signal-to-noise ratio, exceeds the acceptable threshold of 4, confirming the model's ability to distinguish meaningful factor effects from random noise. Overall, these statistics demonstrate that the regression model is both robust and statistically reliable for predicting yield under varying conditions of time, temperature, and concentration.
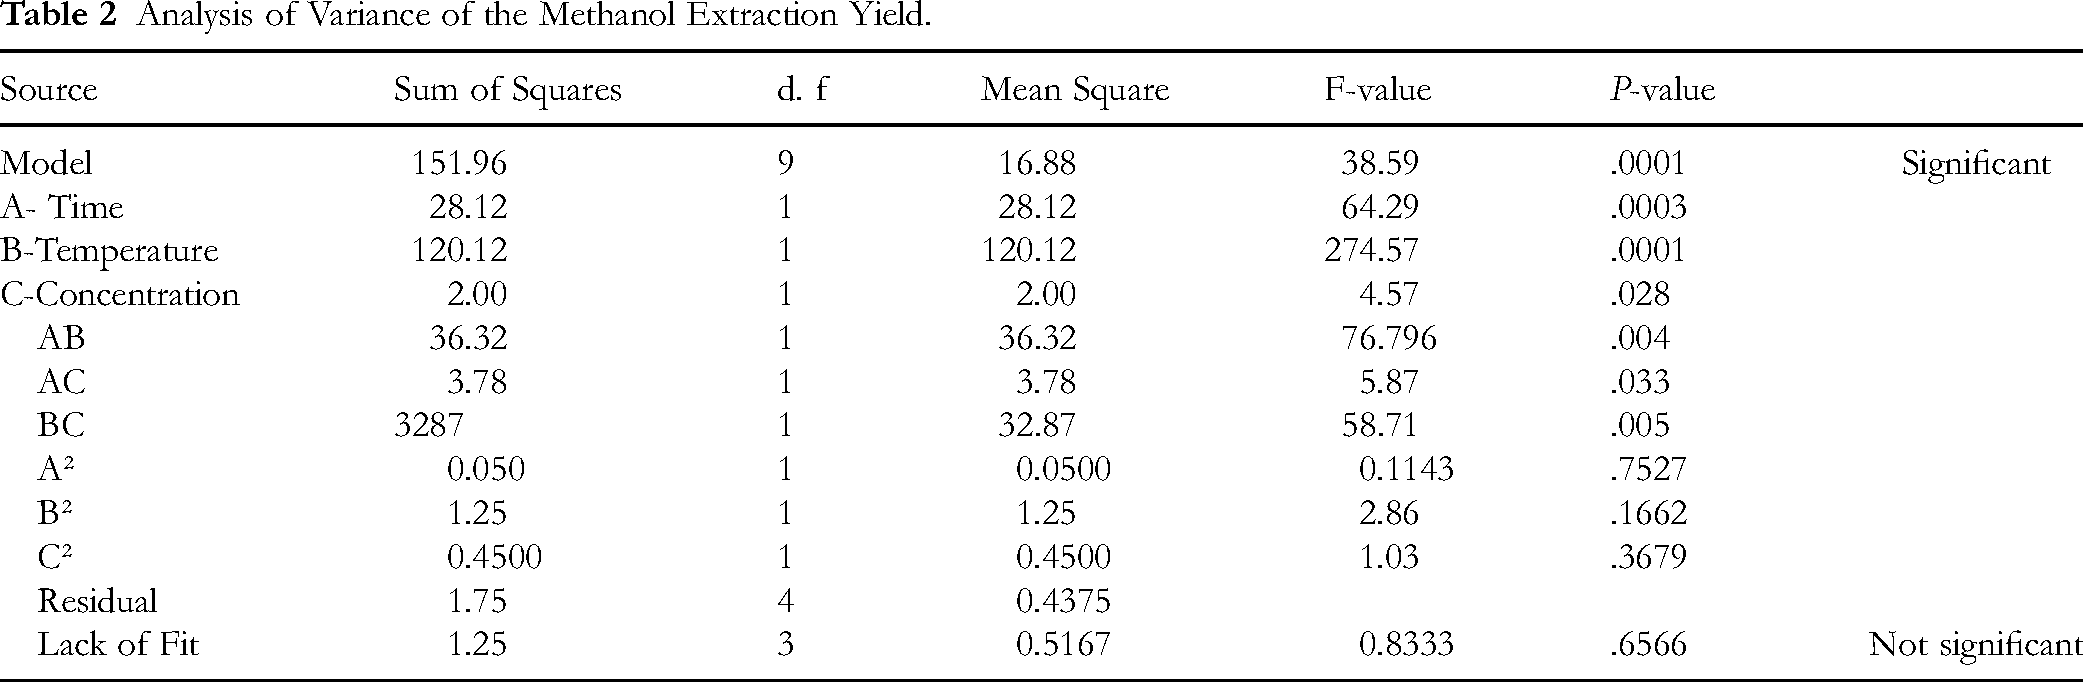
ANOVA
The analysis of variance assessed the effects of time, temperature, and concentration on extraction yield, as shown in Table 2. P-values below .05 indicate significant contributions, while values above 0.05 are considered not significant. Results show that time and temperature strongly influence yield, with concentration having a smaller but meaningful effect. Interactions between factors (AB, AC, BC) are significant, enhancing or reducing yield depending on combinations. Quadratic terms are not significant, and the lack-of-fit test confirms the model fits the data well.
Analysis of Variance of the Methanol Extraction Yield.
Three-Dimensional and Contour Plot Graphs
The interaction effects AB, AC, and BC indicate how combinations of factors influence the extraction yield beyond their individual contributions. AB (Figure 3a) shows a significantly positive effect, meaning that increasing both time and temperature together enhances yield more than either factor alone. AC (Figure 3b) has a significantly negative effect, suggesting that higher time combined with higher concentration reduces yield, possibly due to over-extraction or degradation. BC (Figure 3c) is positive and significant, indicating that increasing both temperature and concentration simultaneously can improve yield. These interactions highlight the importance of optimizing factor combinations, not just individual levels, for maximal extraction efficiency. A more curved contour plot indicates in (Figure 3d) a stronger interaction or nonlinear effect between factors, showing that small changes in variables produce larger or accelerating changes in the response.

Correlation between the 3D surface of the interaction effect of factors (
Optimization
The optimum extraction conditions were determined using the desirability function, which balances multiple goals. The objective was to minimize extraction time, temperature, and solvent concentration while simultaneously maximizing methanol extraction yield, as summarized in Table 3. The optimization process evaluated different combinations of factors to identify conditions that produce the highest yield according to the selected criteria. Following this process, the optimal extract concentration for subsequent fabric treatment was established at 18 ml/g. This concentration ensures efficient extraction while maintaining quality, providing a practical and effective condition for the extraction process and its application in fabric treatment.
Solution Found for the Optimization Process.

Characterization of Plant Extract
Quantitative Analysis of Total Phenol and Flavonoid Contents
The total phenol and flavonoid content were determined using the two reagents. A standard gallic acid solution had to be made to perform quantitative phytochemical analysis for the determination of total phenolic content. The extracted A. nilotica algae total phenolic content was obtained with a value of 26.72 ± 0.153 mg GAE/g dry weight. The aluminium chloride colorimetric assay method was used to assess the A. nilotica algae extract's total flavonoid concentration for precise quantification. The value was 3.656 ± 0.31 mg GAE/g dry weight.
Fourier Transform Infrared Spectroscopy (FTIR)
It is one of the qualitative techniques for determining potential functional biomolecules present in the plant extract, are shown in Figure 4. The maximum wavenumber observed in the A. nilotica methanol extract revealed peaks at 3600 cm−¹, signifying the presence and stretching of strong O-H bonding in carboxyl, alcohols, and phenol groups. At 2500 cm−¹ there is O–H stretching whereas the peak 921 cm−¹, a bending vibration of O-H groups is detected. The peak at 2700 cm−¹ indicates the -CH vibration of aliphatic groups (possibly aldehydes or other organic compounds), while the 2200 cm−¹ peak corresponds to the bonds of C≡C in the stretch. Additionally, the 1700cm−¹ peak represents C = O groups from conjugated aromatic rings. The peak at 1250cm−¹ is a single bond found between C-O-C ether linkages. Overall, the IR spectrum shows a variety of organic functional groups, indicating the presence of phytochemicals such as alkaloids, polysaccharides, phenolics, or flavonoids in the algal extract.
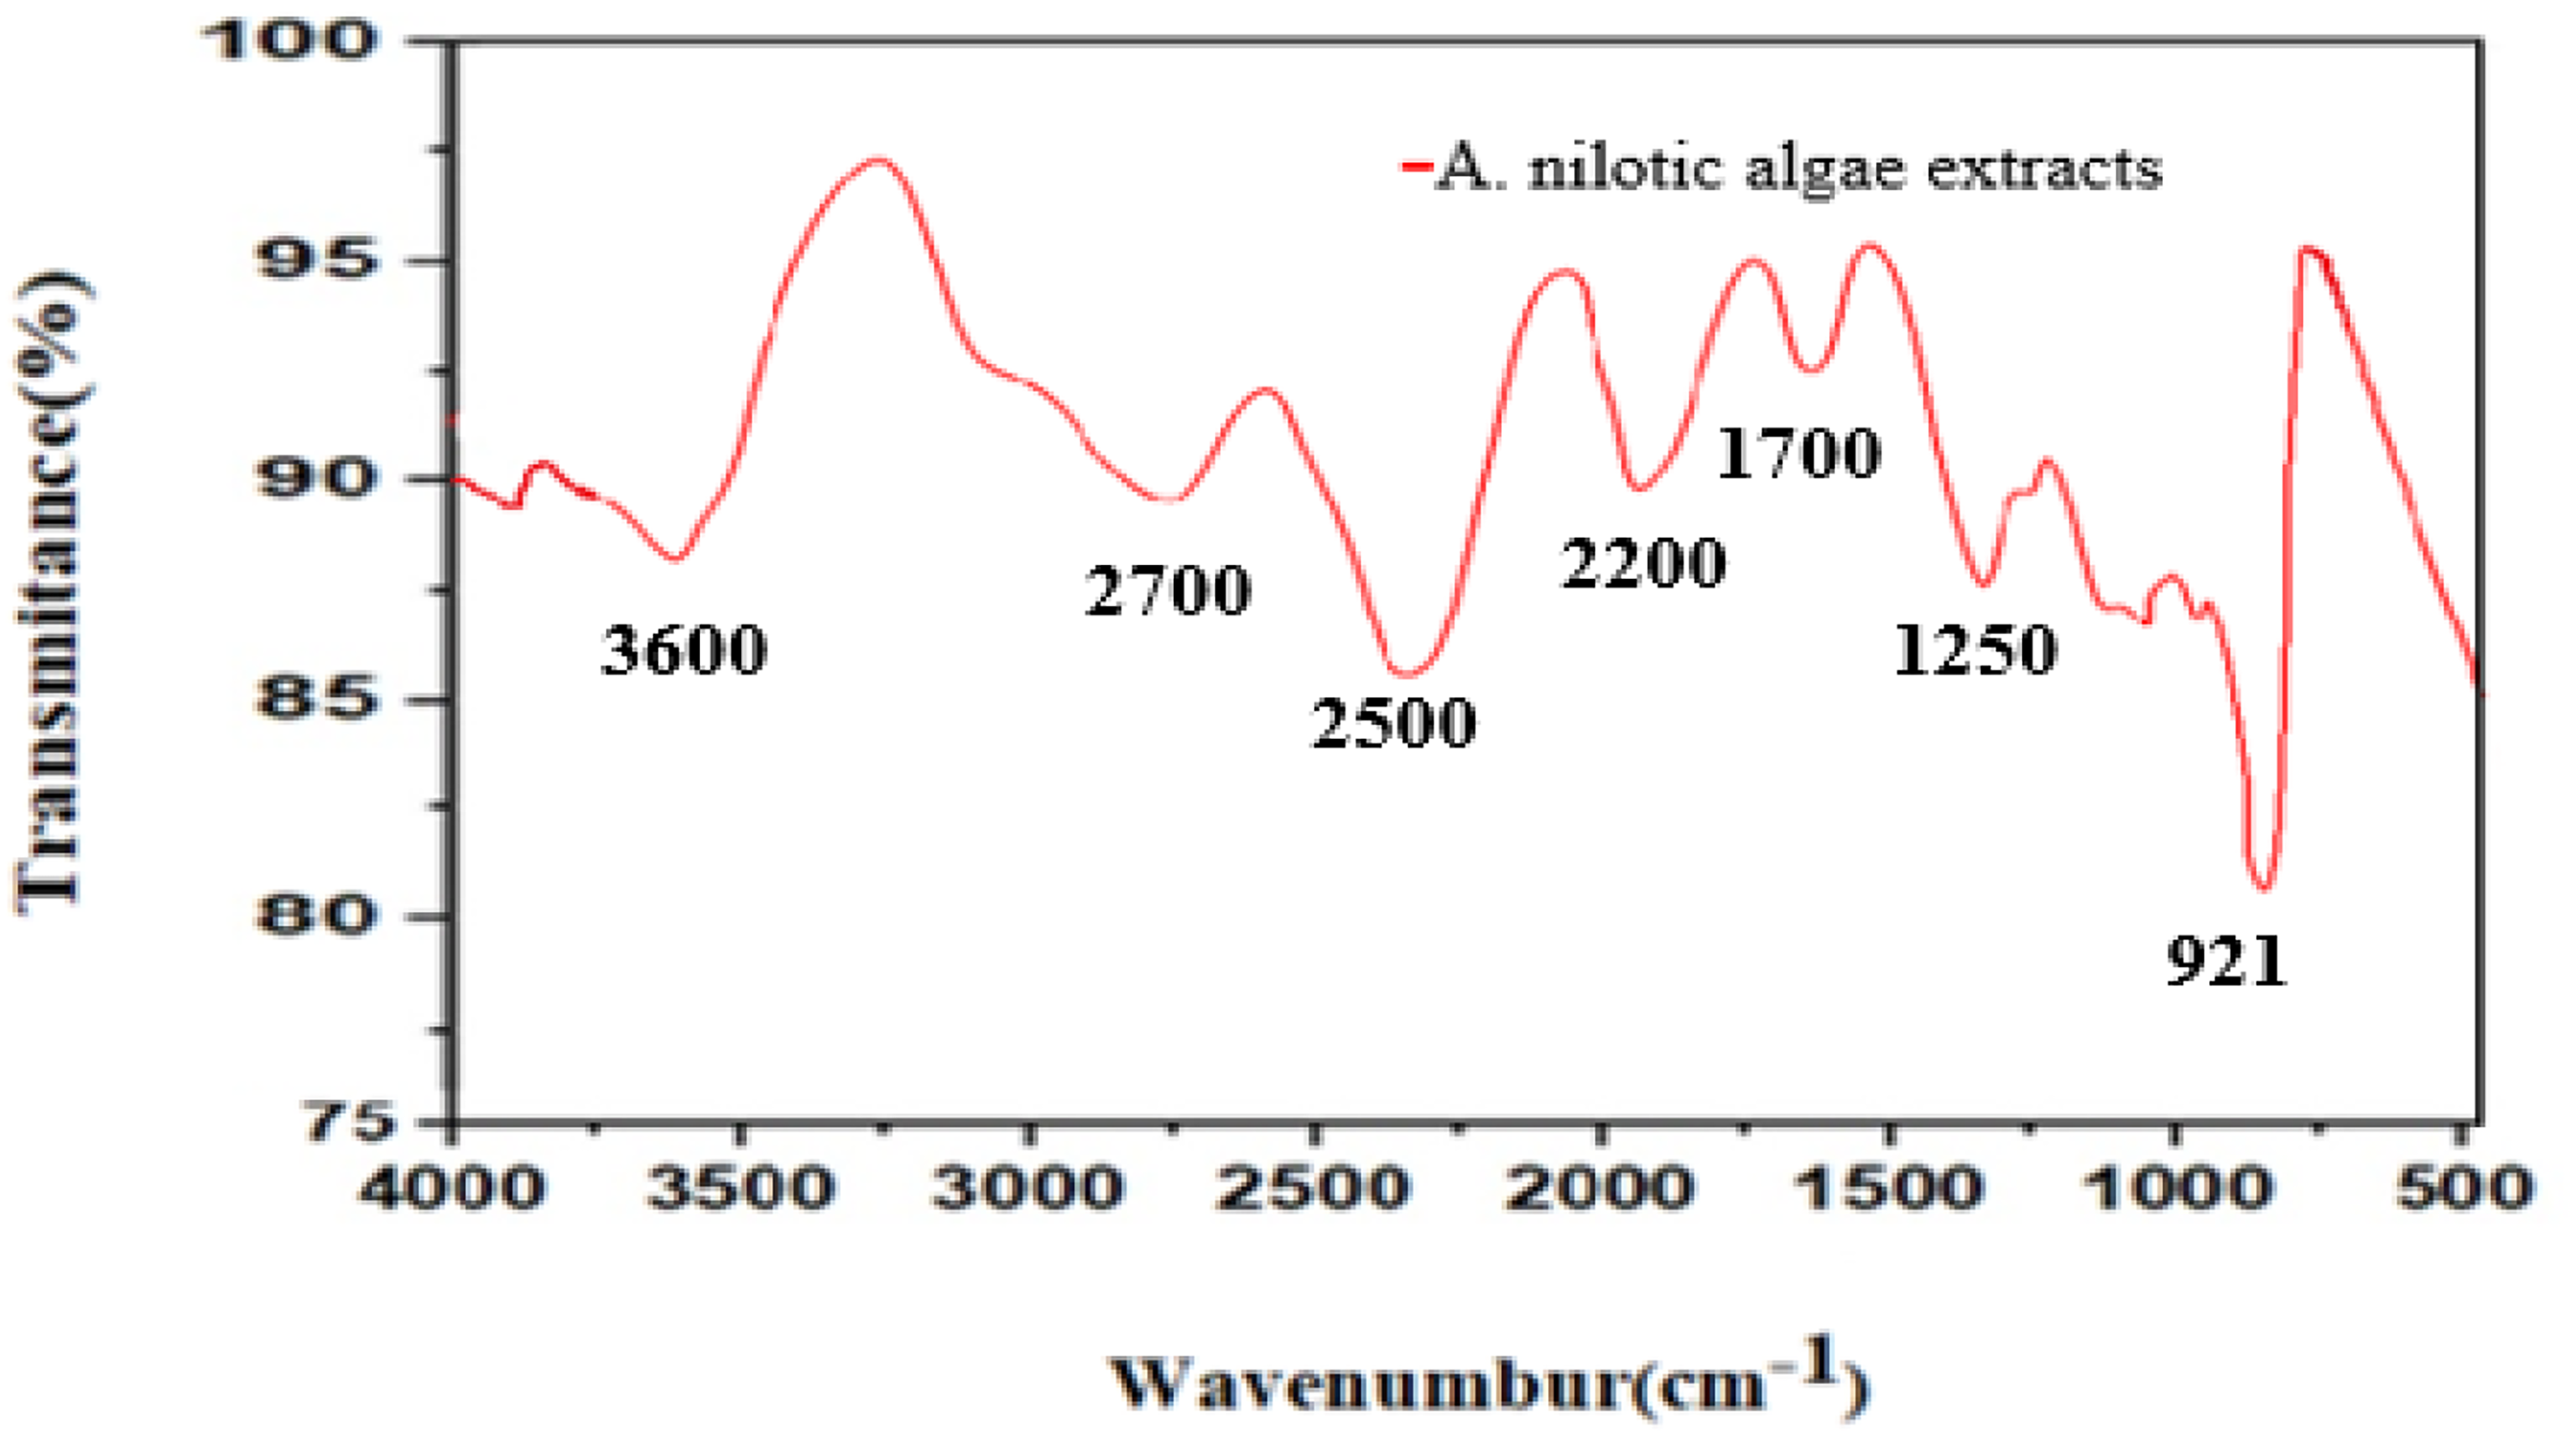
Fourier transform infrared spectroscopy (FTIR) of the methanol extract of A. nilotica.
Thermogravimetric Analysis (TGA)
The Thermogravimetric Analysis (TGA) front shows the crude A. nilotica algae extract small weight loss (10%) between 0 °C-200 °C, which is due to the evaporation of the humidity of the materials or volatile compounds. Between 200 °C-460 °C, the degradation or decomposition of aliphatic phenolic compounds is evident, and there is about 30% weight loss. The final stage of char formation occurs between 460 °C and 890 °C, suggesting that the extract contains heat-resistant components that can form char under elevated temperatures. The results suggest that antibacterial treatments for fabrics may need to be applied at elevated temperatures to be effective. The thermal analysis of A. nilotica algae extract, revealing its thermal stability and decomposition behavior under controlled heating conditions, is shown in Figure 5.
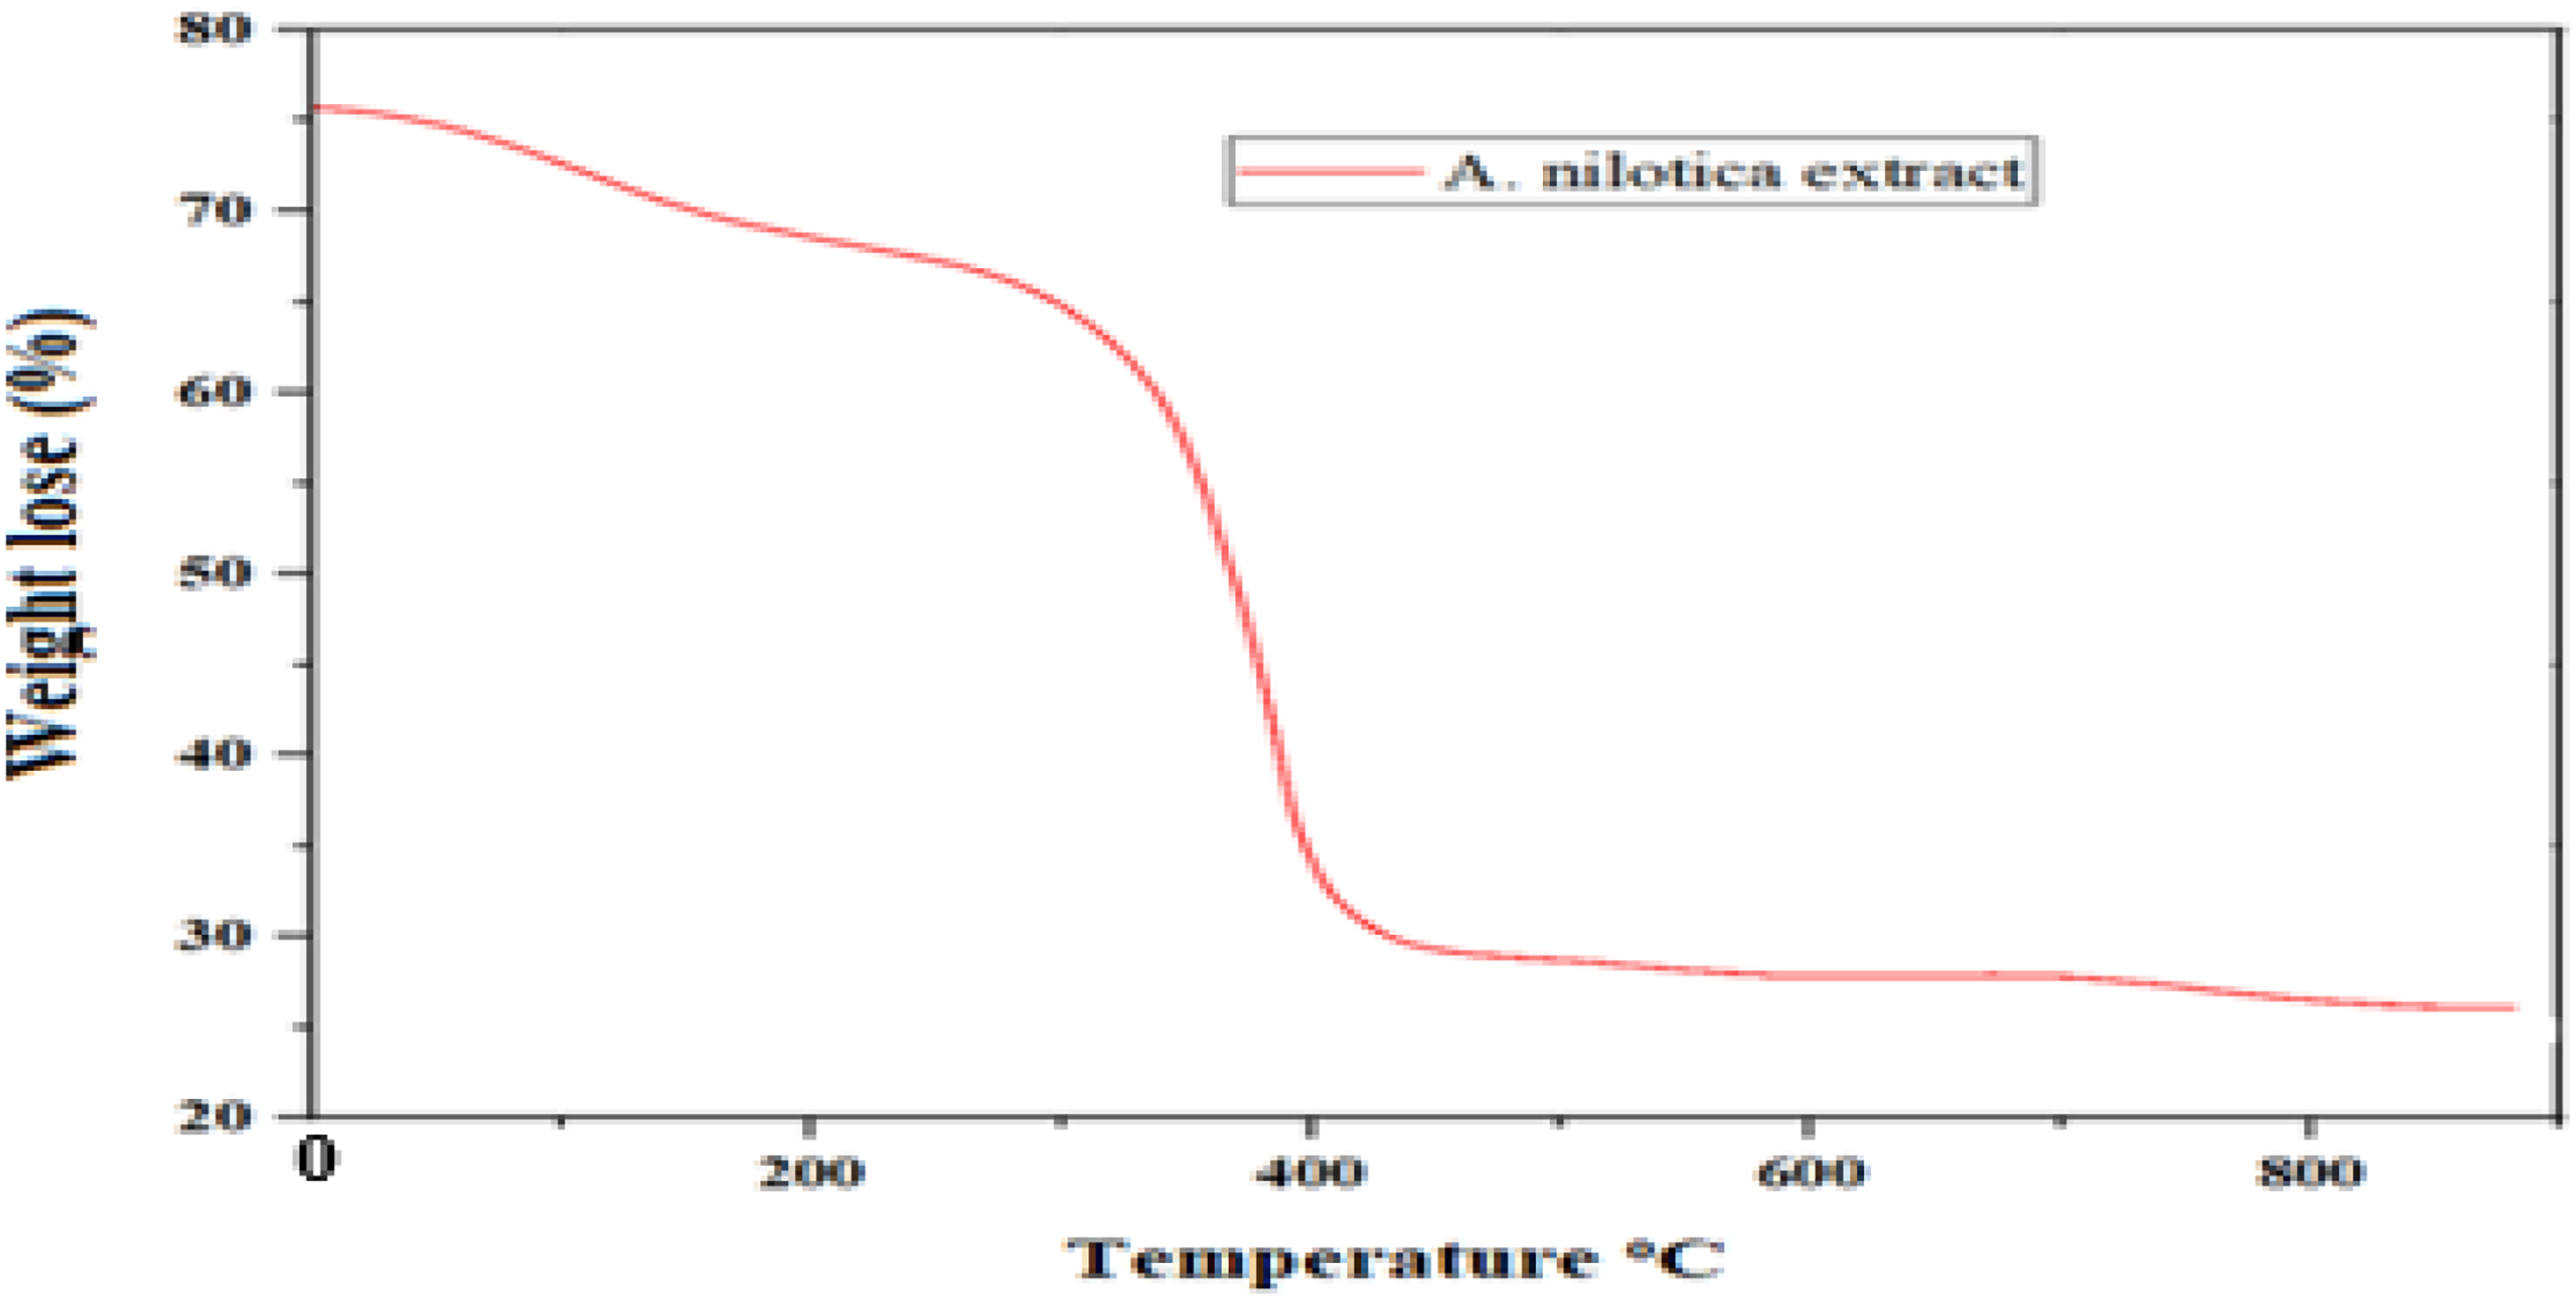
Thermal analysis of A. nilotica algae extract.
Gas Chromatography Mass Spectroscopy (GC-MS) Analysis
The phytochemical investigation of the methanol extract was carried out on a GC-MS equipment GC-MS-QP2020; SHIMADZU. The chromatogram revealed a total of 16 peaks with different retention times. The Standards were taken from the national technology of NIST08, NIST08 s and NIST14 library search programs. The result shows that Isocarnosol has a molecular weight of roughly 330.4 g/mol, and the chemical formula is C20H26O4 as shown in Table 4. It is one of the main phenolic diterpenoids in the A. nilotica algae extract with an area of 6.96%
Phytoconstituents Found in the A. nilotica algae Methanol Extract.

In the gas chromatography mass spectroscopy chromatogram of the A. nilotica algal extract, the taller peaks show for larger compound fragments are a result of their sharper elution and higher concentration, which allows more analytic to reach the detector in less time. Greater abundance and the impact of molecule size on detector response are reflected in the increased peak height and area. Therefore, for the taller the height, the abundant will be the higher as shown in Figure 6.

Gas chromatography mass spectroscopy (GC-MS) chromatogram of A. nilotica algae extract.
Chromatogram CG2 F:\GC-MS-2025\RESULTS\JULY-2025\24951\CG2.qgd
Reaction Mechanisms
A covalent bond is formed in the reaction between the hydroxyl group of phenol derivatives and the amine group (-NH2) of chitosan using citric acid as a cross-linker during the treatment of cotton fabric, as shown in Figure 7. Concurrently, the aromatic ring of phenol and the hydroxyl groups of cellulose engage in oxidative coupling or hydrogen bonding. By serving as a bridge, phenol joins chitosan and cellulose to form a sturdy composite.

The schematic representation of the reaction mechanism between cotton, citric acid, chitosan and phenol derivatives from the extract.
Testing and Evaluating
Antibacterial Test
The antibacterial activity of cotton/chitosan treated fabric is depicted in Figure 8, which shows the zone of inhibition indicating the ability against gram-positive and gram-negative bacteria. First, the antibacterial efficacy of chitosan-treated 2%w/v of cotton fabric was assessed. Following the evaluation of the chitosan, the extract-treated fabric was evaluated (extract-chitosan) as shown in Table 5. The dimensions of this inhibition zone were found to increase as the concentration of the plant extract increased.

Zone of inhibition of cotton/chitosan-treated fabric. (a) 10%, (b) 15%, (c) 20% against E. coli, and (d) 10%, (e) 15%, (f) 20% against S. aureus.
Anti-Bacterial Activity of Cotton Fabric Treated with A. nilotica algae Extracts.

The antibacterial activity assay involved placing a cotton fabric sample on a nutrient agar plate, which was subsequently inoculated with a bacterial culture. The plate was then incubated to promote bacterial proliferation, and afterwards, the inhibition zone surrounding the fabric sample was precisely measured. This zone's diameter was utilized to evaluate the antibacterial efficacy of the fabric, and the results were expressed in millimetres, as shown in Figure 8. This technique provided a definitive assessment of the antibacterial properties conferred on the cotton fabric through treatment with the plant extract
The functionalized cotton fabric with extracts using the pad-dry-cure method is shown in Figure 9. It was treated with 10%, 15%, and 20% extract concentrations. This technique guarantees that the extract penetrates deeply into the fabric. Fixation was done by drying following curing.

Control sample, chitosan-treated fabric, 10%, 15%, and 20% plant extract-treated cotton fabric.
Air Permeability Test
The ease of airflow through a fabric is a crucial attribute of textile materials that determines their level of comfort and breathability. The treated fabric's permeability and how it decreased have been measured in comparison with the Control sample, with a permeability of 17 ± 0.4 Cm³/cm2/s. The results obtained for the 10%, 15% and 20% concentrations were 15 ± 0.5, 13 ± 0.4, and 12 ± 0.3 cm³/cm2/s, respectively.
Tensile Strength Test
Tensile strength was computed as the mean of three samples, and the results were reported as a percentage of elongation at break. The effects of A. nilotica algae extract on cotton fabric are summarized in Table 6. The bioactive components in the extract decrease the way the fibers to the fiber interact in the fabric. This leads to a little decrease in the fabric's ability to disperse applied loads more evenly throughout its structure.
Tensile Strength Test.

Elongation at break of the treated sample was decreased a little, after the deposition of bioactive components, which affects the percentage elongation of the polymeric matrix on cotton fabric. The phytochemicals present in the plant extract form bonds, such as hydrogen bonds, cross-links, or physical coatings, that are formed between the cotton fibers by bioactive components from the extract.
Discussion
The extraction rate is affected by various factors of the bioactive compounds from natural plants. A widely used solvent, methanol, was used to extract the phytochemicals from plants. Khanal, S., et al
41
used methanol as a solvent to extract phenolic compounds from species of Swertia and obtained a phenolic content of the highest in the methanol extract of SCH (67.49 ± 0.5 mg GAE/g). Another study was done on S. abyssinica leaves showing that the percentage yield of 14.75% which is below the current study. In this study, methanol was used to extract phytochremicals from A. nilotica algae extractes with an optimum yield of 39.46%.
42
The regression model demonstrates that extraction yield is influenced by time, temperature, and concentration. The positive coefficient of A (2.125) indicates that increasing time slightly increases yield, while negative coefficients for B (−3.375) and C (−1.5) suggest that higher temperature and concentration slightly reduce yield. Interaction terms show combined effects: AB (5.25) increases yield when both time and temperature rise, AC (−8) strongly decreases yield with simultaneous higher time and concentration, and BC (2.5) slightly boosts yield when temperature and concentration increase together. Further, the extract was characterized qualitatively and quantitatively in addition to FTIR. The GC-MS result shows that 17 peaks were identified, with Isocarnosol having a molecular weight of roughly 330.4 g/mol. It is one of the main phenolic diterpenoids in the A. nilotica algae extract with an area of 6.96%
The untreated or control sample did not possess antibacterial activity against bacteria E. coli and S.Aureus as shown in Table 5. The treated fabric with chitosan as a crosslinker and A.nilotica algae extract imparts antibacterial activity as compared to the research done by.20,45 This is due to the presence of natural antioxidants including tannins, alkaloids, and flavonoids that damage bacterial cell walls, block vital enzymes, and disrupt microbial metabolism are thought to be responsible for the extract's antibacterial effect. 22 Further, chitosan has an antibacterial effect because its positive charges interact with the negatively charged bacterial membranes, disrupting their membrane. 46 The antibacterial activity improved significantly with an increase in the extract's concentration from 10% to 20%. This implies that fabric performs better antibacterial activity as the plant extract concentration rises. 47
The change in surface characteristics of treated fabric results decrease in air permeability. This is due to the pore blockage and the roughness produced by the treated active substances, which decrease air permeability by raising airflow resistance. 48 Further, the tensile strength results showed an increased elongation at break. 49 For example, the control sample has 10.5% elongation at break, increasing to 14.5% as the concentration increases. 37 This suggests that increased flexibility due to the deposition of bioactive compounds before breakage acts as a binding agent between fibers. 50
While these results are promising, there are certain limitations to be considered in interpreting the findings. Methanol was the only solvent used in the extraction process; other environmentally friendly extraction methods were not investigated. Antibacterial assessment was done with two bacterial strains only, which limited its applicability to other pathogens. Moreover, the surface chemistry of the treated fabric was not included in the analysis. To completely establish the treatment's practical usefulness, these factors should be covered in future research.
Conclusion
This study demonstrated that cotton fabric crosslinked with chitosan and finished with A. nilotica algae extract provides an effective and sustainable antibacterial treatment. The pad-dry-cure treatment, using methanol-extracted A. nilotica algae, resulted in substantial antibacterial activity was assessed qualitatively with a zone of inhibition method against both bacteria. The chitosan-treated cotton fabric has a value of 8 mm S. aureus and 6 mm E. coli, whereas the chitosan/extract-coated cotton fabric exhibited enhanced antibacterial activity with a value of 11, 17, and 18 mm for E. coli and 15, 20, and 21 mm for S. aureus. These results indicate a promising level of bacterial resistance. Additionally, the optimization of extraction conditions revealed that an 18 ml/g concentration and a treatment time of 50.86 min, and a temperature of 62
Future Work
The results of this work show better antibacterial properties as explained in the result section comparing the other studies. It has better tensile strength and air permeability, as well as a better yield with improved antibacterial properties. This study lays the groundwork for future investigations into green extraction techniques, plant-based functional textiles, and their use in textile goods for hygiene and medicine. Based on these findings, the following suggestions are proposed for future research.
It would be valuable to conduct further experiments using alternative drying systems, other than the sunshade dryer, to explore their potential impact on the drying process and product quality and optimization during the fabric treatment processes. Surface chemistry and CIELab for the treated cotton fabric. Exploring the combination of the algae extract with other plant extracts to further enhance the functional properties of the treated cotton fabric. Optimizing the treatment condition for chitosan and the A. nlotica algae extracts
Highlights
Functionalization of cotton fabric using A. nilotica algae is a new field of study.
Eco-friendly formulations that improve the functionality of cotton have been done.
An improving yield and better antibacterial cotton fabric were obtained.
Footnotes
Acknowledgements
The author extends heartfelt gratitude to Hawassa University Institute of Technology,
Ethical Considerations
Ethical Approval is not applicable for this article.
Statement of Human and Animal Rights
This article does not contain any studies with human or animal subjects.
Author Contribution
As the sole author of this manuscript, I confirm that I was solely responsible for all aspects of the research and writing process.
Funding
The author received no financial support for the research, authorship, and/or publication of this article.
Declaration of Conflicting Interests
The author declared no potential conflicts of interest with respect to the research, authorship, and/or publication of this article.
Data Availability Statement
Data will be made available on request.