
Abstract
Background
Saurauia fasciculata has been traditionally utilized in Nepalese medicine for various therapeutic applications. This study aimed to characterize the phytochemical profile and evaluate the anti-inflammatory potential of S. fasciculata bark extract using an integrated in-silico and in-vitro approach.
Methods
Methanolic bark extract was prepared by sequential maceration and analyzed using Fourier transform infrared spectroscopy (FT-IR) for functional group characterization and liquid chromatography–mass spectrometry (LC–MS/MS) for phytochemical profiling. Network pharmacology analysis was performed to predict inflammation-related targets. Key protein targets (PIK3R1 and PIK3CA) were subjected to molecular docking (AutoDock Vina v1.2.0) with identified phytoconstituents, followed by 100 ns molecular dynamics simulations using Schrödinger Desmond (release 2022-3). Post-simulation analysis was performed to validate the complex stability. Pharmacokinetic properties of the top phytoconstituents were evaluated in silico. Anti-inflammatory potential of the crude extract was validated in vitro using the protein denaturation assay, with aspirin as the standard.
Results
LC–MS analysis revealed multiple bioactive constituents, including Equol, 2′-methoxy-6,8-dimethyl flavone, Quercetin, Retusin, and Corosolic acid. Network pharmacology highlighted PIK3R1 and PIK3CA as pivotal inflammation-related targets. Molecular docking showed that Equol had the highest binding affinity toward PIK3-δ (6PYR; −9.0 kcal/mol) and PIK3-α (8EXL; −9.1 kcal/mol). MD simulations confirmed stable protein–ligand interactions, and PCA and MM/GBSA analyses supported strong binding stability and energetics. In vitro, the extract inhibited protein denaturation in a dose-dependent manner, with an IC50 of 112.10 ± 0.57 µg/mL compared to 75.33 ± 0.73 µg/mL for aspirin, suggesting moderate anti-inflammatory activity.
Conclusion
This study provides preliminary evidence supporting the anti-inflammatory potential of S. fasciculata bark extract, with Equol identified as a promising candidate for further investigation.
Introduction
Inflammation is the mechanism of tissue repair after injury or damage. It involves a series of cellular and microvascular responses that remove damaged tissues and facilitate the growth of new tissues. 1 The phosphoinositide 3-kinase (PI3 K) signaling pathway plays a central role in regulating inflammation by balancing both pro-inflammatory and anti-inflammatory responses. Its proper functioning is essential for immune homeostasis, and dysregulation of this pathway contributes to the development of chronic inflammatory conditions and associated diseases. 2
In inflammation, PI3 K signaling serves both pro-inflammatory and anti-inflammatory functions depending on the cellular context and the isoform involved. PI3Kγ and PI3Kδ are predominantly expressed in immune cells and are critical for leukocyte activation, chemotaxis, and the production of pro-inflammatory cytokines such as TNF-α, IL-1β, and IL-6. Activation of PI3 K/AKT also leads to the activation of downstream targets like mTOR and NF-κB, which further amplify inflammatory gene expression. 3 Conversely, PI3 K signaling can exert anti-inflammatory effects by inhibiting excessive TLR signaling and promoting the resolution phase of inflammation through mechanisms such as enhancing IL-10 production and modulating macrophage polarization toward the M2 phenotype. Dysregulation or hyperactivation of the PI3 K pathway has been implicated in a range of chronic inflammatory and autoimmune disorders, including rheumatoid arthritis, inflammatory bowel disease, and certain cancers (Figure 1). Therefore, targeting specific PI3 K isoforms represents a promising therapeutic strategy to restore immune balance and treat inflammation-driven diseases.4–6

PI3K-Mediated Inflammation Pathway.
Chronic inflammation is linked to several diseases, including heart disease, arthritis, diabetes, intestinal disorders, liver conditions, and cancer. 7 Non-steroidal anti-inflammatory drugs (NSAIDs) are potent inhibitors of cyclooxygenase (COX) and are frequently used to treat inflammatory conditions and alleviate pain. However, some studies indicate that NSAIDs can lead to significant side effects, including gastrointestinal issues and kidney problems, largely due to the presence of the free carboxylic group in their chemical structure.8,9 It is essential to search for safe and effective alternative drug candidates derived from natural products to treat inflammation and related diseases.
It is widely recognized that natural substances can serve as foundational compounds for the development of traditional pharmaceuticals. In developing countries, most drug development projects based on natural products use crude extracts for in vitro and/or in vivo testing. Efforts to isolate the active components for structural analysis are limited. 10 Recently, plant extracts containing phenolic and flavonoid compounds have gained popularity partly because of their health advantages. Although these compounds are present in various medicinal plants, they are often embedded within complex matrices, which complicate their extraction and characterization.11,12
Saurauia fasciculata Wall., also known by its synonym Ternstroemia fasciculata, belongs to the Actinidiaceae family and thrives in humid tropical regions, stretching from Vietnam to Nepal. In Nepal, this plant is locally called a Goban, and its bark juice is traditionally consumed to alleviate fever, quench thirst, and address postpartum bleeding. 13 Previous studies on various species within the genus Saurauia have identified a range of biological activities, such as antioxidants, antidiabetic, analgesic, wound healing, and antihyperlipidemic effects. 14 R. Yadav et al evaluated the methanolic extract of S. fasciculata for its antioxidant potential. Their study demonstrated notable radical scavenging activity, with an IC50 value of 31.07 µg/mL. 15 However, despite these preliminary findings, the chemical composition of S. fasciculata bark and its potential molecular drug targets related to inflammatory diseases have not yet been investigated. To the best of our knowledge, this is the first study that explores both the phytoconstituents and the anti-inflammatory mechanisms of S. fasciculata through an integrated in-silico and in-vitro approach.
The use of sensitive, flexible, and selective analytical techniques, such as Fourier transform-infrared spectroscopy (FT-IR), tandem mass spectrometry paired with liquid chromatography (LC–MS/MS), is essential for identifying secondary metabolites in plant extracts. 16 Evaluation of bioactivity has been impeded by research that isolates pure secondary metabolites and details their structure. 17 The molecular interaction of phytoconstituents against the inflammatory target is now determined by an integrated approach of network pharmacology and molecular docking, which can be validated through molecular dynamics (MD) simulation.
This study expands the incorporation of LC-MS/MS profiling, in-vitro anti-inflammatory activity, molecular docking, MD simulation, and a network pharmacology approach to determine the impact of S. fasciculata on inflammatory disease and to identify core targets, biological functions, pathways, along mechanisms of action. Molecular docking was conducted on the selected active components and key targets to confirm the network pharmacological findings. These results could aid in the management of various inflammatory diseases.
Materials and Methods
Plant Collection and Authentication
This was an experimental, laboratory-based study conducted between May 2023 to January 2024. In May 2023, fresh bark from S. fasciculata was collected from the Vyas municipality, located in the Tanahun district of Nepal (latitude 27°58′22.80″ North, longitude 84°14′19.32″ East). The National Herbarium and Plant Laboratories in Godawari-3, Lalitpur, Nepal, confirmed the authenticity of the plant specimen using the deposited sample (Herbarium specimen No. S2/30/02/2080). Plant collection, extraction, and preliminary in-vitro assays were carried out at the Department of Pharmacy, Universal College of Medical Sciences, Nepal. Spectroscopic (FT-IR) and chromatographic profiling (LC–MS/MS) were performed at the Central Instrumental Analysis Department of the Nargund College of Pharmacy in Bengaluru, India and Honeychem Pharma Research Pvt. Ltd, Bangalore, India, respectively. Computational analysis, including network pharmacology, molecular docking, and molecular dynamics simulations, was conducted using AutoDock Vina v1.2.0, Schrödinger 2022–3 software, and associated bioinformatics platforms with international collaboration.
Extraction of Plant Material
The fresh bark of S. fasciculata was cleaned, cut into smaller pieces, and shade-dried for one week. Extraction was performed by sequential maceration with intermittent heating using 70% methanol (solvent-to-plant ratio 10:1). Initially, the powdered bark was macerated with the solvent and gently heated at 45 °C for 2 h to enhance solvent penetration and facilitate the release of thermally stable constituents. This was followed by two consecutive maceration steps at room temperature (22-25 °C), each lasting 22 h and 24 h, respectively, to ensure the exhaustive extraction of heat-labile compounds. After each step, the filtrates were pooled and concentrated under reduced pressure at 45 °C using a rotary evaporator (Biobase RE-2000B, Germany). The concentrated extract was then dried in a vacuum desiccator, weighed, and stored at 4 °C until further use.
18
The yield of S. fasciculata bark was 5.20% w/w (from equation 1).
FT-IR Screening
The functional groups in the sample were identified using FT-IR. Spectrum analysis was performed at the Central Instrumental Analysis Department of the Nargund College of Pharmacy in Bengaluru, India. The IR spectra of the methanolic extract were recorded using the FT-IR (Model Shimadzu 8700) with the KBr pellet method, spanning the range of 400–4000 cm−1. 16
LC-MS Profiling
Experimental Condition
The plant extract was carefully prepared through extraction, rotary evaporation, and reconstitution in a suitable solvent for LC–MS analysis. The study was conducted at Honeychem Pharma Research Pvt. Ltd (Bangalore, India) using a UPLC Acquity H-class system with a Waters XBridge C18 column (50 × 4.6 mm, 3.5 µm). The mobile phase consisted of 0.1% formic acid in water (A) and acetonitrile (B, MS grade), delivered at 1.2 mL/min in gradient mode. Data were acquired in triplicate (n = 3) for reproducibility.
Experimental Procedure
LC–MS/MS analyses were performed on a UPLC Acquity H-class system (Waters XBridge C18 50 × 4.6 mm, 3.5 µm) coupled to a Triple Quadrupole MS/MS operating in positive- and negative-ion modes. Raw data were processed in MassLynx v4.1. Compound annotation was performed by combining: (i) accurate mass (m/z) when possible, (ii) retention time (RT), (iii) MassBank, IMPPAT (https//cb.imsc.res.in/imppat/), RefMetaPlant (https//www.biosino.org/RefMetaDB/), and PubChem databases (https//pubchem.ncbi.nlm.nih.gov/), and (iv) comparison with literature fragmentation.19–21 Because the measurements were acquired on a QqQ instrument under the applied conditions, not all peaks showed a single base [M]+/[M + H]+ ion of high intensity; therefore, identifications are considered tentative annotations. We explicitly reported the observed m/z, proposed formulae, diagnostic fragment ions, and the level of confidence (tentative) for each assignment.
Molecular Explanation
Network Pharmacology
Network pharmacology combines bioinformatics, cheminformatics, and systems biology to systematically investigate drug-target-disease interactions. Our methodology encompassed four key phases: (1) data collection from PubChem, SwissTargetPrediction, and GenCard; (2) network construction using InteractiveVenn and STRING 12.0; (3) topological analysis with Cytoscape v3.10.2; and (4) computational validation, enabling comprehensive identification of therapeutic candidates and their molecular mechanisms. 22
Retrieval of Ligands, Target Proteins, and Disease-Related Genes
The study began with data collection, where information on drug compounds, target proteins, and disease-associated genes was retrieved from publicly available databases. The PubChem (https://pubchem.ncbi.nlm.nih.gov/) database was used to obtain the chemical structures of the selected 11 phytoconstituents. The 3D structure of ligands was uploaded to the SwissTargetPrediction server to predict the target protein. To identify inflammation-associated genes, data were extracted from GenCard (https//www.genecards.org/). We have given the prompt ‘‘inflammation’’ to the server and customized the search, excluding pseudogene and uncategorized gene. GeneCard is a comprehensive database integrating gene-disease relationships from multiple sources. 23
Ligand-Target Network (LTN) and Protein-Protein Interaction (PPI)
Using InteractiveVenn (https//www.interactivenn.net/), we visualized the phytoconstituents related target and disease-related gene network to identify shared and unique targets. We then constructed integrated networks mapping relationships between drugs, targets, and disease-associated genes. The STRING 12.0 database generated a protein-protein interaction (PPI) network with interaction scores and functional annotations. 24 Simultaneously, we developed a disease-gene network by linking disease-related genes to their protein targets, revealing key molecular mechanisms. This multi-network integration enabled systematic identification of crucial therapeutic targets.
Network Analysis
To analyze the constructed networks, we performed a comprehensive network analysis using Cytoscape v3.10.2 for visualizing drug-target-disease interactions. Key nodes were identified through centrality measures, degree centrality highlighted highly connected proteins, betweenness centrality revealed critical regulatory hubs, and closeness centrality pinpointed functionally influential proteins within the network. 25
Kyoto Encyclopedia of Genes and Genomes (KEGG) and Gene Ontology (GO) Pathway Analysis
GO provides a rationally organized and standardized framework of terms describing biological events, molecular functions, and cellular components. It incorporates systematically curated gene annotations derived from these terms across various species. The annotation of biological processes using GO is essential for performing pathway enrichment analysis, which helps identify key biological mechanisms relevant to specific research objectives. To uncover key biological pathways, we conducted a functional enrichment analysis using STRING 12.0 (https//string-db.org/). Additionally, KEGG and Gene Ontology (GO) enrichment analyses helped elucidate the molecular functions and biological processes linked to the identified targets. 26
Molecular Docking
Ligand Preparation
We identified 11 bioactive phytoconstituents from S. fasciculata bark extract by using the LC-MS technique. From 11, we have selected 9 phytoconstituents for docking as all of them follow Lipinski's rule of five, along with adequate pharmacokinetic properties. For structural characterization, three-dimensional conformations were acquired from PubChem (SDF format). Molecular mechanics optimization (FFMM96 force field) and PDBQT conversion were performed using OpenBabel v3.1.1 on Ubuntu Linux. 27
Protein Preparation
Network pharmacology enabled us to select the target protein for treating inflammation. From network pharmacology, we have selected two proteins (PIK3R1 and PIK3CA) that play a significant role in inflammation (discussion section). The PIK3R1 and PIK3CA proteins are components of the PI3 K pathway, playing a crucial role in inflammation. PIK3R1 acts as a regulatory subunit while PIK3CA acts as a catalytic subunit, and both are part of the regulation of immune response burden that often leads to the disease associated with inflammation. 28 The crystal structure of PI3K-α in complex with Taselisib (PDBID 8EXL) 29 and human PI3K-δ in complex with cocrystal ligand P5J (PDBID 6PYR) 30 were retrieved from the Protein Database (PDB). Both the proteins exerted good resolution of 1.99 Å for 8EXL and 2.21 Å for 6PYR. Both proteins were within the limit in the Ramachandran plot (Figures 1S and 2S, supplementary file). Both proteins were mutation-free free along with good Ramachandran outliers. Protein preparation involved water and heteroatom removal, followed by polar hydrogen addition and charge optimization in AutoDock Tools 1.5.7. The missing residues were repaired, and both proteins were saved in PDBQT format. 31
Conserved Domain Analysis
The conserved domains of PI3K-α (PDB ID: 8EXL) and PI3K-δ (PDB ID: 6PYR) were identified using the NCBI Conserved Domain Database (CDD, https://www.ncbi.nlm.nih.gov/Structure/cdd/wrpsb.cgi). Protein sequences were queried against the CDD, and domain architecture was annotated based on the highest-confidence matches. Schematic representation of the domain organization was generated to highlight the adaptor-binding (ABD), Ras-binding (RBD), C2, helical, and kinase catalytic domains, with the predicted ligand-binding site localized in the ATP-binding pocket of the kinase domain.
Reference Drugs
Taselisib is a potent PI3 K inhibitor and native co-crystal ligand of the 8EXL protein (Figure 1A). Taselisib has a dual mechanism of action, both blocking PI3 K signaling and inducing a decrease in mutant p110α protein levels. 32 We have used this drug as a reference for comparing the docking binding energy and interaction. Similarly, co-crystal ligand P5J was used reference drug for the 6PYR protein (Figure 2B).

3D Structure of Taselisib (A) and Cocrystal Ligand of 6PYR Protein, P5J (B).
Active Site in Grid Box
Site-specific docking is a form of molecular docking that aims at predicting the ligand binding pose in a known protein binding site. This is useful when one already knows where the binding site is located so that the docking simulations can be done more efficiently and accurately. 33 For both proteins, we have generated a grid box around the binding pose of the co-crystal ligand and mapped the dimensions. The grid box dimension file includes the x, y, and z coordinates for 6PYR (PI3K-δ) as 35.35, 16.23, and 32.55, respectively, and for 8EXL (PI3K-α) as −15.82, 15.39, and 29.04, respectively. We used the fixed box size of 20 Å for both proteins. The exhaustiveness of 8 and the energy range were set to 4 for efficient docking.
Docking Protocol
Then all the prepared ligands, protein in PDBQT format loaded to the work dictionary, and a molecular docking simulation was run on an Ubuntu 20.04.6 LTS system, where AutoDock vina v1.2.0 processed the best binding pose with binding energy. 34 AutoDock Vina v1.2.0 employs a gradient optimization approach to determine the direction of optimization from one evaluation, sampling potential ligand-binding conformations by globally optimizing initially positioned binding conformations to forecast the binding mode of small molecules to their protein targets. The global optimization approach offers faster convergence, improved sampling efficiency, better reproducibility, and lower computational cost compared to other methods. 35 The subsequent visualization of the output file was performed in PyMOL v3.1 and BIOVIA Discovery Studio 2021. The docking process was validated by redocking the co-crystal ligand to the binding site. Then the surface alignment with the before and after docking pose of the co-crystal ligand was conducted to calculate the Root Mean Square Deviation (RMSD). 36
Molecular Dynamics (MD) Simulation
Equol complexed with both proteins (two complexes) was selected for MD simulation based on the docking score and pharmacokinetic properties. The protein-ligand complex was subjected to MD simulations using Desmond (Schrödinger release 2022-3). The system was solvated in an orthorhombic TIP3P water box, neutralized with counterions, and maintained at physiological ionic strength (0.15 M NaCl). Energy minimization and system equilibration were performed using the OPLS4 force field, employing a multi-stage protocol under NVT and NPT ensembles. A 100 ns production run was executed with a 2-fs timestep, under isothermal-isobaric conditions (300 K, 1 atm). Post-simulation analysis included RMSD, Root Mean Square Fluctuation (RMSF), Radius of Gyration (Rgyr), Solvent-Accessible Surface Area (SASA), Polar Surface Area (PSA), and Molecular Surface Area (MolSA) to evaluate structural stability, flexibility, and dynamic interactions of the complex. 37
Principal Component Analysis (PCA)
For the two studied complexes, Principal Components (PCs) were derived through covariance matrix diagonalization, resolving eigenvalues and eigenvectors. PCA serves as a fundamental dimensionality reduction technique for analyzing large-scale MD datasets, particularly in characterizing slow, functional motions of biomolecules. This approach quantifies dominant collective motions, with eigenvalues ranking their contribution to conformational dynamics. 38
Molecular Mechanics/Generalized Born Surface Area (MM/GBSA)
The last 10 ns snapshot of the simulation trajectory was used for the MM/GBSA calculation. The binding free energy of both docked complexes was predicted using the prime module of Maestro (Equation 2).

Where, “Ebond, Eel, and EvdW correspond to the standard MM bonded, electrostatic, and vdW energy terms. Gpolar and Gnpolar are the polar and non-polar contributions to the solvation free energy, respectively. The final term is the temperature T multiplied by the entropy S, estimated from a normal-mode analysis approach”. 39
Pharmacokinetic and Drug Likeliness Analysis
We used the Deep-PK server to assess Absorption, Distribution, Metabolism, and Excretion (ADME) properties. 40 Similarly, for the drug likeliness study, we used ADMETlab 2.0 (https//admetmesh.scbdd.com/) web server. 41 The process started by accessing the ADMETlab 2.0 server via a web browser. After reaching the platform, we entered the SMILE notation for the compounds we examined. Predicting absorption involves evaluating factors such as gastrointestinal uptake, partition coefficient, and solubility in water. Distribution predictions consider factors that affect how a compound spreads throughout the body. Metabolism predictions assess the potential of a compound to be metabolized by cytochrome P450 enzymes. Excretion predictions are related to both renal and nonrenal clearance. 42
The Inhibition of Protein Denaturation Assay
The anti-inflammatory potential of the S. fasciculata methanolic extract was assessed using the protein denaturation assay as described by Pandey et al 9 with minor modifications. Briefly, stock solutions of the crude extract and aspirin (reference) were prepared in methanol and diluted with phosphate buffer saline (PBS, pH 6.3) immediately before the assay to the working concentrations (50, 100, 200, 400, and 600 µg/mL). All experimental conditions included a vehicle control containing the same final concentration of methanol as sample wells (final methanol concentration ≤ 1% v/v) to exclude any solvent effects; the vehicle blank absorbance was subtracted from test and standard readings.
For each independent experiment, 0.2 mL of 1% bovine serum albumin (BSA) was mixed with 2.8 mL of PBS and 1.0 mL of the test solution to give the desired final concentration, incubated at 37 °C for 20 min, then heated at 70 °C for 5 min to induce denaturation. After cooling to room temperature, turbidity was read at 660 nm on a UV-Vis spectrophotometer. Each concentration was measured in technical triplicate within each biological replicate. Three independent experiments (n = 3) were performed on different days using freshly prepared samples. The percentage inhibition of protein denaturation was calculated for each concentration using the formula (Equation 3).
IC50 Determination and Statistics
Percent inhibition versus concentration data from the three independent experiments (each with technical triplicates) were fitted to a four-parameter logistic (4PL) dose–response curve using non-linear regression in GraphPad Prism v10. IC50 values reported correspond to the concentration producing 50% inhibition derived from the best-fit curve. IC50 values are reported as derived from pooled data; data are presented as mean ± SD for measurements at each concentration.
Results
Fourier-Transformed-Infrared (FT-IR) Spectrum Analysis
The FT-IR spectrum of the methanolic extract of Saurauia fasciculata bark showed multiple absorptions consistent with a complex mixture of phenolic, aromatic, and glycosidic constituents. A broad band centered near ∼3400 cm−1 can be assigned to O–H stretching vibrations commonly observed for phenols and alcohols; however, residual methanol (used in extraction, although removed by rotatory evaporator) can also contribute to this broad feature, and therefore its origin is considered tentative. Absorptions at 2927 and 2854 cm−1 correspond to aliphatic C–H stretching (Figure 3). The band observed near 1616 cm−1 is most consistent with aromatic/olefinic C = C stretching and/or conjugated C = O vibrations in highly conjugated systems; because a distinct unconjugated carbonyl band (∼1700-1740cm−1) is not prominent, we do not assign unambiguous aldehyde or non-conjugated ketone functionality. Bands in the 1500–1450 cm−¹ region support aromatic C = C vibrations, while signals at 1284 cm−¹ 1and 1049 cm−1 are indicative of C–O stretching modes (aryl ether and glycosidic C–O, respectively), consistent with flavonoid glycosides. The FT-IR data support the presence of phenolic, aromatic, and glycosidic functionalities in the extract, but are tentative; definitive structural assignment of individual components requires isolation and spectroscopic characterization (eg, NMR, HRMS) of pure metabolites.

FT-IR Spectrum of the Methanolic Extract of Saurauia fasciculata Bark Showing Key Functional Group Vibrations: O–H (3400 cm−1), C–H Aliphatic (2927-2854 cm−1), C = C (1616 cm−1), Aromatic C = C (1500-1450 cm−1), C–O aryl ether (1284 cm−1), and Glycosidic C–O (1049 cm−1).
LC-MS Characterization
The LC–MS analysis resulted in multiple chromatographic peaks consistent with flavonoids, isoflavones, triterpenoids, glycosides, and related secondary metabolites (Figure 4). However, because many mass spectra lacked a single dominating molecular ion and because identifications relied on database and literature matching of MS/MS fragments, the compound assignments are tentative. They should not be considered fully confirmed structures. We reported the observed m/z, retention time, and characteristic fragment ions for each entry (Table 1 and Supplementary Figures 3S–9S). Conclusive structural confirmation of individual constituents requires isolation and high-resolution mass spectrometry (HR-MS) and NMR; we therefore interpret biological correlations based on putative identities, emphasizing that these are hypothesis-generating rather than definitive.

Liquid Chromatogram of Extract. The Numbers (
LC-MS Data Positive/Negative ion Mode for Tentative Compound Identification in 70% MeOH Extract of S. fasciculata.

Target Identification for Inflammation Treatment
We identified potential therapeutic targets for phytoconstituents in inflammation treatment by analyzing 16,055 disease-related targets from multiple databases (SwissTargetPrediction = 206, GeneCards = 15,849). Through comparative analysis, we found 191 overlapping targets between phytoconstituents-related targets and inflammation-related genes, suggesting these as the most relevant candidates for further investigation, as visualized in the Venn diagram (Figure 5).

Extraction of Common Genes and Target Details from the STRING Database.
PPI Network Construction and Analysis
We analyzed target genes using STRING v12.0 to build a protein-protein interaction (PPI) network, applying a confidence threshold of ≥0.9. We observed 190 total number of nodes and 112 total number of edges along with PPI enrichments p-value < 1.0 × 10⁻¹⁶. The resulting network contained 76 proteins connected by 63 interactions, with an average node degree of 1.18 and an average local clustering coefficient of 0.313, reflecting significant interconnectivity. In the protein interaction network, nodes correspond to proteins and edges depict their connections. Proteins with higher degree values (more connections) play more biologically significant roles in the network (Figure 6A). The top 10 genes were identified based on a node ranked in CytoHubba which are depicted in Figure 6B. PIK3R, PIK3CA, and SRC emerged as central hubs across all functional modules, indicating their pivotal role in the inflammatory process. We have selected PIK3R and PIK3CA as target proteins for a molecular docking study.

Grid View of Common Targets with the Top Five Best Targets in Yellow Color (A) and Stacked Node View of the top 10 Predicted Targets from where we Choose PIK3R1 and PIK3CA for the Docking Study. The Best Four are Highlighted in Blue (B).
KEGG and GO Enrichment Pathway
To determine the biological mechanisms of phytoconstituents against inflammation, we performed GO and KEGG enrichment analysis on the top 10 potential therapeutic targets (common targets) of phytoconstituents used in the treatment of inflammation using the ShinyGO v0.82 database (https//bioinformatics.sdstate.edu/go/). The KEGG pathway is explained in the supplementary file (Figure 10S). Figure 7 presents KEGG pathway enrichment and Gene Ontology Biological Process (GO BP) enrichment, respectively, highlighting key molecular mechanisms associated with EGFR tyrosine kinase inhibitor resistance. In Figure 7A, the top KEGG pathways enriched include EGFR tyrosine kinase inhibitor resistance, ErbB signaling, PI3K-Akt signaling, focal adhesion, and chemokine signaling pathways, all of which are crucial for inflammation progression and drug resistance. The fold enrichment values suggest that these pathways are significantly overrepresented, with the EGFR resistance and ErbB signaling pathways showing the highest enrichment.

Top Ten GO BP Terms and KEGG Pathway. (A) KEGG Pathway Enrichment. (B) BP Enrichment. The Color of the Bar Chart Represents the Adjusted -log10 (FDR) Value. (C) Conserved Domain Architecture of PI3 K (α/δ Isoforms) Predicted Using NCBI CDD. Specific Hits Identified Include the p85-Binding Domain (PI3K_p85), Ras-Binding Domain (PI3K_rbd), C2 Domain (C2_PI3K_class_I_beta_delta), PI3Ka Catalytic Domain, and the PI3Kc_IA_delta Kinase Domain. Superfamily Associations Include PI3K_p85 Superfamily, PI3K_rbd Superfamily, C2 Superfamily, PI3Ka Superfamily, and PKc-Like Superfamily.
Figure 7B displays the top ten enriched GO BP terms, with phosphatidylinositol 3-kinase signaling, transmembrane receptor protein tyrosine kinase signaling, and regulation of phosphorylation among the most significant. These biological processes are directly involved in signal transduction, kinase activity regulation, and cellular responses to external stimuli, further reinforcing their role in drug resistance and inflammation adaptation. The color gradient in both Figures represents the -log10(FDR) value, indicating statistical significance, where higher values suggest stronger enrichment. These results collectively highlight the molecular landscape driving EGFR-TKI resistance and emphasize the potential therapeutic targets within these enriched pathways.
Conserved Domain Analysis
Conserved domain analysis using the NCBI CDD server revealed that both PI3K-α (PDB ID: 8EXL) and PI3K-δ (PDB ID: 6PYR) contain the classical catalytic kinase domain belonging to the PKc-like superfamily (cl21453), which is responsible for ATP binding and phosphatidylinositol phosphorylation. Additionally, the proteins harbor the helical domain and C2 domain (cd08398), which contribute to membrane binding and stabilization of the kinase active site. These conserved domains are critical for mediating substrate recognition and inhibitor interactions (Figure 7C).
Molecular Docking
Molecular docking studies were conducted to evaluate the binding affinity and interaction profiles of various ligands with the inflammatory target proteins 6PYR (PI3K-δ) and 8EXL (PI3K-α). The results provide insights into the key amino acid residues involved in ligand binding and the types of interactions stabilizing these complexes. The docking scores, measured as binding affinity in kcal/mol, indicate the strength of interaction between each ligand and the receptor. For the 6PYR protein, binding affinity values ranged from −6.3 kcal/mol to −9.0 kcal/mol, with the strongest interaction observed for ligand Equol (−9.0 kcal/mol). The key interacting residues included Phe908, Trp760, Ile777, Met752, Lys779, Leu784, Asp787, Phe912, Glu826, Val827, Asp911, Tyr813, Ile826, Ile910, Val828, and Met900 (Table 4). These residues facilitated binding through Van der Waals forces, hydrogen bonding, and various π interactions such as π-π T-shaped, π-sigma, and π-alkyl interactions. The native co-crystal ligand showed a similar binding affinity of −9.0 kcal/mol.
Similarly, the docking analysis for the PI3K-α (8EXL) protein revealed binding affinity values ranging from −5.6 kcal/mol to −9.1 kcal/mol. Equol exhibited the strongest binding affinity with −9.1 kcal/mol binding score. In this protein, most of the phytoconstituents engaged in interactions with residues such as Leu807, Glu849, Val850, Phe930, Met772, Ile800, Asp933, 810, Lys802, Val 851, Ile848, 932, Tyr 836, and Met 922. These interactions were dominated by van der Waals forces, conventional hydrogen bonds, and various π interactions, including π-π T-shaped, π-sigma, π-sulfur, alkyl, and π-alkyl interactions. The reference drug Taselisib showed binding affinity of −9.8 kcal/mol against 8EXL (Table 2). Figure 8 indicates the 3D interaction (hydrogen bonding) of Equol and 2’-Methoxy-6,8-dimethyl flavone against 6PYR and 8EXL proteins. The 2D interaction of all 10 phytoconstituents against 6PYR (PI3K-δ) and 8EXL (PI3K-α) proteins is given in the supplementary file (Figure 11S-27S).

3D Interaction (Conventional Hydrogen Interaction) of Compounds Equol & 2’-Methoxy-6,8-Dimethyl Flavone (MDF) Against 6PYR (PI3K-δ) and 8EXL (PI3K-α).
Binding Affinity, Interactive Amino Acids, and Interaction Types of Selected Phytoconstituents Against 6PYR (PI3K-δ) and 8EXL (PI3K-α) Protein.

ADME Analysis
ADME properties of the top four phytoconstituents (based on binding score) were predicted by the Deep-PK web server. Among them, Myricetin showed low absorption in the human intestine, while the other phytoconstituents, Quercetin, Ellagic acid, Equol, and 2’-Methoxy-6,8-dimethyl flavones, demonstrated high human intestinal absorption (HIA) (Table 3).
Pharmacokinetic (ADME) Properties of the Compounds.

Drug Likeliness Properties
ADMETlab 2.0, a web server, was employed to evaluate drug-likeness characteristics using Lipinski's parameters. This evaluation was based on 2D molecular descriptors, including molecular weight (MW), number of hydrogen bond donors (HBD), number of hydrogen bond acceptors (HBA), number of rotatable bonds (nRB), Log P value, and molecular surface area (MSA). All three phytoconstituents obey Lipinski's rule except myricetin (Table 4).
Drug-Like Properties of the Top Four Phytoconstituents.

MD Simulation
MD simulation was performed to assess the structural stability, flexibility, solvent interactions, and binding behavior of the 6PYR-Equol and 8EXL-Equol complexes. A comparative analysis of RMSD, RMSF, Rgyr, SASA, and protein-ligand interactions provided insights into the dynamic behavior of these complexes.
Structural Stability and Flexibility
The RMSD analysis revealed that the 6PYR-Equol complex exhibited higher fluctuations throughout the simulation, indicating greater structural flexibility. The protein RMSD increased significantly after 20 ns and remained unstable, while the ligand RMSD showed continuous variation, suggesting potential conformational rearrangements. The ligand RMSD remained relatively stable between 0.8 and 2.5 Å for the first 80 ns (Figure 9A). In contrast, the 8EXL-Equol complex maintained lower and more stable RMSD values, implying a more rigid and stable conformation. The ligand RMSD remained consistently below 2.3 Å (Figure 9B). The lower fluctuations in 8EXL-Equol suggested a tighter ligand binding compared to 6PYR-Equol.

Root Mean Square Deviation (RMSD) Graph of Equol complex with A. 6PYR and B. 8EXL Protein.
The flexibility of the 6PYR and 8EXL proteins in complex with the Equol was assessed by calculating the RMSF for Cα atoms over the course of the MD simulation. The RMSF profiles provided insights into the local residue flexibility, identifying regions of high and low stability in the protein structures. The RMSF analysis provided residue-level insights into flexibility (Figure 10).
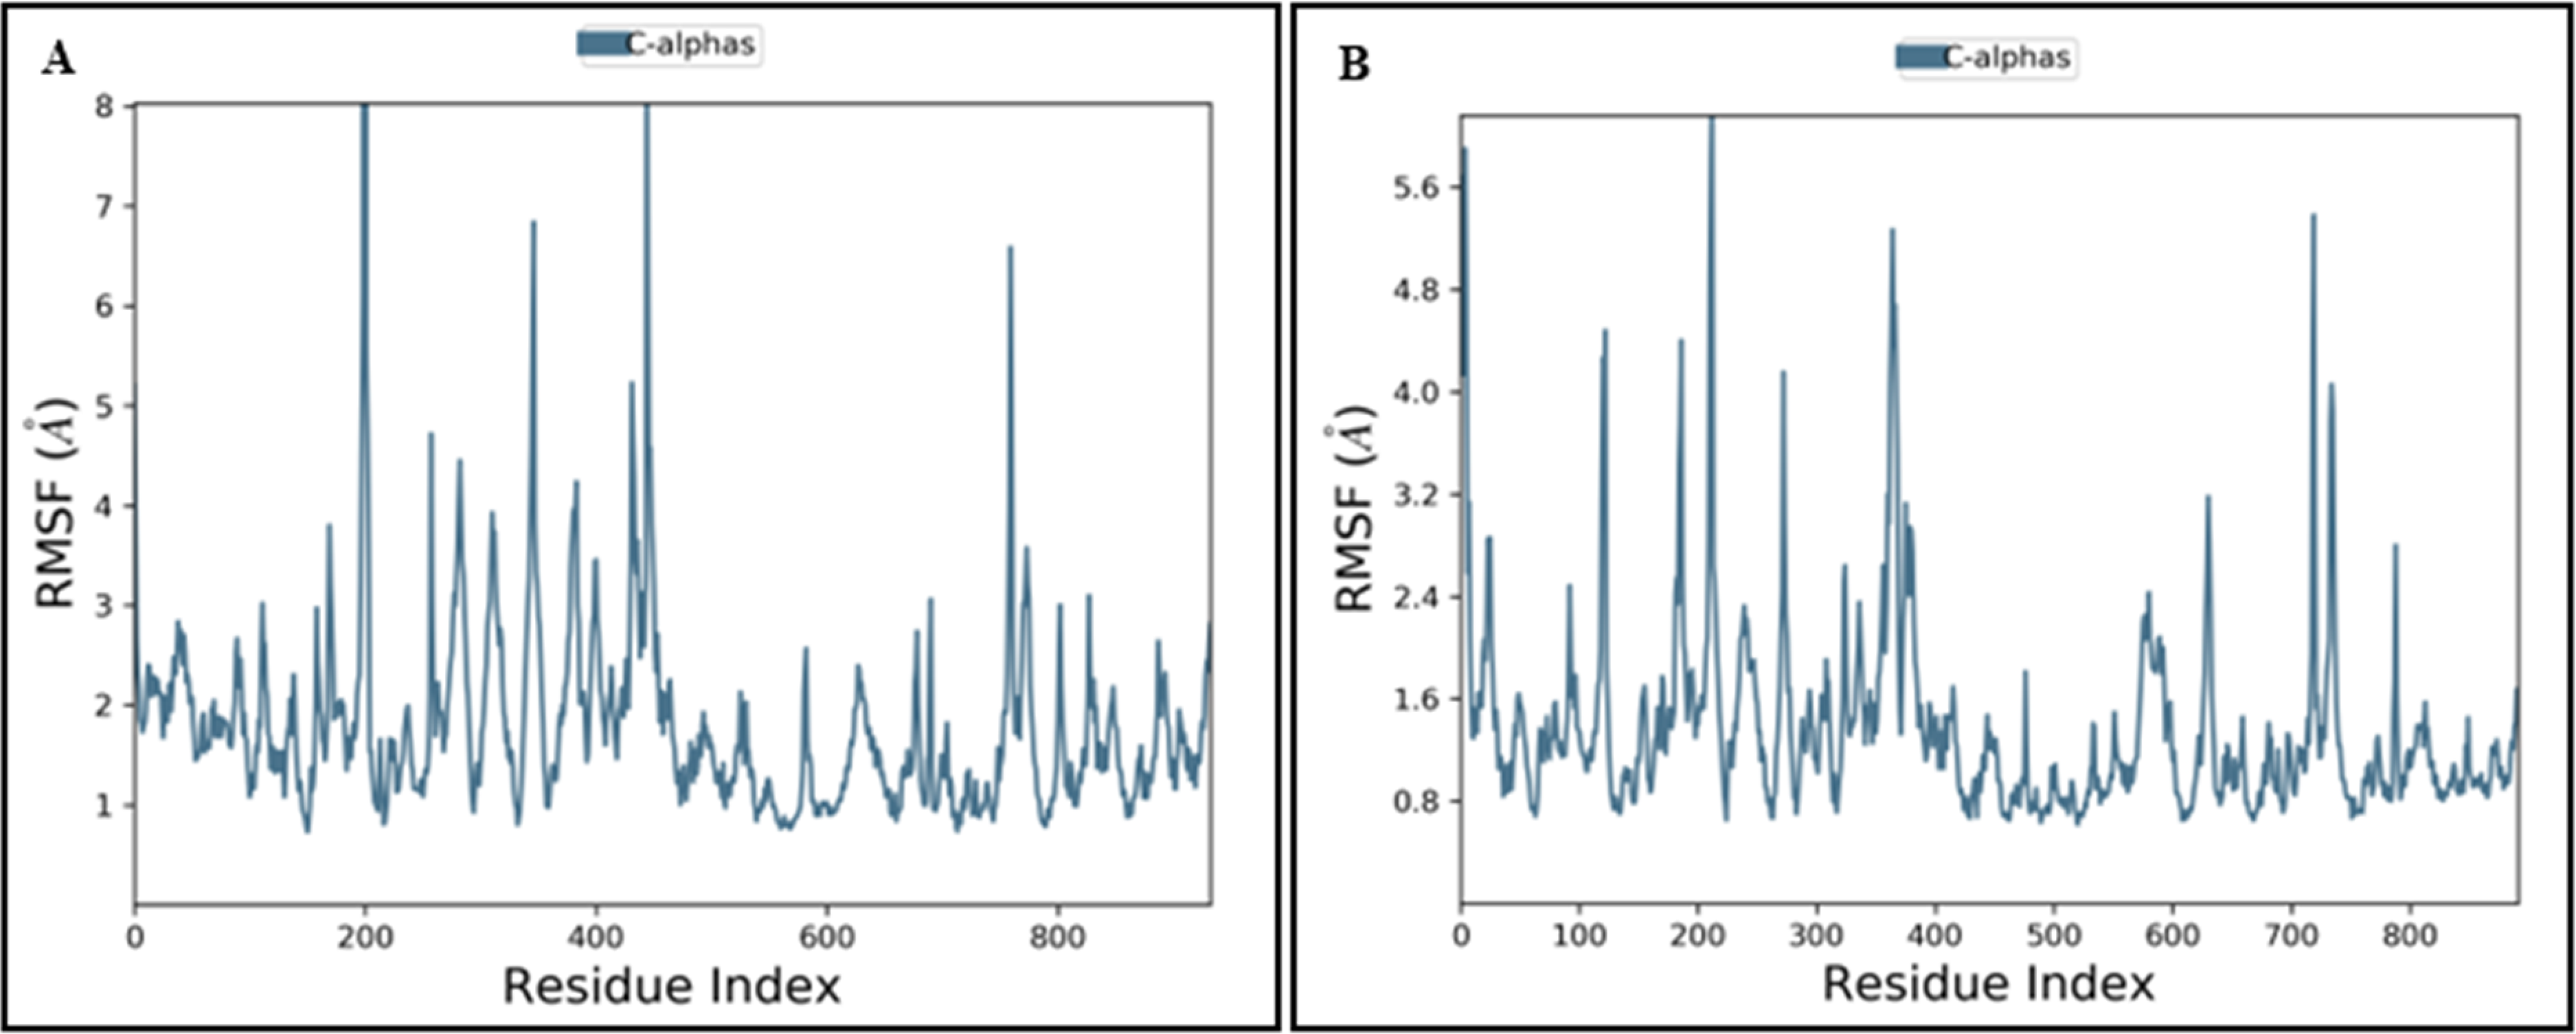
Root Mean Square Fluctuation (RMSF) Graph of Protein A. 6PYR and B. 8EXL Protein.
In 6PYR, residues around 200, 400, and 700 displayed higher fluctuations, correlating with regions of increased solvent exposure. These peaks suggested flexible loop regions or solvent-exposed segments undergoing significant conformational changes. The role of solvent in the flexibility of residues around 200, 400, and 700 was evident from the correlation between RMSF, SASA, and PSA values. Around the residue 200 exhibited high fluctuation, with a gradual decrease in SASA, suggesting reduced solvent exposure and increased structural packing over time (Figure 10A). The overall average fluctuation ranged between 1.5 and 3.5 Å, indicating a moderate degree of flexibility in most regions, while specific segments experienced high mobility. Conversely, 8EXL demonstrated lower RMSF values across these regions, suggesting greater structural rigidity. Most regions exhibited fluctuations between 0.8 and 2.3 Å, indicating that the 8EXL protein was structurally stable (Figure 10B). The high fluctuations in 6PYR were likely due to the solvent-driven dynamics of these residues, whereas 8EXL remained more stable due to consistent solvent interactions.
Solvent Interactions and Compactness
The Rgyr value for the 6PYR protein fluctuated around 7.0–7.5 Å. In contrast, the 8EXL protein exhibited a more stable Rgyr profile, fluctuating within a narrow range around 6.8–7.2 Å, suggesting a more compact and rigid structure compared to 6PYR. The Rgyr values remained relatively stable for both complexes, but 6PYR exhibited a slight increase in Rgyr over time, indicating a more flexible and expanded structure. The solvent-exposed surface area (SASA) analysis supported this observation, as SASA values for 6PYR gradually decreased, suggesting dynamic folding and changes in solvent accessibility (Figure 11). On the other hand, 8EXL maintained stable SASA values, implying a well-preserved, compact conformation throughout the simulation. For the 6PYR protein, the MolSA and PSA values exhibited minor fluctuations, with PSA values remaining between 22 and 26 Ų, implying consistent exposure of polar regions to the solvent. While for 8EXL, the MolSA and PSA values showed moderate fluctuations but remained consistent throughout the simulation, with PSA values ranging between 24 and 28 Ų (Figure 12).
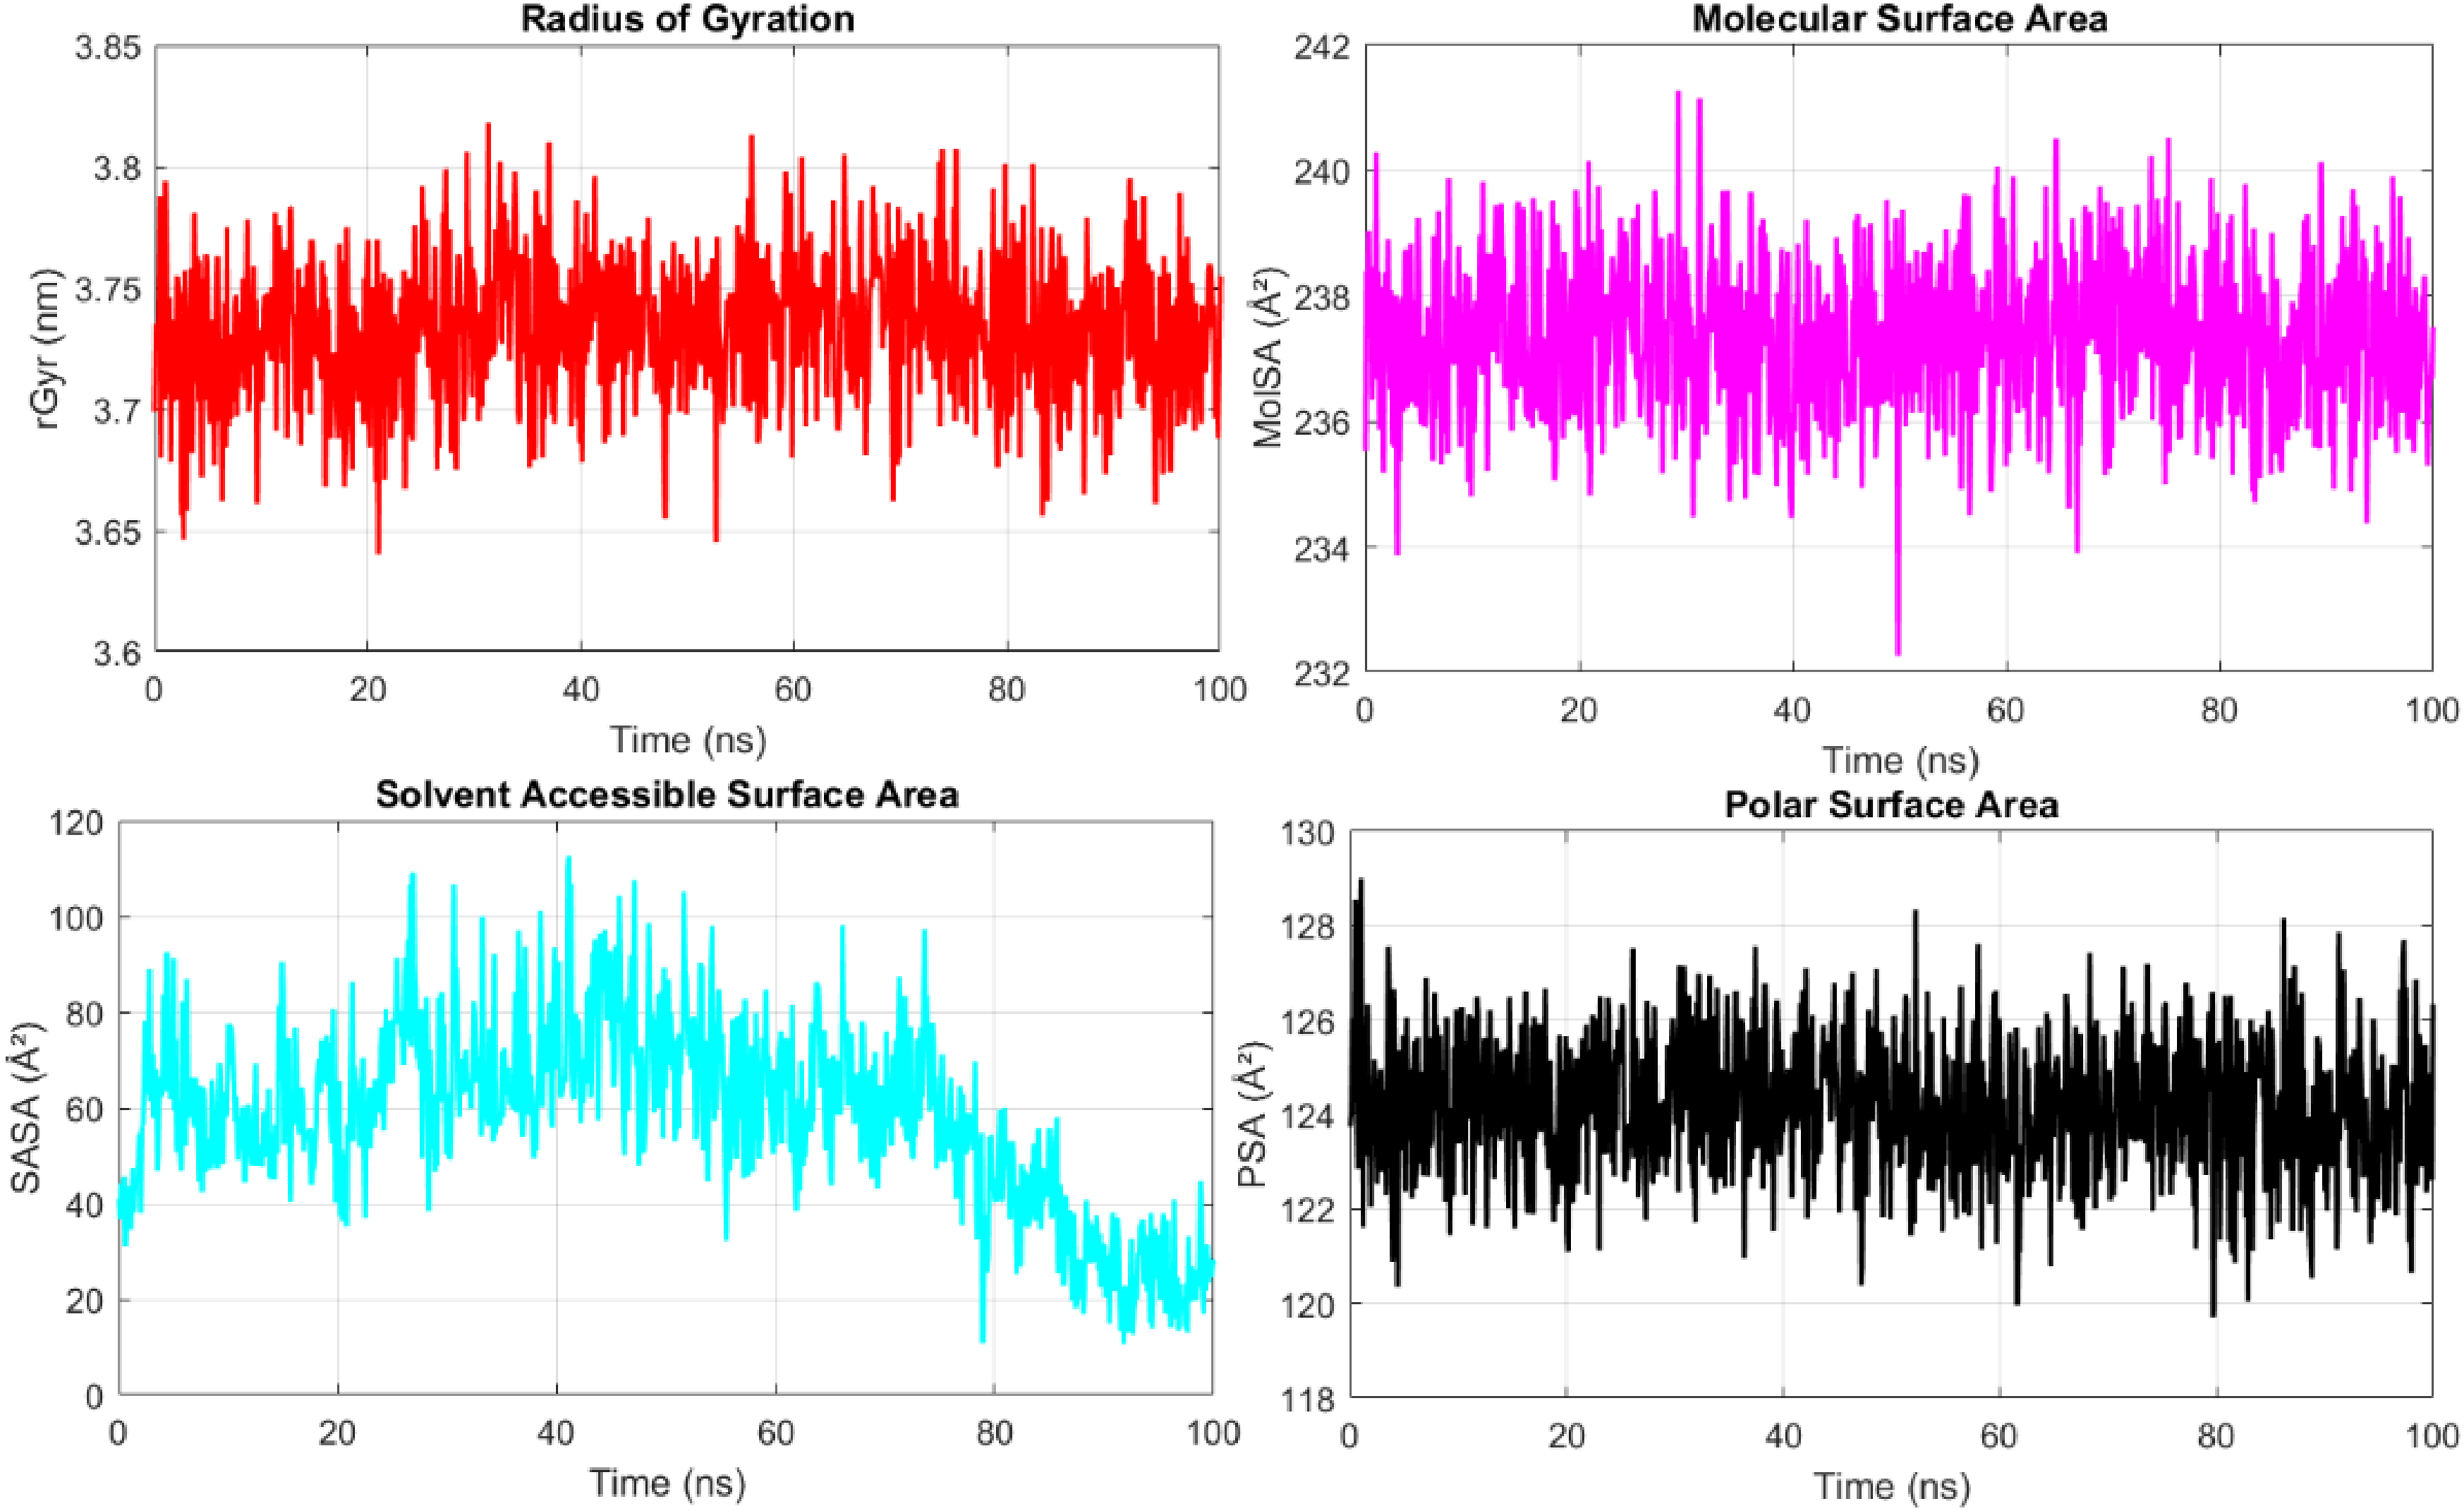
Rgyr, PSA, SASA, and MolSA Graph of the 6PYR Protein. Data were Derived from 100 ns MD Simulations Performed in Triplicate Using Desmond (Schrödinger Release 2022-3).

Rgyr, PSA, SASA, and MolSA Graph of 8EXL Protein.
Principal Component Analysis (PCA)
The PCA results for protein 6PYR reveal its conformational landscape through score distributions and variance patterns. As a key dimensionality reduction method, PCA effectively captured the protein's dynamic behavior, with the first three components (PC1 59.24%, PC2 22.92%, PC3 11.22%) collectively explaining 93.4% of total variance (Figure 13). The sharp variance drop after PC3 indicates these dimensions sufficiently represent 6PYR's structural dynamics. Distinct data clusters in the score plots suggest multiple conformational states, potentially reflecting functional variations or ligand-induced changes. The blue-to-red color gradient further highlights progressive transitions between these states, whether temporal or property-related. These findings demonstrate that 6PYR's essential motions are dominated by three primary modes of flexibility.

PCA of Compound Equol Against 6PYR Protein.
The PCA of the protein 8EXL-Equol complex revealed key insights into its conformational dynamics. The eigenvalues for the first three principal components were 36.29 (PC1), 12.71 (PC2), and 7.55 (PC3), collectively explaining 56.55% of the total variance in the system (Figure 14). These eigenvalues, representing the magnitude of motion along each principal component, demonstrated that PC1 captured the most significant collective motion of the protein complex, accounting for over a third of the total variance. The progressive decrease in eigenvalues from PC1 to PC3 indicated diminishing contributions to the overall dynamics, with each subsequent component describing more localized fluctuations. The high eigenvalue of PC1 particularly highlighted its role as the dominant mode of structural flexibility, likely corresponding to the protein's most essential functional movements. This eigenvalue-based analysis confirmed that the 8EXL-Equol complex exhibited hierarchical dynamics, where a few large-scale motions (PC1) dominated over numerous smaller vibrations, providing crucial insights into the protein's functional mechanics.

PCA of Compound Equol Against 8EXL Protein.
Residue Cross-Correlation Analysis
The dynamic cross-correlation maps (DCCM) of the 6PYR and 8EXL proteins were analyzed to understand the correlated motions of residues during the molecular dynamic simulation. The DCCM of the 6PYR-Equol complex exhibited extensive regions of both positive (cyan) and negative (magenta) correlations, indicating a higher degree of coordinated and anti-correlated motions among residues (Figure 15A). Particularly, residues around 200, 400, and 700 showed prominent anti-correlated motions with distant regions of the protein, which correlated well with the higher RMSF values observed at these residue indices. This suggested that these flexible regions were dynamically coupled with the structural rearrangements of other domains, possibly contributing to the overall instability and conformational flexibility observed in the RMSD and SASA profiles of the 6PYR-Equol complex. The widespread correlation pattern in 6PYR implied an overall less compact and more fluctuating structure.

Residue Cross-Correlation of Protein A. 6PYR and B. 8EXL.
It is worth mentioning that the DCCM of the 8EXL-Equol complex demonstrated relatively weaker and more localized correlation patterns. Most of the residues showed mild positive correlations, particularly along the diagonal, indicating that the movements of neighbouring residues were coordinated, but long-range anti-correlations were largely absent (Figure 15B). This observation aligned well with the previously observed lower RMSD and RMSF values of 8EXL, suggesting that the protein maintained a more rigid and stable conformation with minimal dynamic coupling between distant residues. The absence of significant anti-correlated motions highlighted the compactness and structural integrity of the 8EXL protein throughout the simulation.
The cross-correlation analysis reinforced the structural observations from RMSD, RMSF, and SASA data, confirming that 6PYR exhibited higher flexibility with extensive dynamic coupling, whereas 8EXL adopted a more stable and compact conformation with localized residue motions. These differential motion patterns may have influenced the binding behavior and stability of their respective complexes with ligand Equol.
MM/GBSA Calculation
The MM/GBSA analysis provided insights into the binding affinity and driving forces of Equol with proteins 6PYR and 8EXL. The 8EXL-Equol complex had significantly stronger binding free energy (−90.60 kcal/mol) compared to 86PYR (−45.66 kcal/mol), indicating a higher affinity for 8EXL. Energy decomposition revealed that lipophilic interactions were the primary stabilizing force in both systems, contributing −56.08 kcal/mol in 8EXL and −20.83 kcal/mol in 6PYR. Electrostatic interactions behaved differently; 8EXL had an unfavorable Coulombic contribution (+31.00 kcal/mol), whereas 6PYR exhibited a favorable one (−17.11 kcal/mol), suggesting electrostatic stabilization in 6PYR. Covalent contributions were minimal (3.08 kcal/mol for 8EXL, 1.85 kcal/mol for 6PYR), indicating negligible influence. Hydrogen bonding was more favorable in 8EXL (−2.23 kcal/mol) than in 6PYR (−0.642 kcal/mol), implying stronger hydrogen bond interactions in the 8EXL complex (Table 5).
MM/GBSA Calculation for 6PYR-Equol and 8EXL-Equol Complexes.

In-Vitro Anti-Inflammatory Activity
To validate the in-silico predictions, an in-vitro assessment of the anti-inflammatory potential of the Saurauia fasciculata bark extract was conducted using the inhibition of protein denaturation and membrane stabilization assays. The extract exhibited a dose-dependent inhibition of protein denaturation. The IC50 value for the extract was found to be 112.10 ± 0.57 µg/mL, compared to 75.33 ± 0.73 µg/mL for aspirin, indicating moderate anti-inflammatory activity (Figure 16A and B).

Inhibition of Protein Denaturation by Saurauia fasciculata Extract Compared with Aspirin. (A) Dose–Response Curves Showing Percentage Inhibition of Protein Denaturation at Different Concentrations (50-600 µg/mL). Data Points Represent Mean Values from Three Independent Experiments; Each Performed in Triplicate. The Extract Exhibited a Dose-Dependent Inhibitory Effect, Though Lower Than Aspirin, Across Comparable Concentrations. (B) Bar Graph of IC50 Values Derived from non-Linear Regression Analysis of the Dose–Response Curves. The IC50 of the Extract was Estimated at 112.10 ± 0.57 µg/mL, Whereas Aspirin Showed an IC50 of 75.33 ± 0.73 µg/mL. Data are Expressed as Mean ± Standard Deviation (n = 3).
Discussion
This computational study explores the potential target of inflammation and treatment from the phytoconstituents of S. fasciculata. Plants have been used for healing since ancient times, with their secondary metabolites inspiring the search for new bioactive compounds, including antioxidants, antivirals, anticancer, antibacterial, and anti-inflammatory agents. 43 In Nepal, around 2000 plant species are known for their medicinal use.44,45 Based on this ethnomedicinal knowledge, S. fasciculata was selected for this study.
Spectroscopic Characterization
We employed a sophisticated spectral instrument for the identification of phytoconstituents, which may help to treat inflammation. The spectral characterization of the extract was obtained by FT-IR and LC-MS analysis. The fingerprint region (1500-500 cm−1) and functional group region showed a complex and unique pattern of bending vibrations, which were in good agreement for some quinoid structures, indicating diverse phytochemicals, such as flavonoids or alkaloids. These results aligned with R. Yadav et al, in-vitro investigation. They revealed the extract of S. fasciculata contained a maximum TFC of 30.35 ± 0.1 mg QE/g. however, they reported the very low phenolic content (TPC = 208.33 ± 12.96 mg GAE/g extract). 15
Astragalin (m/z 447) and kaempferide (m/z 301) were detected at RT of 3.16 and 8.38 min, respectively, all of which are known for their antioxidant and anti-inflammatory properties.46,47 A similar RT was observed by N. Obaid and W. Al-Ani for Astragaline (RT = 3.95 min) from Cydonia oblonga fruit. 48 Furthermore, M. Faisal et al reported the 3.46 RT for astragalin standard. 49 The identified flavones included myricetin (RT 6.59, m/z 317), retusin (m/z 259), and 2’-methoxy-6,8-dimethylflavone (RT 5.51 min, m/z 281), which showed characteristic fragmentation ions at m/z 117 and 237. However, different studies observed the 6 to 35 min RT for myricetin in different plant extracts.50,51 Additionally, quercetin (RT 3.96 min, m/z 302) and ellagic acid (m/z 302) were detected, both of which are well-documented for their antioxidant and protective effects against oxidative stress.52,53 Arbind Kumar Choudhary et al determined 4.6 min RT of ellagic acid from the Terminalia chebula tablet in standard chromatographic conditions. 54 In contrast, the leaves of Myricaria bracteata exhibited an ellagic acid retention time of 10.6 min, using a mobile phase of methanol and 0.1% orthophosphoric acid in water (5050, v/v). 55 Epigallocatechin (m/z 305), a flavan with reported anticancer and free radical-scavenging properties, 56 was also identified. Another significant compound, Equol (RT 7.14 min, m/z 243), exhibited fragmentation ions at m/z 93, 114, 143, 149, and 163 (Figure 17). But, in a previous study, LC-MS analysis showed that Equol, a metabolite of the soy isoflavone daidzein, had a typical retention time of approximately 14.94 min. 57 Equol is known for its estrogenic activity.58–60 Furthermore, Corosolic acid (m/z 471), 6,7-dihydrocoumarin-6-glucoside (m/z 339), and 3,4-dimethoxyhydrocinnamic acid (m/z 109) were identified.

Mass Spectrum of Equol.
While LC–MS and FT-IR analyses provided important preliminary insights into the phytochemical composition of S. fasciculata, the identifications remain tentative. Without isolation and confirmatory techniques such as HR-MS and NMR, definitive attribution of bioactivity to a specific compound cannot be claimed. Therefore, the present biological interpretations should be considered hypothesis-generating. Ongoing work in our laboratory is focused on isolating the major compounds (eg, Equol and Quercetin derivatives) and performing HR-MS and NMR studies to unambiguously confirm their structures and re-evaluate their mechanistic contributions to anti-inflammatory activity.
Network Pharmacology Guided Mechanism of Action
Network pharmacology is an emerging approach that integrates systems biology and computational tools to explore the interactions between drugs, targets, and disease pathways at a holistic level. Unlike traditional single-target strategies, it focuses on multi-target mechanisms, making it especially valuable for studying complex diseases and multi-component therapies such as herbal medicines. 61 This method helps identify potential therapeutic targets, elucidate mechanisms of action, and support drug repurposing efforts. 62 From the network pharmacology approach, we were able to find the molecular target for the treatment of inflammation. The two most important proteins were identified, and their molecular mechanisms help us to validate the interaction of phytoconstituents with target proteins (PIK3R1 and PIK3CA). The PIK3R1 (regulatory subunit) and PIK3CA (catalytic subunit) proteins play pivotal roles in inflammation by modulating the PI3 K/AKT/mTOR signaling pathway. Upon activation by inflammatory stimuli (eg, cytokines or growth factors), PIK3CA phosphorylates PIP2 to PIP3, recruiting AKT and downstream effectors that promote pro-inflammatory responses, including NF-κB activation and cytokine production (eg, TNF-α, IL-6).63,64 PIK3R1 regulates this process by stabilizing the PI3 K complex and fine-tuning its activity. Dysregulation of either protein is linked to chronic inflammatory diseases (eg, rheumatoid arthritis, cancer-associated inflammation), as hyperactivation exacerbates inflammatory signaling, while inhibition attenuates immune responses.65,66 Their interplay thus serves as a critical checkpoint in balancing inflammatory outcomes (Figure 18).

MOA of Phytoconstituents Against Inflammatory Responses.
Molecular Docking
We have performed the molecular docking of 9 reported phytoconstituents against 6PYR and 8EXL proteins. Notably, phytoconstituents exhibiting multiple π interactions demonstrated stronger binding affinities, highlighting the importance of aromatic interactions in stabilizing the complexes. Equol is the most promising candidate for both PI3K-δ (6PYR) and PI3K-α (8EXL), exhibiting the strongest binding affinity and engaging in multiple stabilizing interactions. Conversely, Corosolic acid (8EXL) and 3,4-dimethoxyhydrocinnamic acid (6PYR) displayed the weakest binding affinities, suggesting limited therapeutic potential.
The protein 6PYR exhibited a greater prevalence of polar interactions, particularly hydrogen bonding and charged interactions involving Val828 and Glu826 residues. In the Equol-6PYR complex, the ligand was oriented in a manner that facilitates hydrophobic and hydrogen bond interactions with key amino acid Val828. The hydrogen bond distance was reported to be 2.4 Å. The molecular surface indicates a well-occupied binding pocket, which contributes to its relatively high binding affinity. Similarly, the 2’-methoxy-6,8-dimethyl flavone −6PYR complex demonstrated the second-best binding score of −8.7 kcal/mol and strong hydrogen bonding interactions, with Glu826 and Val828. The interaction distances of 2.0 Å and 3.4 Å suggested significant stabilization through hydrogen bonding, likely enhancing ligand affinity. Thus, Equol exhibited anti-inflammatory activity. Furthermore, Equol offers neuroprotection against inflammation-induced damage caused by LPS-activated microglia by reducing neuronal apoptosis, promoting neurite extension in N2a cells, and stimulating astrocyte-mediated production of neurotrophic factors like nerve growth factor (NGF). 67
The recurrence of certain residues in multiple ligand complexes suggests their crucial role in binding affinity and specificity. Interestingly, 8EXL displayed more hydrophobic interactions, suggesting that its binding pocket favors ligands with significant hydrophobic and aromatic character. This distinction provided valuable insights into structure-based drug design and optimization. Compound Equol exhibited the most favorable binding affinity against 8EXL (−9.1 kcal/mol). The compound Equol interacted with Lys802, forming a crucial hydrogen bond that stabilizes the complex. This was further supported by the short bond distance of 2.5 Å. The molecular conformation suggested additional π-stacking interactions between aromatic rings, which may further contribute to binding efficiency. In our docking experiments, Equol displayed binding energies of −9.0 kcal/mol against PI3K-δ (6PYR) and −9.1 kcal/mol against PI3K-α (8EXL). These values fall within the range commonly reported for PI3 K inhibitors in computational studies. For example, pictilisib and other ATP-site PI3 K inhibitors have been reported with docking scores −8 to −9 kcal/mol in published docking studies, while selective agents such as alpelisib and taselisib have been reported with more negative docking scores (−10 to −12 kcal/mol) in some in-silico screens.68,69 It is worth mentioning that compound 2’-methoxy-6,8-dimethyl flavone exhibited a binding affinity of −8.9 kcal/mol. Additionally, 2’-methoxy-6,8-dimethyl flavone-8EXL exhibited multiple stabilizing interactions, including hydrogen bonding with Glu849 (3.2 Å) and Val851 (1.8 Å). These interactions play a critical role in ligand stabilization and may influence its inhibitory potential.
Taselisib (reference drug) demonstrated a strong binding affinity with a docking score of −8.9 kcal/mol, indicating a stable and effective interaction with the target protein 8EXL (PI3K-α). It engaged several crucial amino acid residues such as Met922, Val850, Val851, Arg770, Trp780, Glu849, Tyr836, Ile848, and Ile932, which play significant roles in ligand binding and protein activity (Figure 19A). Interestingly, Equol exhibited a binding position similar to that of Taselisib against PI3K-α (8EXL), suggesting that Equol may exert its anti-inflammatory effects through competitive inhibition of the same active site. Equol suppresses inflammatory response by suppressing the expression of interleukin-6 and its receptor. 70 Additionally, Equol suppresses LPS-induced inflammatory responses in murine peritoneal macrophages by downregulating the production of nitric oxide (NO) and prostaglandin E2 (PGE2). Also, it inhibits the canonical inflammasome pathway by modulating NLRP3 expression, leading to reduced activation of pro-inflammatory cytokines IL-1β and IL-18. 71 Figure 19B represents the surface model of molecular interaction of co-crystal ligand/reference compound (P5J) against 6PYR.
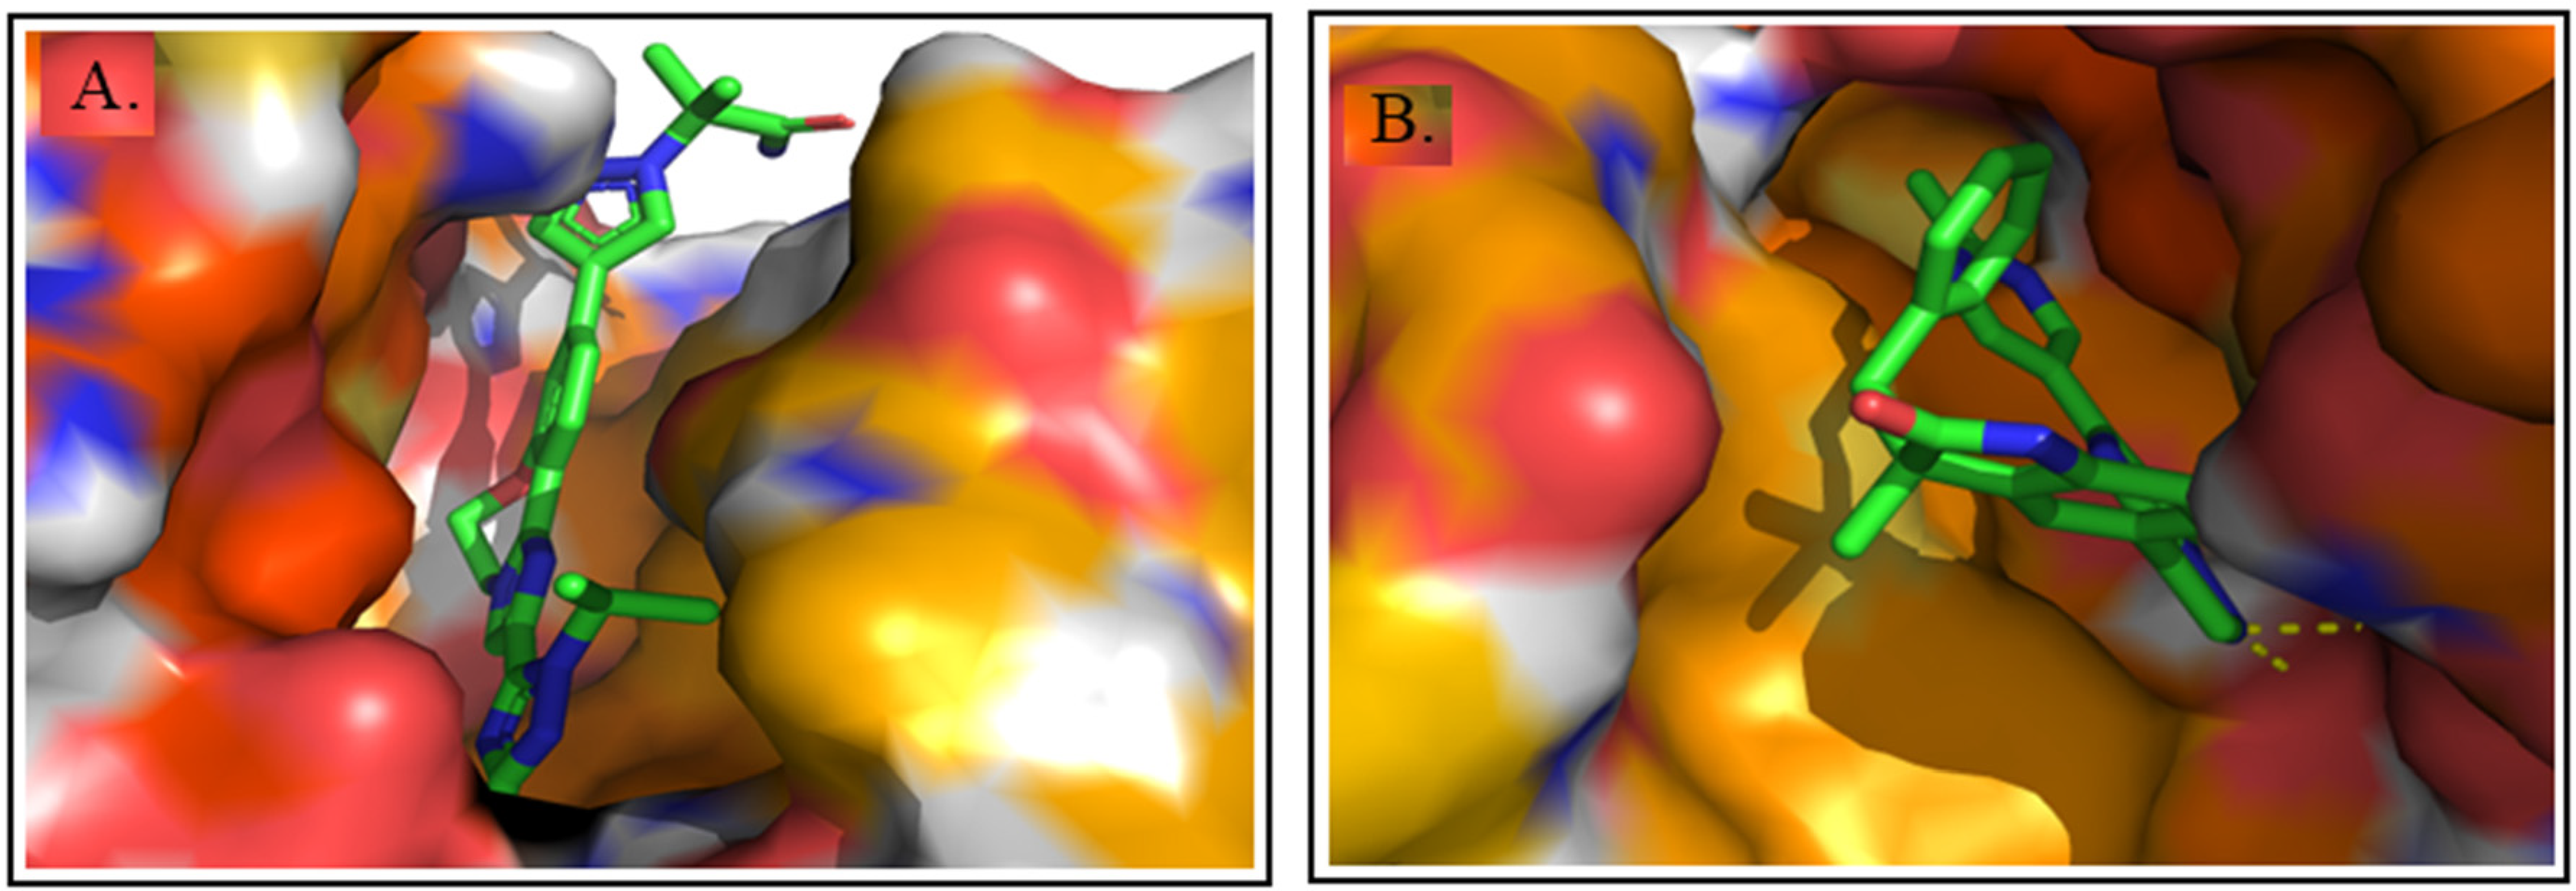
3D Molecular Interaction of Reference Drug with A. 8EXL and B. 6PYR Protein. The Surface Style Presentation is Used for Visualization.
MD-Simulation-Based Structural Stability of Protein-Ligand Complexes
MD simulation is a vital computational technique used to evaluate the stability, flexibility, and conformational behaviour of protein-ligand complexes over 100 ns. Key parameters such as RMSD, RMSF, and Rgyr are commonly analysed to understand the system's dynamic properties. Rgyr reflects the compactness of the protein structure, with consistent Rgyr values suggesting that the protein maintains its folded state throughout the simulation. 72 Together, these parameters help validate the binding stability and conformational integrity of the protein-ligand complex under physiological conditions.
The molecular dynamics simulation analysis of the Equol ligand complexed with 6PYR and 8EXL proteins was conducted to understand their structural stability and interaction dynamics. RMSD provides insight into the overall structural stability of the complex by measuring deviations from the initial structure; lower and stable RMSD values indicate a more stable interaction. The RMSD profiles revealed that the 6PYR-Equol complex exhibited higher structural fluctuations with RMSD values reaching up to 5.8 Å, whereas the 8EXL-Equol complex showed comparatively lower and stable RMSD values (2.0-3.2 Å), suggesting better conformational stability. Ligand RMSD analysis supported this observation, as Equol displayed larger positional deviations in the 6PYR complex relative to the 8EXL complex, reflecting weaker binding affinity in the 6PYR system. The Rgyr, SASA, MolSA, and PSA analyses further substantiated these results. The 6PYR-Equol complex demonstrated more significant fluctuations in Rgyr and SASA, indicating increased structural flexibility and solvent exposure. In contrast, the 8EXL-Equol complex maintained stable values throughout the simulation period.
RMSF measures the flexibility of individual amino acid residues, helping to identify regions with high mobility or structural fluctuations during the simulation. 73 In the 6PYR-Equol complex, higher fluctuations were observed, whereas in the 8EXL-Equol complex, the fluctuation was considerably dampened. This result coincided with higher SASA values, implying that solvent exposure contributed to their dynamic behaviour. This behaviour correlated with the observed instability of the 6PYR complex, where solvent-accessible and flexible regions hindered stable ligand binding.
The extract of Saurauia fasciculata bark demonstrated significant in vitro anti-inflammatory activity in both tested models. These findings support the in-silico results, where several bioactive compounds from the extract, such as Equol, Quercetin, and Kaempferol derivatives, showed strong binding affinities to key inflammatory mediators like PI3K-δ and PI3K-α in molecular docking studies.
Post-MD Simulation Study
The DCCM analysis revealed distinct dynamic behaviours between the two complexes. The 6PYR-Equol complex exhibited pronounced anti-correlated motions, particularly around residues 200, 400, and 700, which corresponded to regions of higher flexibility and solvent exposure. These anti-correlated motions suggested destabilization of the protein structure upon ligand binding. In contrast, the 8EXL-Equol complex exhibited predominantly positive correlated motions, indicating cooperative and stable residue dynamics.
The PCA of the 8EXL-Equol complex illustrated clear clustering of conformational states. The first three principal components (PC1, PC2, and PC3) accounted for approximately 56.5% of the total variance, with PC1 alone contributing 36.3%. The clustering pattern suggested distinct conformational transitions over the simulation period, indicative of structural stability and minimized fluctuation in the presence of the Equol.
The MM/GBSA binding free energy analysis further validated the dynamic and structural observations. 74 The MM/GBSA results demonstrated that the superior binding affinity of Equol towards 8EXL was predominantly driven by strong hydrophobic interactions and additional stabilizing hydrogen bonds, despite the unfavourable electrostatic contribution. In contrast, the weaker binding in the 6PYR complex was associated with reduced lipophilic and hydrogen bonding interactions, although the electrostatic component slightly favoured the binding (Figure 20).

MM/GBSA Calculation for 6PYR-Equol and 8EXL-Equol.
The integrated structural, dynamic, and energetic analyses conclusively indicated that the 8EXL-Equol complex was more stable and dynamically favorable compared to the 6PYR-Equol complex. The 8EXL-Equol complex exhibited lower flexibility, reduced solvent exposure, positively correlated motions, and a stable binding pocket, all of which contributed to a stable and effective binding of the Equol ligand. These findings suggest that the 8EXL protein serves as a more promising target for Equol binding, providing a strong basis for further experimental studies.
Pharmacokinetic Properties and Drug Likeliness Study
The partition coefficient (P) is defined as the ratio of the concentration of a substance in the nonpolar phase to its concentration in the aqueous phase at equilibrium. The logP value was derived by calculating the logarithm of this ratio. LogP, which is the logarithm of the partition coefficient, is a measure used in drug development to assess a substance's lipophilicity or hydrophobicity. It quantifies how a compound distributes between an aqueous phase (commonly octanol) and a nonpolar phase. 75 All five selected compounds exhibited an optimum LogP value. Only 2’-Methoxy-6,8-dimethyl flavone was found to be insoluble in water, with a value of −4.45. The other phytoconstituents (Myricetin, Quercetin, and Equol) were sparingly soluble in water, with values ranging from −2 to −4. The absorption of phytoconstituents through the gastrointestinal tract is affected by these three parameters. All phytoconstituents can be easily distributed throughout the body, as they exhibit an optimal volume of distribution (VD) value ranging from 0.04 to 20 L/kg. The VD value is crucial in determining the drug's half-life and how often it needs to be administered. A drug with a high VD indicates that a larger portion of the drug is distributed in the tissues than in the plasma. 76 Drug metabolism is a complex biotransformation process in which drug molecules are converted into metabolites by various metabolizing enzymes. 77 Table 3 forecasts the likelihood of a compound being metabolized by P450. All phytoconstituents acted as inhibitors of the CYP1A2 enzyme, exhibiting a moderate elimination rate of 5–15 ml/min. /kg. The predicted half-life (T1/2) for all these phytoconstituents was less than 3 h.
According to Lipinski's rule, “a compound is likely to have good oral bioavailability if it has a molecular weight less than 500 Da, fewer than 10 hydrogen bond acceptors, fewer than 5 hydrogen bond donors, and an octanol/water partition coefficient below 5”. 78 Equol, Quercetin, and 2’-methoxy-6,8-dimethyl flavone obey the rule. CaCO2 permeability is crucial for drug absorption. 79 Phytoconstituents Equol and 2’-methoxy-6,8-dimethyl flavone exhibited optimal CaCO2 permeability values, exceeding −5.15 cm/s, while the remaining phytoconstituents fell below this optimal range. All the phytoconstituents complied with Lipinski's rule of five, except for myricetin. All parameters favored the selection of Equal as the most effective anti-inflammatory agent.
Limitation
The main limitation of this study is that compound identification was based on LC–MS annotations and FT-IR functional group assignments, which are tentative in nature. Definitive confirmation requires isolation of individual compounds and structural elucidation using HR-MS and NMR spectroscopy. Furthermore, the biological activity reported here reflects the crude extract and not purified constituents; thus, correlation with specific compounds remains preliminary. Future work will involve column chromatography and preparative HPLC to isolate the major constituents, followed by HR-MS, FT-IR with detailed peak annotation, and 1D/2D NMR analyses to validate their structures and directly link them with the observed anti-inflammatory activity. IC50 values are approximate because they were derived from crude extract rather than purified compounds. Further experimental validation and optimization of potential phytoconstituents is possible. The in-vitro and in-vivo experimental research is necessary to validate these in-silico results.
Conclusion
This study provides preliminary evidence supporting the anti-inflammatory potential of Saurauia fasciculata bark extract. LC–MS profiling suggested the presence of several bioactive phytoconstituents, with Equol (docking scores −9.0 and −9.1 kcal/mol) emerging as the most promising candidate based on network pharmacology, molecular docking, and MD simulation analyses. MD simulations further validated the stability and favourable interactions of the Equol-protein complexes, particularly with the 8EXL (PIK3-α) protein. While these results are encouraging, they should be interpreted as hypothesis-generating rather than definitive. Subsequent research should focus on in vivo studies to confirm the predicted anti-inflammatory effects and to elucidate the precise mechanisms of action.
Supplemental Material
sj-docx-1-npx-10.1177_1934578X251395905 - Supplemental material for LC-MS Profiling and Anti-Inflammatory Activity of Saurauia fasciculata Bark: Network Pharmacology, Molecular Docking, MD Simulation, and in-Vitro Validation
Supplemental material, sj-docx-1-npx-10.1177_1934578X251395905 for LC-MS Profiling and Anti-Inflammatory Activity of Saurauia fasciculata Bark: Network Pharmacology, Molecular Docking, MD Simulation, and in-Vitro Validation by Shankar Thapa, Rupesh Kumar Mani, Santosh Prasad Chaudhary Kurmi, Somashekhar Metri, Priyanka Tiwari, Priyanka Kamaria, Sibghatullah Muhammad Ali Sangi, Sreeharsha Nagaraja and Bipindra Pandey in Natural Product Communications
Footnotes
Acknowledgements
We thank Honeychem Pharma Research Pvt Ltd, Bengaluru, India, and Nargund College of Pharmacy, Bengaluru, India for providing the facilities of spectral analysis.
Author Contribution
Shankar Thapa: Conceptualization, Methodology, Data analysis, Visualization, LC-MS Spectral analysis, Software, MD simulation, original manuscript preparation; Rupesh Kumar Mani, Santosh Prasad Chaudhary Kurmi, and Somashekhar Metri: Methodology, Visualization, Data aquation, Docking, and Editing; Bipindra Pandey, Priyanka Tiwari, and Priyanka Kamaria: Formal analysis, Visualization, and Reviewing & Editing; Sibghatullah Muhammad Ali Sangi, and Sreeharsha Nagaraja: Revision, In-vitro assay result validation, Analysis, and Visualization.
Patient Consent Statement
This study does not involve experiments on animals or human subjects.
Funding
This work was supported by the Deanship of Scientific Research, Vice Presidency for Graduate Studies and Scientific Research, King Faisal University, Saudi Arabia [Grant No. KFU253182].
Declaration of Conflicting Interests
Figures 1 and 18 are drawn by the authors.
Data Availability Statement
All the data is provided within the manuscript and supplementary file.
Supplemental Material
Supplemental material for this article is available online.
References
Supplementary Material
Please find the following supplemental material available below.
For Open Access articles published under a Creative Commons License, all supplemental material carries the same license as the article it is associated with.
For non-Open Access articles published, all supplemental material carries a non-exclusive license, and permission requests for re-use of supplemental material or any part of supplemental material shall be sent directly to the copyright owner as specified in the copyright notice associated with the article.