
Abstract
Objective
The aim of this work was to evaluate the effects of the mixture of Cissus polyantha and Rytigynia senegalensis (CPRS) on hepatorenal function and oxidative and hematological profiles of diabetic rats.
Methods
Diabetes was induced by a high-fat diet and streptozotocin (35 mg/kg). Diabetic rats were divided into groups as follws: Groups 1 and 2 received distilled water each; Group 3 received metformin (40 mg/kg); Groups 4 and 5 received CPRS (50 and 111 mg/kg, respectively). Hepatorenal biomarkers, oxidative profile, and hematological parameters were evaluated.
Results
CPRS caused a decrease (p < .05 to p < .001) in transaminases activity associated with an increase in total bilirubin (p < .05). CPRS caused a decrease (p < .05 to p < .001) in urea, uric acid, and creatinine levels. Reduced glutathione level and the activity of catalase and superoxide dismutase were increased (p < .05 to p < .001) while malondialdehyde level was decreased (p < .05 to p < .01) in the liver and kidneys of animals treated with metformin and CPRS (50 and/or 111 mg/kg). The red blood cells count and their distribution indices increased (p < .05 to p < .001) while those of white blood cells and platelets decreased (p < 0.05 to p < .001) in treated diabetic rats.
Conclusions
CPRS therefore has antioxidant, hepatoprotective, and nephroprotective properties, and improves the hematological profile of diabetics.
Introduction
Diabetes mellitus is a metabolic disorder characterized by chronic hyperglycemia linked to a deficiency either in the secretion of insulin (diabetes type 1) or in the action of insulin (diabetes type 2). 1 Diabetes can lead to long-term complications that can affect the heart, blood vessels, eyes, nerves and genitals. Globally, diabetes affected about 589 million adults aged 20–79 in 2024. 2 The total number of people living with diabetes is projected to reach 853 million by 2050, an increase of 45%. 2 It is also estimated that more than 3.4 million people aged 20–79 years died from diabetes-related causes in 2024. 2 The aim of antidiabetic treatments is to reduce hyperglycaemia by activating endogenous insulin secretion with sulfonylureas and glitinides or by improving the sensitivity of target tissues to insulin with thiazolidinediones and biguanides. However, these pharmaceutical products have the disadvantage of being expensive and can also have harmful side effects and numerous contraindications. 3 Beyond these constraints, the most affected people living in poor countries do not have easy access to appropriate technical platforms in the event of diabetes-related complications. The WHO has thus encouraged third world countries to give a large part to their traditional pharmacopoeia; hence the use of phytotherapy as an alternative treatment. 4
Phytotherapy, which is the art of healing with plants, has been known and practiced in Africa for a long time, because it uses knowledge transmitted orally from generation to generation to certain categories of initiated individuals such as traditional healers and herbalists. 4 The use of herbal medicine for several centuries has led to the discovery of molecules that can treat diabetes mellitus. Many plants such as Eucalyptus globulus, 5 Lactuca taraxacifolia, 6 Combretum molle, 7 Ficus vallis-choudae 8 and many others have already shown their effectiveness in the treatment of diabetes.
C. polyantha Glig and Brandt known as Manda, is a plant of the Vitaceae family, used in traditional African medicine to treat pain, diabetes, inflammation and microbial diseases. 9 It is a climbing vine with simple tendrils and compound leaves with lateral leaflets. The cymes are compact, opposite the leaves or placed next to the leaves of the main branches. The flowers are in umbelliform cymes, the calyx is serrated, the petals free, the hooded apex fused to the base of the bilocular ovary, the stigma is very small with a berry as its fruit. 10 R. senegalensis Blume known as Delbi, is a plant of the Rubiaceae family and recognized in traditional African medicine for its hypotensive, antidiabetic and antimicrobial effects and for facilitating childbirth.10,11 It is a climbing vine with gray bark. Its leaves are opposite, oval or elliptical, the branches glabrous and lenticellate. Its flowers are white, in axillary panicles, the pedicels shorter than the peduncles. Its fruits are about 1 cm in diameter and ellipsoid. 12 Previous studies showed showed that R. senegalensis and C. polyantha contains classes of chemical compounds such as polyphenols, alkaloids, flavonoids, tannins, and saponins.13,14 Additionally, compounds such as isoliquiritigenin, quercetin, and β-sitosterol have been isolated from Cissus polyantha.15,16 Mahamad et al13,17 and Maidadi et al11,14 proved the antidiabetic potential of C. polyantha and R. senegalensis, respectively. However, no scientific study has yet been carried out on the mixture of these two plants. The general aim of this work was therefore to evaluate the pharmacological effects of the aqueous extract of the mixture of Cissus polyantha and Rytigynia senegalensis (CPRS) on the glycemia, oxidative profile, biomarkers of hepatic and renal functions as well as the hematological parameters of diabetic rats.
Methods
Chemicals and Drugs
Sodium chloride, disodium hydrogen phosphate, D-glucose, and sodium hydroxide were provided by Edu-Lab Biology Kit (Bexwell, UK). Biochemical kits, streptozocin, and rat insulin ELISA kit were provided by Sigma-Aldrich (St. Louis, USA). Metformin, diazepam, and ketamine were bought at the local pharmacy. All chemicals were of analytical grade.
Plants
The plant material consisted of leafy stems of Cissus polyantha and Rytigynia senegalensis, harvested in July 2022 in Maroua (Far North, Cameroon). A sample of each of these plants was identified at the National Herbarium of Yaoundé and registered under the reference number 44346/HNC for C. polyantha and HNC4496/SRFK for R. senegalensis. Each of these plants was washed in tap water, dried in the shade at room temperature for 21 days and then ground in a mortar to obtain a powder.
The aqueous extract of plants was prepared according to the procedure described by Otunola & Afolayan with slight modifications. 18 One hundred grams (100 g) of C. polyantha powder and 100 g of R. senegalensis powder were mixed and introduced into 1000 mL of distilled water previously brought to a boil. After 45 min, the mixture was filtered using Wattman No. 1 paper and the filtrate obtained was evaporated in an oven at 45 °C. Seventy-two hours later, 25.61 g of crude extract were obtained with a yield of 12.81%.
Animals
Male rats (40) of the Wistar strain, aged between 10 and 12 weeks and weighing between 180 and 200 g, were provided by the animal facility of the Animal Physiology Laboratory of the University of Yaoundé I (Cameroon). They were kept in plastic cages containing wood chips renewable every two days in a ventilated room with 12-h lighting. They received ad libitum drinking water and standard food. The experimental rats were acclimatized for one week to laboratory conditions before the start of the experiment. The experiments were conducted in accordance with the guidelines of the Cameroon Bioethics Committee (No. FWAIRB00001954) and the ARRIVE 2.0 guidelines. They were approved by the Bioethics Advisory Commission of the Faculty of Sciences, University of Maroua (No. 0025/022/Uma/D/FS/VD-RC) and by the ARRIVE 2.0 committee according to the 3R principles (replace, educate, and refine) for animal experimentation (No. F/59A/23). 19
Induction of Diabetes
Forty (40) rats were divided into 2 groups and treated for 30 days. The first group (n = 5) received a standard diet (SD) consisting of 5% fat, 52% carbohydrates, and 20% protein. The second group (n = 35) received a high fat diet (HFD) composed of lipids (58%), carbohydrates (17%), and proteins (25%). 20 On the 31st day, the rats of group 2 received an intraperitoneal injection of the streptozotocin solution (35 mg/kg) while those of group 1 received, by the same route, an injection of the citrate buffer solution (2 mL/0.1 kg). 21 One hour later, the rats of groups 2 and 1 received by gavage, respectively a solution of D-glucose (2 mg/kg) and distilled water (10 mL/kg). Three days later, fasting blood glucose was assessed, and animals with a blood glucose level greater than or equal to 200 mg/dL were considered diabetic and selected for the experiment. 22
Distribution and Treatment of Animals
Twenty-five (25) rats were divided into 5 groups of 5 animals each, and treated daily orally for 21 days. 9 Group 1 (normal control) received SD + Distilled water (10 mL/kg); Group 2 (diabetic control) received HFD + Distilled water (10 mL/kg); Group 3 (positive control) received HFD + Metformin (40 mg/kg) 11 ; Group 4 (test 1) received HFD + CPRS (50 mg/kg); Group 5 (test 2) received HFD + CPRS (111 mg/kg). The doses of CPRS were determined from the work carried out by Mahamad et al 17 and Maidadi et al. 11
Blood and Organ Collection
Animals were fasted for 24 h and then anesthetized with ketamine (10 mg/kg) and diazepam (5 mg/kg) and sacrificed by cervical decapitation. Blood was collected from the jugular vein and placed in dry tubes and centrifuged at 3000 rpm for 15 min for the measurement of biochemical parameters. On the other hand, blood was placed in EDTA tubes to evaluate hematological parameters.
The liver and kidney were removed, then freed from adipose tissue and cleaned in 0.9% NaCl. A portion of each of these organs was preserved in 10% formalin for histological sections. The other portion was homogenized at 10% in a tris buffer solution (0.2 M; pH 7.4). The homogenate was centrifuged at 3000 rpm for 15 min and the supernatant obtained was stored at 20 °C for the assay of oxidative stress parameters.
Total protein Assay
Total protein content was measured by the Bradford method using crystalline BSA (bovine serum albumin) as a standard. Briefly, 750 µL of Bradford reagent was added to 15 µL of homogenate or BSA. The absorbance of the supernatant was read at 595 nm after 5 min of incubation. 23
Reduced Glutathione Assay
A volume of 0.5 mL of the homogenate or standard was added to 1.5 mL of phosphate buffer (0.1 M; pH 7.0), 0.1 mL of 5,5-dithiobis- 2-nitrobenzoic acid (0.01 mol/L) and 7.9 mL of methanol. The mixture was incubated for 30 min at 37 °C and then centrifuged at 3000 rpm for 15 min. The absorbance of the supernatant was measured at 340 nm. The GSH level was expressed in nanomoles of oxidized GSH per minute per milligram of protein (nmol GSH/min/mg of protein). 24
Malondialdehyde Assay
To 250 µL of tissue homogenate was added 125 µL of trichloroacetic acid (20%) and 250 µL of thiobarbituric acid (0.67). The reaction medium was homogenized and heated to 90 °C in a water bath for 10 min, then cooled with tap water and centrifuged at 3000 rpm at room temperature for 15 min. The absorbance of the supernatant was read at 530 nm against the blank. MDA concentration was estimated in nanomoles of MDA per milligram of protein (nmol MDA/min/mg protein). 25
Catalase Assay
To each test tube containing 25 µL of tissue homogenate were added 375 µL of phosphate buffer (0.01 M; pH = 7.4) and 100 µL of H2O2 (50 mM). One minute later, 1 mL of perchloric acid was introduced into the reaction medium. The tubes were then incubated for 10 min in a water bath and then cooled in tap water. The optical densities were read at 570 nm after 30 s and 90 s against blank. The enzymatic activity of catalase (CAT) expressed in units per milligram of protein (U/mg of protein). 26
Superoxide Dismutase Assay
A volume of 140 µL of homogenate or standard was added to 1660 µL of carbonate buffer (75 mM; pH = 10.2), 0.1 mL of EDTA (30 mM) and 200 µL of adrenaline (0.3 mm) then the mixture was homogenized. Adrenaline oxidation was measured by reading the optical density (480 nm) at t = 30 s and t = 90 s against blank. The blank was prepared with 140 µL of distilled water, 1660 µL of carbonate buffer and 200 µL of adrenaline solution. SOD activity was expressed in units of SOD per milligram of organ (U SOD/mg protein). 27
Evaluation of Markers of Liver and Kidney Function
Serum levels of total protein, total bilirubin, urea, uric acid, and creatinine, and activities of alanine aminotransferase (ALT), aspartate aminotransferase (AST), and alkaline phosphatase (ALP) were evaluated using the colorimetric assay kit (Chronolab) and following the methods described respectively by Bradford, 23 Van Roy, 28 Torres et al, 29 Trivedi et al, 30 Jaffe, 31 Reitman and Frankel, 32 Reitman and Frankel, 32 and Brandely et al. 33
Evaluation of Hematological Profile
Hematological parameters such as white red blood cells (RBC), hemoglobin (HBG), hematocrit (HCT), corpuscular hemoglobin content (MCH), mean corpuscular volume (MCV), mean corpuscular hemoglobin concentration (MCHC), blood cells (WBC), granulocytes (GRA), lymphocytes (LYM), monocytes (MON), platelet count (PLT), platelet distribution index (PDW), mean platelet volume (MPV), and plateletcrit (PCT) were assessed using an automatic analyzer (Procan Electronics Inc).
Histological Analysis of the Liver and Kidneys
Hepatic and renal tissues were fixed in formalin 10% and then dehydrated in in baths of alcohol of increasing concentration, toluene, and paraffin melted. Once the paraffin cooled, the tissue blocks were placed in the freezer at −20 °C for hardening then fixed on the microtome (Thermo Electron Corporation, England) and cut at 5 µm thickness. The sections were stained with hematoxylin and eosin then mounted on the slides using Canada balsam and observed under an Olympus brand microscope at 250 magnifications. The photomicrographs were taken using a device (Olympus type) mounted on the microscope. 34
Statistical Analysis
All results were expressed as the mean ± SEM (Standard Error of the Mean). The data obtained was analyzed using Graph Pad Prism software version 8.03. One-way analysis of variance and Turkey's posttest were used to analyze the data and determine significant differences between the different groups. Significant differences were considered at the 0.05 probability threshold.
Results
Effects of CPRS on Oxidative Status
SOD activity was significantly decreased in the liver (P < .001) and kidney (P < .01) of rats in the negative control group, compared with the normal control group. In contrast, in the positive control group and those treated with CPRS doses, SOD activity was significantly increased (P < .05), compared to the diabetic control group (Table 1).
Effects of CPRS on the Oxidative Profile in Diabetic Animals.

Each value corresponds to the mean of 5 animals ± SEM. αP < .05; βP < .01; λP < .001 statistically significant compared to normal control group. aP < .05; bP < .01; cP < .001 statistically significant compared to diabetic control group. CPRS: aqueous extract of a mixture of Cissus polyantha and Rytigynia senegalensis, MDA: malondialdehyde, GSH: reduced glutathione, CAT: catalase, SOD: superoxide dismutase.
Compared with the normal control group, CAT activity was significantly decreased (P < .001) in rats in the diabetic control group. However, compared with the negative control group, a significant increase in CAT activity was observed in the liver and kidney of diabetic animals treated with metformin (P < .01; P < .05) and doses of 50 (P < .05; P < .01) and 111 mg/kg (P < .05; P < .001) of CPRS, respectively (Table 1).
GSH levels were significantly decreased (P < .01) in both organs of animals in the diabetic control group, compared with the normal control group. In contrast, administration of the different treatments resulted in an increase (P < .01) in GSH levels in the kidney of rats. In the liver, only the 111 mg/kg dose of CPRS caused an increase (P < .05) in GSH concentration (Table 1).
A significant increase in MDA levels was observed in the liver (P < .001) and kidney (P < .05) of untreated diabetic animals, compared with the neutral control group. However, compared with the diabetic control group, MDA levels were significantly decreased in the liver of rats treated with metformin (P < .01) and with doses of 50 (P < .01) and 111 mg/kg of CPRS (P < .001). However, only the dose of 111 mg/kg of CPRS markedly increased MDA levels in the kidney of rats (Table 1).
Effects of CPRS on Glycemia and Markers of Hepatorenal Function
The effects of CPRS on blood glucose and hepatorenal markers are presented in Table 2. Indeed, a significant increase (P < .001) in blood glucose and ALT, AST and ALP activities and a significant decrease (P < .01) in TB levels were observed in the untreated diabetic rat group, compared with the normal control group. On the other hand, a significant decrease (P < .001) in blood glucose was recorded in rats treated with different doses of CPRS, compared with the diabetic control group. Similarly, the activities of all transaminases decreased significantly with the positive control group (P < .05) and the doses of 50 (P < .01) and 111 mg/kg (P < .001) of CPRS. In addition, total bilirubin levels increased (P < .05) at 50 and 111 mg/kg of CPRS. Total protein levels were almost similar in all animal groups (Table 2).
Effects of the CPRS on Glycemia and Markers of Hepatorenal Function in Diabetic Animals.

Each value corresponds to the mean of 5 animals ± SEM. βP < .01; λP < .001 statistically significant compared to normal control group. aP < .05; bP < .01; cP < .001 statistically significant compared to diabetic control group. CPRS: aqueous extract of a mixture of Cissus polyantha and Rytigynia senegalensis, ALT: alanine aminotransferase, AST: aspartate aminotransferase, ALP: alkaline phosphatase, BT: total bilirubin, TP: total protein.
Animals in the negative control group showed a significant increase in urea (P < .01), uric acid (P < .001) and creatinine (P < .001) levels, compared with the normal control (Table 2). In contrast, rats receiving the reference product and CPRS doses showed a significant decrease (P < .001) in uric acid and creatinine levels. As for urea, the decrease in its level was less significant with metformin (P < .01) and the doses of 50 (P < .05) and 111 mg/kg (P < .05) of CPRS (Table 2).
Effects of CPRS on RBC Count and Its Distribution Indices
Table 3 shows the effects of CPRS on RBC count and its distribution indices. It shows that the levels of RBC, HCT, and MCH was significantly decreased (P < .01) in the diabetic control group, compared with the normal control group. In the same group of animals, the decrease was more significant (P < .001) for hematological parameters such as HGB, MCV, and MCHC. However, a significant increase in the level of RBC and MCH was observed in rats given metformin (P < .01; P < .05) and CPRS at 50 (P < .05; P < .01) and 111 mg/kg (P < .01; P < .001), respectively. Similarly, CPRS and metformin caused a significant increase in HCT (P < .05), HGB (P < .001), MCV (P < .01) and MCHC (P < .001) levels.
Effects of the CPRS on RBC Count and its Distribution Indices in Diabetic Rats.

Each value corresponds to the mean ± SEM (n = 5). βP < .01; λP < .001 statistically significant compared to normal control group. aP < .05; bP < .01; cP < .001 statistically significant compared to diabetic control group. CPRS: aqueous extract of a mixture of Cissus polyantha and Rytigynia senegalensis, RBC: red blood cells, HCT: hematocrit, HGB: hemoglobin, MCV: mean corpuscular volume, MCH: mean corpuscular hemoglobin content, MCHC: mean corpuscular hemoglobin concentration.
Effects of CPRS on WBC Count, PLT Count and Its Distribution Indices
Table 4 shows the effects of CPRS on leukocyte count and its distribution indices. In the diabetic control group, there was a significant increase in the number of WBC (P < .001), lymphocytes (P < .001), monocytes (P < .05), and granulocytes (P < .001), compared with the normal control group. There was a significant decrease in the number of leukocytes with metformin (P < .001) and CPRS at 50 (P < .05) and 111 mg/kg (P < .01), compared with the diabetic control group. The number of lymphocytes was significantly decreased in the groups of animals treated with metformin (P < .01) and at doses of 50 (P < .01) and 111 mg/kg (P < .001) of CPRS. Similarly, CPRS at 50 and 111 mg/kg caused a significant decrease in the number of monocytes (P < .01) and granulocytes (P < .01).
Effects of the CPRS on WBC Count, PLT Count and its Distribution Indices in Diabetic Rats.
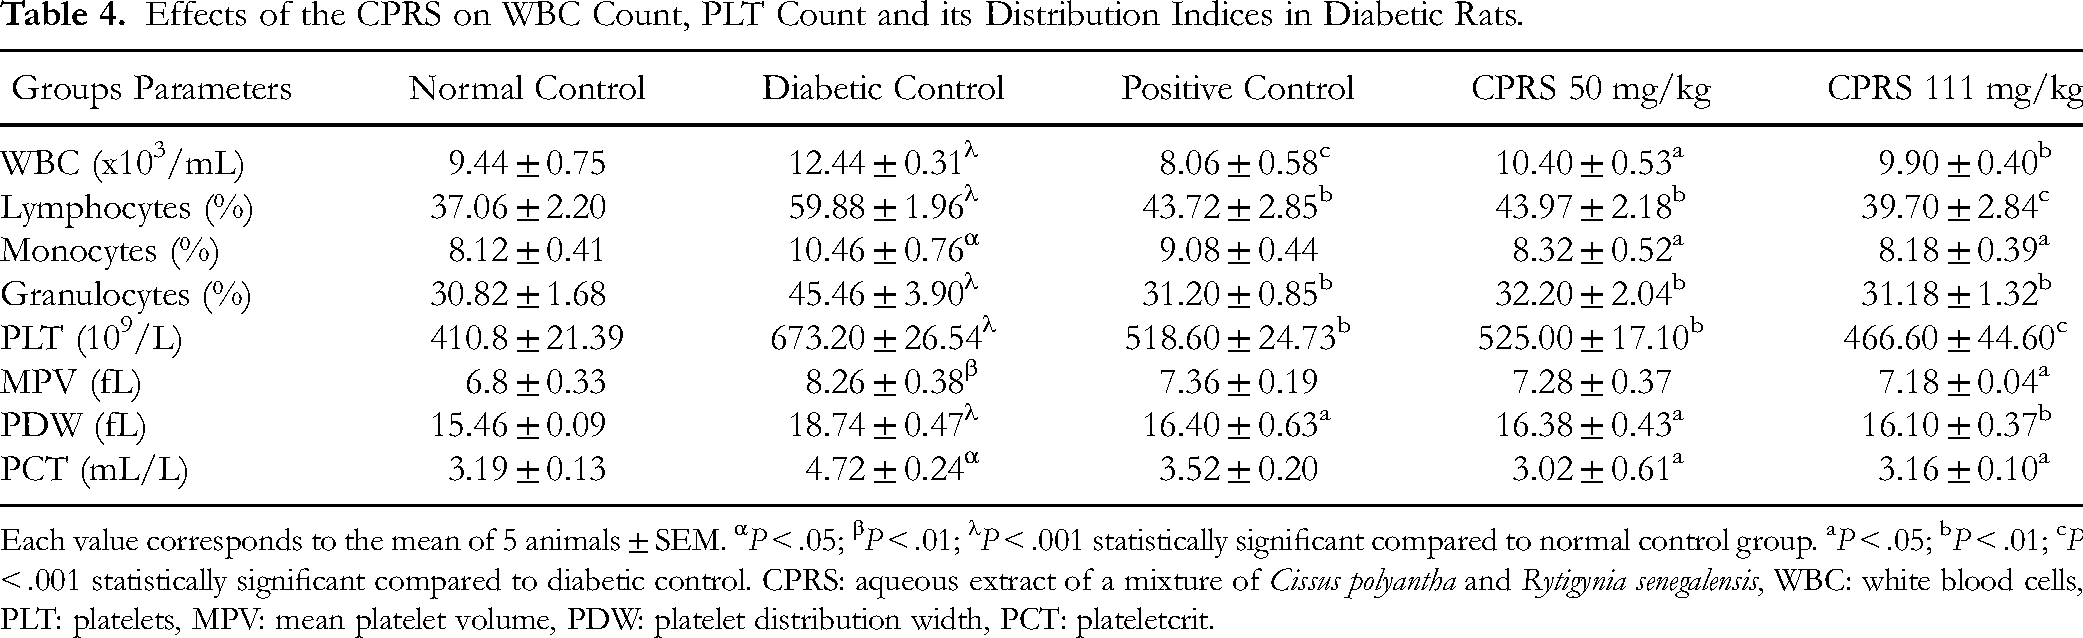
Each value corresponds to the mean of 5 animals ± SEM. αP < .05; βP < .01; λP < .001 statistically significant compared to normal control group. aP < .05; bP < .01; cP < .001 statistically significant compared to diabetic control. CPRS: aqueous extract of a mixture of Cissus polyantha and Rytigynia senegalensis, WBC: white blood cells, PLT: platelets, MPV: mean platelet volume, PDW: platelet distribution width, PCT: plateletcrit.
In the diabetic control group, there were significant increases in PLT (P < .001), MPV (P < .01), PCT (P < .001), and PDW (P < .05) levels, compared with the normal control group (Table 4). On the other hand, compared with the diabetic control group, PLT and PDW levels were significantly increased in animals receiving metformin (P < .01; P < .05) and CPRS at 50 (P < .01; P < .05) and 111 mg/kg (P < .001; P < .01), respectively. In addition, MPV and PCT levels were significantly increased (P < .05) with different doses of CPRS (Table 4).
Effects of CPRS on Liver Histology
Histological analysis of the liver of animals from the normal control group revealed a normal microstructure of the parenchyma presenting the portal vein, the hepatic artery, the bile canaliculi and the sinusoid capillaries. In comparison with the normal control, it was observed in the liver of the rats of the diabetic control group, slight leucocyte infiltrations (blue arrow) at the level of the portal vein. The latter were reduced after treatment of the experimental animals with the reference substance and CPRS at different doses (Figure 1).

Photomicrographs of Liver Tissue (X250; H-E). A = Normal Control, B = Diabetic Control, C = Positive Control, D = CPRS 50 mg/kg, E = CPRS 111 mg/kg. PV = Portal Vein, H = Hepatocyte, CS = Capillary Sinusoid, HA = hepatic Artery, CV: Centrilobular Vein, Il = Leukocyte Infiltration ().
Effects of CPRS on Kidney Histology
Observation of the histological section of the kidneys shows a normal architecture illustrating the glomerulus, the proximal convoluted tubule, the distal convoluted tubule and the urinary space in all the animals of the normal control group (Figure 2). However, in the diabetic control group, there is a slight infiltration of leukocytes (blue arrow) characterized by an increase in the volume of the glomerulus. The size of the glomeruli of animals treated with metformin and CPRS (111 mg/kg) was almost similar to that of the glomeruli of normal rats.
Photomicrographs of Kidney Tissues (X250; H-E). A = Normal Control, B = Diabetic Control, C = Positive Control, D = CPRS 50 mg/kg, E = CPRS 111 mg/kg, G = Glomerulus, Us = Urinary Space, DCT = Distal Convoluted Tubule, PCT = Proximal Convoluted Tubule, Il = Leukocyte Infiltration ().
Discussion
Diabetes mellitus is a group of metabolic diseases characterized by chronic hyperglycemia resulting from a defect in insulin secretion, insulin action or both associated abnormalities. 35 The increase in the prevalence of diabetes is observed all over the world, both in industrialized and developing countries. 36 For a long time, natural resources have been a main source of traditional pharmacopoeia and remain the main source for obtaining new active molecules in the pharmaceutical field.
In this study, a significant decrease in blood sugar levels was noted after administration of CPRS to diabetic animals. The observed hypoglycemic effect would be the consequence of the presence in CPRS of chemical compounds such as polyphenols, alkaloids, flavonoids, tannins, and saponins.13,14 These compounds act on carbohydrate metabolism by several mechanisms of action such as inhibition of digestion and absorption of carbohydrates at the intestinal level, stimulation of pancreatic β-cells to secrete insulin, improvement of peripheral glucose utilization.37,38
Oxidative stress is an inequality of reactive oxygen species (ROS) with antioxidants, occurring when the net amount of ROS exceeds the antioxidant potential. Thus, oxidative stress can occur due to a general increase in ROS generation, a collapse of antioxidant systems, or both. 39 It is well established that hyperglycemia leads to increased production of ROS, which leads to oxidative stress in diabetics. 40 SOD is an enzyme capable of scavenging the superoxide anion free radical produced by univalent oxygen reduction. 41 CAT is an enzyme that converts hydrogen peroxide into oxygen and water. In the present work, metformin and CPRS (50 and 111 mg/kg) caused a significant increase in the activity of SOD and CAT in the liver and kidneys of diabetic rats. These results are similar to those obtained by Ampa et al 42 who showed that the hydro-ethanolic extract of the leaves of Trilepisium madagascariense caused an increase in the activity of SOD and CAT. Several researchers have shown that the overexpression of antioxidants such as GSH, SOD and CAT can protect the liver and kidneys against oxidative stress and provide protection against the deleterious effects of hyperglycemia. 43
GSH plays a unique and essential role in the preservation of the active forms of various small antioxidants (vitamins C, E, ubiquinone, polyphenols). It is the body's main antioxidant, especially as it is also the co-factor of antioxidant enzymes such as glutathione peroxidase and glutathione reductase. 44 In this study, renal glutathione levels increased with different doses of CPRS. These results are in agreement with those of Kolefer et al 8 who worked on the aqueous extract of the leaves of Tapinanthus dodoneifolius. The increase in GSH levels by CPRS would be the consequence of a relative stability between ROS and the active forms of the various antioxidants. 17 Indeed, some plant extracts contain antioxidant molecules that capture free radicals in order to isolate their single electrons and transform them into ions or stable molecules. 45
MDA is an end product of lipid peroxidation. The level of MDA was significantly increased in the animals of the negative control group, both in the liver and in the kidneys. Hamma et al 46 showed that type 2 diabetes is accompanied by a profound decline in antioxidant defenses and an increase in lipid peroxidation, reflecting a state of profound oxidative stress. This marked increase in lipid peroxidation levels in liver and kidney tissues of diabetics suggests an accumulation of oxygen free radicals which may be due to either increased production and/or reduced elimination. 47 However, the significant drop in MDA levels in diabetic animals shows that CPRS (50 and 111 mg/kg) limited lipid peroxidation, most likely by reducing the cellular redox potential. 48
Increased activity of AST, ALT, and ALP enzymes have been used as markers of liver dysfunction. Hepatocyte injury causes the alteration of liver cell membrane permeability and consequently, transaminases (ALT and AST) are released into the circulation. 49 In addition, ALP is bound to the membrane and its alteration is likely to affect membrane permeability and produce a disturbance in the transport of metabolites. 50 Treatment of diabetic rats with CPRS caused a reduction in enzyme activity (AST, ALT, ALP) which may be due to the ability of CPRS to heal damaged liver cells. 51 It may also be due to the ability of CPRS to accelerate liver cell regeneration, thereby reducing the leakage of marker enzymes into the blood of rats. 52 These results were also confirmed by a slight leucocyte infiltration observed in the hepatic tissue of diabetic animals, which gradually decreases after the administration of metformin and the different doses of CPRS. The results of Soliman were in agreement with those of the present study. 53
In case of chronic hyperglycemia, bilirubin levels are reduced in the blood of diabetic rats. Bilirubin, an end product of heme catabolism, has been shown to possess the ability to scavenge free radicals and prevent inflammation. 54 The increase in total bilirubin levels in treated diabetics also enhanced the high antioxidant capacities of CPRS.
Decreased total serum protein levels in diabetic rats may be due to elevated muscle protein breakdown, decreased amino acid uptake, increased glycogenic conversion of amino acids to carbon dioxide and in water, in addition to reduced protein biosynthesis and absorption. 55 In the present work, the total protein level did not experience any significant variation, CPRS would not have an effect on the protein level.
Urea, uric acid, and creatinine are by-products of metabolism that are eliminated from the body by the kidneys. Their increased serum concentration in diabetics could be due to the inability of an impaired kidney to remove them from the blood. 56 In the present study, the increase in these parameters indicates kidney damage in untreated diabetic animals. These results were also confirmed by a slight leukocyte infiltration observed in the renal tissue of the animals in the negative control group. However, metformin and CPRS (50 and 111 mg/kg) attenuated the remarkable increase in creatinine, urea and uric acid levels. This may be due to the protective action of CPRS, possibly via its antioxidant effect in reversing diabetes-induced kidney damage. Our results are consistent with other studies that have recorded a progressive decrease in renal dysfunction. 53 It can be suggested that some of the many phytochemicals present on the one hand in C. polyanta and on the other hand in R. senegalensis, have protective effects on liver and kidney cells.
Maidadi et al 11 obtained almost the same results below with the aqueous extract of R. senegalensis at doses of 100 and 200 mg/kg. Additionally, Mahamad et al 17 showed that the aqueous extract of C. polyantha (222 and 444 mg/kg) has antioxidant potential and a protective effect on kidney and liver cells. These effects obtained with CPRS were significant at the dose of 50 mg/kg; which demonstrates the synergistic effect of C. polyantha and R. senegalensis. The combination of these two plants has more antioxidant, nephroprotective and hepatoprotective effects than each of the plants taken individually.
The study also showed an increase in lymphocytes, monocytes and granulocytes in the group of negative control rats compared to normal rats. The decrease in these parameters in treated rats may be due to the ability of CPRS to restore insulin sensitivity and reduce oxidative stress in blood cells. 57 A high WBC count is a classic marker of inflammation and is associated with type 2 diabetes mellitus. 58 In diabetes, adipokines secreted by excess adipose tissue will attract inflammatory cells, thus promoting inflammation marked by an increase in the number of WBCs and its distribution indices. In our work, the increase in the number of WBCs, monocytes, lymphocytes, and granulocytes in the negative control group compared to the neutral control group, is in line with previous reports. 59 The significant decrease in WBC levels observed in treated animals would reflect the ability of CPRS to normalize blood sugar, scavenge free radicals and therefore reduce inflammation in diabetic animals. 60
Several studies have revealed that hyperglycemia has the ability to alter hematological parameters. Diabetic patients with poor glycemic control have a relatively higher risk of developing anemia. 61 The RBC distribution index evaluated in the present work highlights a significant decrease in the rate of RBC, HCT, HGB, MCV, MCH, and MCHC of untreated diabetic rats compared to normal rats. Indeed, red blood cell count levels are reduced in diabetes due to increased non-enzymatic glycosylation of red blood cell membrane proteins. 62 The oxidation of these proteins causes an increase in the production of lipid peroxides which lead to hemolysis of red blood cells. CPRS markedly improved altered blood parameters in treated diabetic rats, suggesting its potential in ameliorating the anemic condition of diabetic rats. In fact, CPRS can stimulate the formation or secretion of erythropoietin, a glycoprotein hormone that stimulates bone marrow stem cells to produce red blood cells. 63 The elevated level of MCH and MCHC may suggest ability of CPRS to enhance blood oxygen transport. The improvement in the anemic state of diabetic rats can also be attributed to the ability of CPRS to lower the level of lipid peroxidation that causes hemolysis of erythrocytes. 64 Previous studies on C. polyantha and R. senegalensis revealed the presence of flavonoids, tannins, and phenols in these plants.11,17 These compounds, having strong antioxidant capacities, could inhibit the peroxidation of polyunsaturated fatty acids in the cell membrane and the hemolysis of red blood cells in diabetic animals. 65
The increase in PDW is always related to the activated megakaryocyte-platelet system due to platelet anisocytosis resulting from the process. 66 Treatment of diabetic rats with CPRS resulted in reduction of PDW; implying that the effects of diabetes-induced activation of the megakaryocyte-platelet system were attenuated by CPRS. Platelet aggregation capacity has been demonstrated in diabetic patients due to insulin deficiency or deficiency. 67 Platelets called thrombocytes contribute to blood clotting and play a crucial role in reducing blood loss and repairing vascular damage. 62
Increased levels of PLT, MPV, PDW, and PCT were confirmed in this study in untreated diabetic rats compared to normal control rats. The increase in PCT is explained by the increase in the number of platelets since it represents the percentage of the blood volume occupied by platelets. 68 It has been shown that an increase in MPV corresponds to larger platelet diameters, which can be used as a marker of platelet production. 64 It can therefore be estimated that the significant increase in MPV in diabetic control rats results from an increase in the turnover and activation of platelets which are common characteristics of diabetes. On the other hand, the significant reduction in the levels of PLT, MPV, and PDW recorded in the treated animals shows that CPRS would have the capacity either to stimulate the biosynthesis of coagulation factors or the coagulation of blood, in particular during bleeding or severe hemorrhage. 69 These results are in agreement with those obtained by Oyedemi et al 56 on the aqueous extract of stem bark of Afzelia africana.
Study Limitations
This study is based on the evaluation of the effects of a mixture of Cissus polyantha and Rytigynia senegalensis (CPRS) on hepatorenal function and oxidative and hematological profiles of diabetic rats. This study involves a mixture of two different plants. Each of these plants must undergo fractionation to obtain the bioactive compounds. This will allow us to detect the compounds responsible for the pharmacological effects and elucidate their potential mechanisms of action. In addition, a toxicological profile must be performed to ensure the safety of CPRS.
Conclusion
CPRS protects the liver and kidneys from oxidative damage and improves hepatorenal function and the hematological profile of diabetic rats. CPRS is therefore an important potential antidiabetic agent, which justifies the traditional use of C. polyantha and R. senegalensis in the treatment of diabetes mellitus and its complications. However, in future work it would be necessary to evaluate the effects of CPRS on the neurological complications of diabetes and to further isolate the chemical compounds responsible for the pharmacological effects obtained.
Footnotes
Acknowledgements
The authors are grateful to the Laboratory of Biological Sciences at the University of Ngaoundere (Cameroon) and Laboratory of Life and Earth Sciences of the University of Maroua (Cameroon) for providing the facility to carryout the research.
Ethics Considerations
The experiments were conducted in accordance with the guidelines of the Cameroon Bioethics Committee (No. FWAIRB00001954) and approved by the Bioethics Advisory Commission of the Faculty of Sciences, University of Maroua (No. 0025/022//Uma/D/FS/VD-RC)
Funding
The authors received no financial support for the research, authorship, and/or publication of this article.
Declaration of Conflicting Interests
The authors declared no potential conflicts of interest with respect to the research, authorship, and/or publication of this article.
Data Availability Statement
The data analyzed and materials used in this study are available from the corresponding author on reasonable request.
Statement of Informed Consent
There are no human subjects in this article and informed consent is not applicable.