
Abstract
Objective:
Aim of the study to explore the effect and underlying mechanism of Koumiss on Hyperlipidemia.
Introduction
Hyperlipidemia is a metabolic disorder resulting from dysregulation in lipid metabolism. 1 Epidemiological studies indicate that hyperlipidemia poses a significant risk factor for various health conditions, including atherosclerosis,2,3 cardiovascular disease, 4 cerebral ischemia, 5 kidney disease, 6 insulin resistance, fatty liver, 7 and others. As a crucial determinant of human health and quality of life, worsening hyperlipidemia can lead to non-alcoholic fatty liver disease (NAFLD), obesity, type 2 diabetes, and metabolic syndrome. 8 The global prevalence of NAFLD has risen dramatically to 25%, attributed to substantial lifestyle changes in recent decades. Developing countries, such as China, face a notable increase, with a current prevalence of 29.2%. This surge poses significant challenges in addressing the escalating global NAFLD epidemic. Compounding the issue, there are currently no Food and Drug Association-approved drugs for treating NAFLD, emphasizing the need to explore its pathogenesis for the development of new therapeutic interventions. 9
A disorder in lipid metabolism can result in the accumulation of lipids in the liver, affecting various reactive oxygen species (ROS) generators, including mitochondria, endoplasmic reticulum, and nicotinamide adenine dinucleotide phosphate (NADPH) oxidase. In NAFLD, mitochondrial function adapts primarily by down-regulating the electron transport chain (ETC) while maintaining or enhancing mitochondrial fatty acid oxidation (FAO) capacity. This adaptation triggers excessive ROS production within various ETC components upstream of cytochrome C oxidase. 10 Oxygen is converted into ROS during aerobic metabolism, playing a crucial role in the regulation of physiological active substances and inflammatory immune processes. However, an excess of ROS can contribute to an oxidative stress state. The mitochondrial respiratory chain complex, responsible for electron transfer to produce adenosine triphosphate (ATP), becomes a major source of ROS, particularly affecting the liver. Excessive ROS can cause significant damage to the liver's antioxidant system.
Mammalian mitochondrial oxidative respiration serves as the primary source of heat generation. Brown and beige adipocytes contribute to energy expenditure through substrate cycling, driven by a high rate of FAO. 11 The acyl-CoA dehydrogenase family member 9 (ACAD9), a component of the mitochondrial complex I assembly (MCIA) complex, plays a key role in oxidative phosphorylation by participating in the assembly of complex I. 12 The respiratory chain, comprised of protein complexes in the inner membrane of the mitochondria, is responsible for generating most of the cell's energy. Within this chain, three membrane proteins establish a proton gradient, transporting protons from the cytosol into the mitochondrial matrix. The energy driving this process mostly stems from the transfer of electrons between nicotinamide adenine dinucleotide (NADH) molecules (derived from food) and the oxygen they respire. Homology modeling of the ACAD9 and ACAD9/Evolutionarily conserved signaling intermediate in Toll pathways (ECSIT)/ NADH dehydrogenase (ubiquinone) 1 alpha subcomplex, assembly factor 1(NDUFAF1) ternary complex provides a framework for classifying and understanding ACAD9 human mutations, offering a theoretical basis for riboflavin. In this complex, the C-terminal domains of ACAD9 and NDUFAF1 interact with other assembly factors, including Transmembrane Protein 126B (TMEM126B) and Transmembrane protein 186 (TMEM186), in the assembly of the Recombinant NADH-ubiquinone oxidoreductase chain 2 (ND2) module. 13 A key question revolves around balancing ACAD9's dual roles in regulating mitochondrial complex I (CI) assembly and dehydrogenase activity. In the absence of active re-flavinylation, “burst” and irreversible interference with electron transfer flavoprotein (ETF) binding lead ACAD9 to predominantly assume its role in CI assembly. The evolutionarily conserved signaling intermediate in Toll pathways (ECSIT)-facilitated “burst,” coupled with the overabundance of ACAD9 on ECSIT and NADH:ubiquinone oxidoreductase complex assembly factor 1 (NDUFAF1) in tissues such as the brain, provides a mechanism for balancing dehydrogenase activity and CI assembly. This interplay links fatty acid metabolism and oxidative phosphorylation, as ACAD9's enzymatic activity contributes to both FAO and complex I biogenesis. 14
Prior research has uncovered evident dysbiosis in the gut microbiota of individuals with hyperlipidemia, characterized by a decreased abundance of Bifidobacterium, Lactobacillus, and Bacteroides genera, and an increased abundance of bacteria from the Enterobacteriaceae family and the Streptococcus genus. Significant correlations have been found between the alterations in the gut microbiota and blood lipid levels. Notably, certain bacteria in the gut, such as Bifidobacterium and Lactobacillus, play a role in fermenting remaining polysaccharides and starches in the intestine, generating additional short-chain fatty acids (SCFAs). Additionally, these bacteria produce bile acid hydrolase, enhancing fat solubility. Bile acids, in turn, bind with cholesterol to form bile acid salts, facilitating the dissolution of cholesterol in the aqueous phase, increasing bile acid synthesis, and converting more cholesterol in the blood. The gut microbiota also contributes to cholesterol metabolism by promoting the production of cholesterol oxidase, resulting in the generation of cholesterol ketones that are ultimately degraded into fecal sterols and excreted. 15
Regarding Koumiss therapy, earlier research has demonstrated its significant lipid-lowering effect in clinical practice, leading to an average decrease of 28% in total cholesterol and an average decrease of 31% in triglycerides. Koumiss is rich in probiotics, encompassing 47 genera of lactic acid bacteria, including 373 species and subspecies. SCFAs generated by probiotic metabolism, such as acetic acid, ethanol, propionic acid, and butyric acid, have been identified in the blood of patients with hyperlipidemia. These SCFAs activate the cyclic adenosine monophosphate (cAMP)/protein kinase A (PKA)/cAMP response element-binding protein (CREB) pathway in the liver, enhancing oxidative metabolism and inhibiting hepatic fat synthesis, thereby improving lipid levels. SCFAs can also inhibit hepatic cholesterol synthesis, increase bile acid excretion in feces, and lower cholesterol levels. 15 Additionally, SCFAs target adipocytes, increasing lipolysis and releasing leptin, while also exerting anti-inflammatory effects by modulating immune cell chemotaxis and both ROS and cytokine release. Furthermore, certain studies propose that the gut microbiota can influence lipid metabolism by modulating appetite and increasing satiety. 16 Despite these insights, the mechanism through which Koumiss therapy affects hyperlipidemia remains unclear. This study seeks to explore the molecular mechanism of the lipid-lowering effect attributed to Koumiss therapy. The investigation employs transcriptome sequencing to identify differentially expressed genes (DEGs). Additionally, animal models will be instrumental in validating the changes in gene expression after Koumiss intervention.
Flow chart
Materials and Methods
Chemicals and reagents
Sprague-Dawley (SD) rats, license number:SCX K-(Jing)-2016-0006,Vital River Experimental Animal Technology Co., Ld
Koumiss, product code: DBS15/013-2019, Inner Mongolia Masu Dairy Co., Ld
Trizol, product code: CW0580, cwbio.
Whole protein extraction kit, BC3710, Solarbio.
BCA Protein Assay Kit (Esay IIProtein Quantitative Kit (BCA), product code: DQ 111, TransGen Biotech.
ACAD9 Rabbit Polyclonal antibody, protein tech:15770-1-AP.
GAPDH Polyclonal antibody, Thermo Fisher SCIENTIFIC:PA1-987.
Anti-rabbit IgG (H + L) (Dylight TM 800 4×PEG Conjugate), Cell Signaling TECHNOLOGY:#5151.
Patients with Hyperlipidemia
This study enrolled 10 individuals with elevated blood lipid levels who volunteered to participate. The participants consumed 250 mL of Koumiss three times a day after each meal for a continuous period of 21 days. Blood samples were taken from the patients before and after the treatment.
Extraction of Total RNA from Whole Blood
The blood samples underwent red blood cell lysis by adding a 3-fold volume of red blood cell lysis buffer, followed by mixing and incubation at room temperature for 10 min. After centrifugation at 1000 rpm for 5 min, the supernatant was discarded, and the collected white blood cell pellet underwent lysis by adding 1 mL of TRIzol for every 100–200 μL of blood. This mixture was kept at room temperature for 5 min to ensure complete lysis. Subsequently, 200 μL of chloroform was added, mixed on a shaker, and maintained at room temperature for 3–5 min. Further centrifugation ensued, at 12000 rpm for 15 min at 4 °C. After layering, 600 μL of the upper layer was collected and combined with an equal volume of ice-cold isopropanol. Following incubation at room temperature for 10–20 min, the sample was centrifuged at 12000 rpm for 10 min at 4 °C, and the supernatant was discarded. The sample underwent precipitation with 75% ethanol, was dissolved in 100 RNase-free H2O, and quantified prior to storage.
Transcriptomic Analysis
RNA Quality Detection and cDNA Library Construction
Total RNA was employed for the construction of the library, with a quantity of >=1 μg. Library construction employed the NEBNext® UltraTM RNA Library Prep Kit from Illumina. Enrichment of mRNA with polyA tails was achieved using Oligo(dT) magnetic beads, and the resulting mRNA underwent random fragmentation using divalent cations in NEB Fragmentation Buffer. In an M-MuLV reverse transcription system, the first strand cDNA was synthesized utilizing the fragmented mRNA as a template and random oligonucleotides as primers. Subsequently, RNaseH was used to degrade the RNA chain, and dNTPs were used as raw materials to synthesize the second strand cDNA in a DNA polymerase I system. The purified double-stranded cDNA underwent end repair, A-tailing, and adapter ligation, with 200 bp cDNA fragments selected using AMPure XP beads for polymerase chain reaction (PCR) amplification. The resulting purified PCR products were subjected to additional AMPure XP bead purification to produce the final library. Following library construction, initial quantification was performed using a Qubit2.0 Fluorometer, with dilution to 1.5 ng/μL. The insert size of the library was determined using the Agilent 2100 bioanalyzer. Quantitative PCR (qPCR) was then conducted to quantify the effective concentration of the library, ensuring it exceeded 2 nM for high-quality library assurance.
High-Throughput Sequencing
After successfully passing the library quality control, various libraries were combined based on their effective concentrations and the desired amount of data for Illumina sequencing. This process resulted in paired-end reads of 150 bp. The sequencing method used was “sequencing by synthesis,” which entails the addition of four types of fluorescently labeled dNTPs, DNA polymerase, and adapter primers to the flow cell. While extending each complementary strand in a sequencing cluster, the incorporation of each fluorescently labeled dNTP released a corresponding fluorescent signal. The sequencing machine captured this signal, and computer software converted it into a sequencing peak, thereby providing sequence information for the analyzed fragment.
Screening of Differentially Expressed Genes
The DESeq2 R software (version 1.16.1) was employed to complete differential gene expression analysis between two comparison groups, each consisting of two biological replicates. DESeq2 utilizes a statistical approach based on the negative binomial distribution to identify DEGs in digital gene expression data. The Benjamini and Hochberg method was applied to adjust the p-values to control the false discovery rate. Genes with an adjusted p-value < 0.05 were considered differentially expressed. In cases where biological replicates were unavailable, the edgeR package was used. Before initiating the differential gene expression analysis, read counts were normalized for each sequencing library through a scaling normalization factor provided by the edgeR package. The differential gene expression analysis between the two conditions was executed using the edgeR package. The Benjamini & Hochberg method was applied to adjust the p-values, with the corrected p-values and |log2foldchange| serving as the threshold for significant differential expression.
Functional and Pathway Enrichment Analysis
GO enrichment analysis for DEGs was conducted using the clusterProfiler R software, considering gene length bias correction. Significantly enriched GO terms were determined based on adjusted p-values less than 0.05. Additionally, KEGG, a comprehensive database, was utilized to gain insights into advanced biological functions and the utility of biological systems at various levels, ranging from molecular information to large-scale molecular datasets derived from genome sequencing and other high-throughput databases.
Interaction Analysis of Differential Gene Protein Network
The analysis of DEG PPIs involved using the STRING database, which offers information on both known and predicted PPIs. To construct the network, the target gene list was extracted from the database for species present in it. In cases where the species of interest was not present, the diamond tool (version 0.9.13) was used to align the target gene sequences with the reference protein sequences. Subsequently, the network was established in accordance with known interactions of the selected reference species.
Serum Pharmacochemical Analysis
Analysis was conducted under the control of Agilent's ultra-high performance liquid chromatography system (1290 UPHLC), using the following flow phase parameters. The chromatographic column was a UPLC BEH C18 column (1.7 μm 2.1100 mm) from Waters, and the injection volume was 3 μL. The Q Exactive Focus mass spectrometer performed first- and second-level mass spectrometry (MS) data acquisition based on the FullScan-ddMS2 function under the control of Xcalibur software (Thermo Fisher Scientific). Detailed parameters include sheath gas flow rate: 45 Arb, aux gas flow rate: 15 Arb, capillary temperature: 400 °C, full MS resolution: 70000, MS/MS resolution: 17500, collision energy: 15/30/45 in normalized collision energy mode, and spray voltage: 4.0 kV (positive) or −3.6 kV (negative).
Molecular Docking
The Protein Data Bank (PDB) format for the shared target of the drug and disease was obtained from the Research Collaboratory for Structural Bioinformatics Protein Data Bank (RCSB PDB) database (http://www.rcsb.org/). Pymol software was employed to manipulate the receptor by eliminating solvent and water. Molecular docking was conducted using AutoDock, and the docking data were visualized and analyzed with LIGPLOT. This process produced a protein-ligand 2D diagram illustrating atomic distances and the interaction types contributing to the interaction between the receptor and ligand.
Gut Flora Detection and Probiotic Metabolite Traceability Analysis
Fecal specimens from individuals with hyperlipidemia were obtained on days 0, 7, and 14 following Koumiss treatment. High-throughput sequencing was employed to analyze the V3 + V4 region of the 16S rRNA gene. The study encompassed assessments of α Diversity, β Diversity, species composition analysis at the phylum, family, and genus levels, significant group difference analysis, and functional gene prediction. Additionally, microorganisms of small molecular origin were identified using KEGG Organisms screening.
Animals
Male Sprague-Dawley (SD) rats weighing between 180–220 g, with license number SCX K-(Jing)-2016-0006, were purchased from Vital River Experimental Animal Technology Co., Ltd in Beijing, China. Approval number: NM-LL-2023-02-27-01. The rats were housed in a controlled environment with a temperature of 23 ± 1 °C, humidity set at 60 ± 5%, and subjected to a 12-h light-dark cycle. They received a standard diet and had access to water ad libitum. Prior to the commencement of the experiment, a 7-day adaptation period was conducted under these controlled conditions. At the end of the adaptation phase, the rats were acclimated and fed for an additional 7 days, and then randomly divided into a control group, a model group, a positive control group, a Koumiss medium doses group, and High doses group using a random number table. Each group comprised 8 rats.
Establishment of Hyperlipidemia Rat Model
Specific pathogen-free-grade adult male SD rats were randomly assigned to five groups: control, model, positive control, Koumiss medium doses, and High doses groups. With the exception of the control group, all other groups were orally administered a high-fat emulsion to induce the hyperlipidemia animal model. The positive control group received Xuezhikang capsules (5.36 mg/100 g, once daily), the Koumiss medium doses group was given Koumiss (5 mL/time, once daily), and the high doses group received Koumiss (5 mL/time, twice daily). The control group was administered an equivalent volume of saline by gavage for 21 days.At the end of the experimental period, following a night of fasting, rats were anesthetized via intraperitoneal injection with 10% chloral hydrate (1.0 g/kg body weight). Liver tissue was either fixed in liquid nitrogen or stored at −80 °C for subsequent analysis. This study approved by the Institutional Animal Care and Use Committee of the Affiliated Hospital of Inner Mongolia Minzu University.
qPCR Experiment
Total RNA was extracted from liver tissue (of rats) using Trizol (product code: CW0580, cwbio), and cDNA was synthesized with 1μg of total RNA using a reverse transcription kit (AQ 132, TransGen Biotech, China). The primer sequences are detailed in Table 1, with GAPDH serving as the internal standard. The thermal cycling protocol consists of 30 s at 95 °C, 5 s at 95 °C, and 40 s at 60 °C. Each group was configured with three replicate wells, and the experiment was conducted three times. The gene expression level was determined using the 2−ΔΔCt method, and the results underwent analysis using SPSS 24.0 software.
Specific Sequences of Primers Used in RT-qPCR.

Western Blot
Protein samples were isolated from liver tissue (Rats) using a whole protein extraction kit (Solarbio, BC3710, Beijing, China) and the protein concentration was determined using the BCA Protein Assay Kit (Esay IIProtein Quantitative Kit (BCA) DQ 111, TransGen Biotech, China). An equivalent of 20 μg of protein was separated by 10% sodium dodecyl sulfate polyacrylamide gel electrophoresis (SDS-PAGE) and then transferred to a polyvinylidene fluoride (PVDF) membrane (IPVH00010,Millipore, USA). After blocking with 5% nonfat milk powder in Tris- buffered saline Tween (TBS-T) for 1 h at room temperature, the membranes were incubated overnight at 4 °C with primary antibodies ACAD9 Rabbit Polyclonal antibody (protein tech:15770-1-AP) (1:1000). GAPDH Polyclonal antibody (Thermo Fisher SCIENTIFIC:PA1-987) served as an internal reference. Following incubation with Anti-rabbit IgG (H + L) (Dylight TM 800 4×PEG Conjugate) (Cell Signaling TECHNOLOGY:#5151)(1:10000) for 1 h at room temperature, chemiluminescence signals were detected and analyzed using the ChemiDoc XRS Imaging System (BioRad, USA). Protein band intensities were quantified using Image J software. These experiments were conducted three times, with each samples in an experiment repeated in triplicate.
Statistical Analysis
SPSS 24.0 software was used for analysis and processing, and the data were expressed by mean ± standard deviation (±SD), single factor variance (one-way analysis of variance,ANOVA) was used, p < 0.05 showed that the difference was statistically significant.
Results
Basic Information and Blood Lipid Indicators of Patients with Hyperlipidemia
Clinical data, including gender, age, disease duration, and concentrations of triglycerides, total cholesterol, low-density lipoprotein, and high-density lipoprotein, is presented in Figure 1. A notable finding reveals that the erythrocyte sedimentation rate (ESR) in the hyperlipidemia group was significantly higher than that in the healthy control group (p < 0.01). Moreover, the concentrations of triglycerides and low-density lipoprotein cholesterol in the hyperlipidemia group exhibited a significant reduction (p < 0.05), whereas the changes in total cholesterol and high-density lipoprotein cholesterol did not reach statistical significance (p > 0.05) (Table 2).

The impact of Koumiss on lipid indices and reactive oxygen species levels in hyperlipidemia patients. A. Blood lipid index testing in hyperlipidemia patients before and after Koumiss administration, alongside results from normal subjects. B. Blood levels of reactive oxygen species before and after Koumiss intake. The bars indicate the mean ± SD. Significant differences compared with normal are denoted by ⋇⋇p < 0.05.
Demographic and Clinical Characteristics of Human Subjects Involved in the Study.

*Compared with the control group; # Compared with the disease group.
RNA Quality Inspection
In the sequencing phase of the experiment, a total of 12 samples were subjected to quality assessment using the Agilent 2100 bioanalyzer for total RNA. The results indicated that one sample may have undergone partial degradation, falling short of the requirements for library construction. Therefore, the remaining 11 samples that met the criteria for library construction were selected, which included an OD 260/280 ≥ 1.8 and a 28/18S ratio ≥ 1.2.
Screening of Differentially Expressed Genes
Transcriptomic sequencing identified a total of 2331 DEGs in the normal control group and the Koumiss treatment group. This included 670 up-regulated genes and 1663 down-regulated genes. Additionally, 257 genes showed differential expression between the disease group and the treatment group, comprising 224 up-regulated genes and 33 down-regulated genes (Figure 2 A, B, C, D, E).

Visualizations of transcriptomic analysis. A. Volcano plot of differentially expressed genes, where significantly up-regulated genes are presented in red, significantly down-regulated genes in green, and non-significantly different genes in blue. Within the plot, each circle is representative of a comparison group, with numbers in the overlapping region indicating the number of differentially expressed genes shared between comparison groups. The numbers without an overlapping region signify the number of differentially expressed genes specific to each comparison group. B. A total of 224 up-regulated genes and 224 down-regulated differentially expressed genes. C. Principal component analysis plot, with each data point representing a sample, and variations in color and shape denoting distinct groups. The closer the distribution of sample points, the more similar the type and content of genes in the sample. Conversely, a greater distance between sample points signifies a higher disparity in overall gene expression levels. D. Hierarchical cluster analysis of differentially expressed genes, accompanied by a Venn diagram comparing the gene table. In the Venn diagram, red corresponds to up-regulated genes, while green signifies down-regulated genes. E. Kyoto Encyclopedia of Genes and Genomes enrichment plot of differentially expressed genes both prior to and following Koumiss treatment. The annotations refer to Kyoto Encyclopedia of Genes and Genomes, Reactome, and Canonical-derived pathways.
Functional and Pathway Enrichment Analysis
Using the ClusterProfiler R package, the DEGs identified in each comparison group underwent comparison with the KEGG database. Out of the 2415 DEGs across the normal, model, and drug-treated groups, 1675 were annotated to 30 pathways. The number of DEGs enriched in each pathway ranged from 27 to 125. Figure 2E highlights some significantly enriched KEGG pathways in each comparison group. Furthermore, a protein-protein interaction (PPI) network of the DEGs was constructed. Through Cytoscape-Gene Ontology analysis, the most significant module was identified, showing significant enrichment in reactions associated with the citric acid cycle (TCA) and respiratory electron transport (p = 5.26e-05). Additionally, significant enrichment was observed in RNA polymerase II promoter transcription. The PPI network diagram of the DEGs was completed using the online database String and Cytoscape software. Selection criteria included a confidence score > 0.4 and degree > 5. Six DEGs, namely ATP6, ND2, ND1, ND3, ACAD9, and NDUFAF1, were selected as target genes for clustering coefficient analysis (Figure 3).

Histogram of Gene Ontology enrichment analysis of differentially expressed genes before and after Koumiss treatment. Red denotes Biological Process annotation information, green represents Cellular Component annotation information, and blue signifies Molecular Function annotation information. The transparency of the colors depicts p-value size, where darker colors correspond to smaller p-values. A. Alterations in the expression of genes in the lipid oxidative phosphorylation pathway across the normal, disease, and treatment groups compared to each other. B. A network that incorporates six key cell cycle genes: MT-ND6, RNF213, FCGR3A, SHISA5, and ACAD9. C. Expression analysis of lipid oxidative phosphorylation pathway-related genes between the normal, disease, and treatment groups.
Serum Pharmacochemical Analysis
In the process of metabolite identification, the first step involved confirming accurate molecular weights with a mass error of <= 30 ppm. Subsequently, metabolites were annotated using MS/MS fragmentation pattern through reference to databases such as the Human Metabolome Database (HMDB) (http://www.hmdb.ca), LipidMaps (http://www.lipidmaps.org), mzCloud (https://www.mzcloud.org), and the PanOmics in-house standard database. A total of 2013 distinct metabolites were identified and utilized for bioinformatics analysis. Among these, 55 metabolites were specifically derived from Koumiss, as illustrated in Figure 4 and listed in Table 3. The identified metabolites comprised 1360 positive ion small molecules and 649 negative ion small molecules (Table 3).
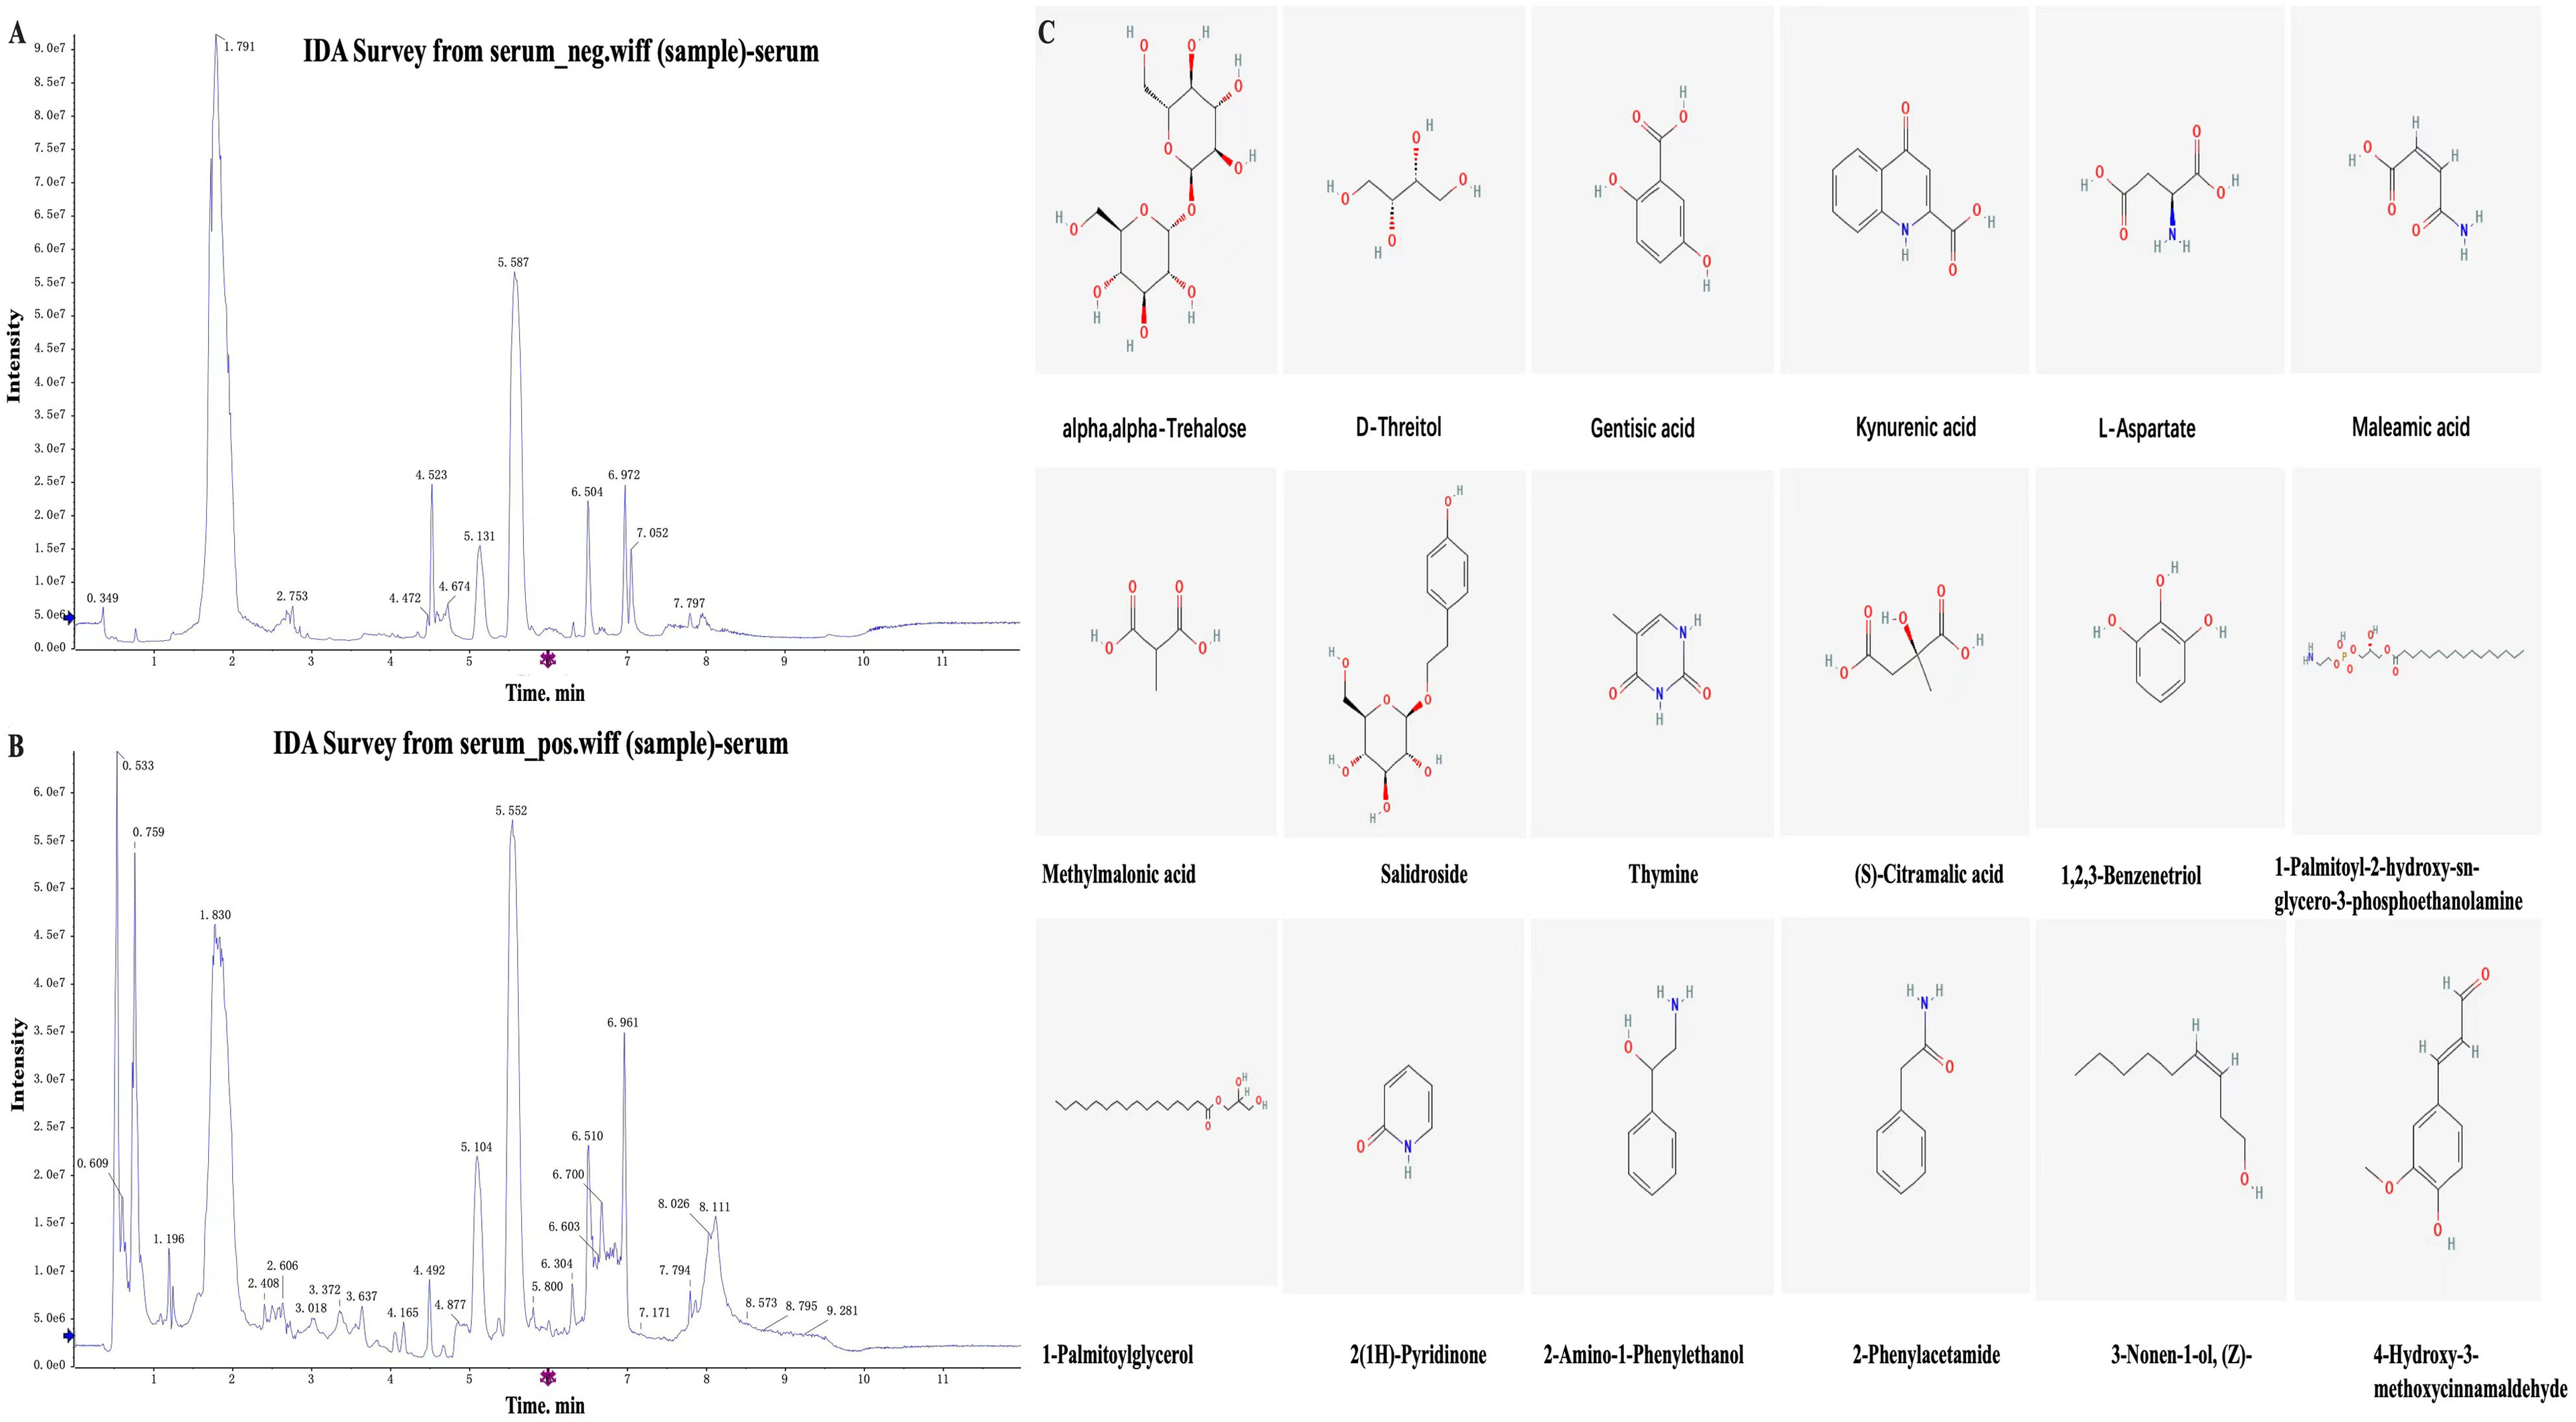
A and B. The liquid chromatography-mass spectrometry method was employed to detect incoming blood components, specifically focusing on the identification of probiotic metabolites after Koumiss therapy. C. Preliminary identification of differentially expressed small molecule chemical structures derived from Koumiss in the blood of patients.
Serum Metabolites from Koumiss Identified by Liquid Chromatography-Mass Spectrometry.

Network Construction of Active Ingredients and Target Genes
Utilizing the Cytoscape 3.8.0 software, a network was constructed by importing Koumiss probiotics metabolites and targets, as shown in Figure 5. The network diagram visually illustrates the interactions among these components and targets. In Figure 5, a total of 233 nodes and 538 edges are represented, symbolizing the relationships between the components of “Koumiss probiotics metabolites” and their respective targets/drugs. The graphical elements in the network have specific representations: hexagons symbolize effective components in Koumiss probiotics metabolites, squares represent potential target proteins, and nodes represent drugs, components, and target proteins, respectively. The edges delineate the corresponding relationships between these elements, with the size of the graphics proportional to the strength of the relationships. This network provides a comprehensive overview of the intricate connections within Koumiss probiotics metabolites and their associated targets.

A. Volcano plot depicting the results of a non-targeted assay. B. Enrichment plot showcasing the changes in differentially expressed small molecule Kyoto Encyclopedia of Genes and Genomes pathways before and after Koumiss treatment.
Analysis of Docking Results Between Active Components and Protein Molecules
Using Discovery Studio software, a network diagram of binding forces was constructed for the interaction between the Koumiss probiotics metabolite 2-Furoic acid and the target ACAD9. This network diagram visually represents the interactions between these components and targets. Notably, 2-Furoic acid binds to a small protein active pocket within the ACAD9 protein. The spatial structure of 2-Furoic acid complements well with the protein's spatial structure, indicating a robust binding affinity between the two. The small molecule compound effectively occupies the protein's active pocket. The active pocket is composed of hydrophobic residues, including Pro411, Arg85, and Arg408. Additionally, residues forming hydrogen bonds include Tyr410, Glu413, and Arg414. These interactions contribute to the stable existence of the small molecule compound within the protein's active pocket (Figure 6).

Utilitarian analysis comparing differentially expressed small molecules and differentially expressed gene proteins.
Gut Flora Detection and Probiotic Metabolite Traceability Analysis
After 14 days of Koumiss treatment, there was a notable increase in the abundance and diversity of intestinal flora in individuals with hyperlipidemia. The ace index and Chao index of the 0-day group showed a significant decrease compared to both 7-day and 14-day groups (p < 0.01). Moreover, the ace index and Chao index of the 14-day group were exhibited a significant increase compared to the 7-day group (p < 0.01). Analyzing at the phylum level, the relative abundance ratio of Firmicutes to Bacteroidetes (Firmicutes/Bacteroidetes) elevated from 1.36 (units) to 3.36 (units) before the intervention. Additionally, at the family level, there was a notable increase in the number of Trichospirillum following 14 days of treatment. Examining at the genus level, Agathobacter, Subdoligranulum, Enterobacter, and Bacteroides constituted the highest proportion (Figure 7).

Traceability analysis of intestinal flora and small molecule microorganisms, examining changes in the abundance of intestinal flora genus levels before and after treatment. Assessment of the alterations in abundance between group A and group B, as well as the abundance of intestinal flora genus levels between groups B, C, and D before and after treatment. In the notation: a represents the normal group, B signifies yogurt therapy intervention for 0 days, C denotes Koumiss therapy intervention for 7 days, and D represents Koumiss therapy intervention for 14 days. The horizontal coordinates indicate sample group names, while the vertical coordinates represent relative abundance percentages (A). Additionally, a concise analysis of the metabolic correlation of probiotic bacteria in Koumiss (B).
Expression of ACAD9 mRNA
Following a 3-week treatment period, ACAD9 mRNA expression in the rat liver was assessed. A significant increase in ACAD9 mRNA expression was found in the model group (p < 0.05). In comparison to the model group, the Koumiss probiotics treatment group exhibited a significantly lower ACAD9 mRNA expression level (p < 0.05) (Figure 8A).

Impact of ACAD9 gene following Koumiss treatment. A. Effect of ACAD9 gene mRNA after Koumiss treatment. B. Effect of ACAD9 gene protein level after Koumiss treatment. The bars indicate mean ± SD. #p < 0.05 indicates a significant difference compared to the control group. *p < 0.05 indicates a significant difference compared to the model group.
Western Blot Analysis
Both qPCR and Western blot analyses were conducted to assess the baseline expression level of ACAD9 in liver cell lines. In the liver tissue of hyperlipidemic rats, the baseline expression level of ACAD9 was found to be remarkably low. Additionally, Western blot analysis was employed to examine the protein expression level of ACAD9 in liver cell lines, but no significant positive expression of ACAD9 was observed (Figure 8B).
Discussion
Currently, research on the impact of Koumiss in reducing blood lipids primarily centers around its effects on human blood lipid levels. However, there is limited exploration on how Koumiss probiotics influence the oxidative phosphorylation of patients to alleviate hyperlipidemia. In this study, 10 patients with hyperlipidemia underwent a 21-day Koumiss therapy. Following the treatment, their blood levels of triglycerides, total cholesterol, and low-density lipoprotein cholesterol significantly decreased, indicating that Koumiss improved the clinical symptoms of hyperlipidemia patients. This outcome aligns with the findings of Liu et al, who established a correlation between the relief of hyperlipidemia symptoms and the reduction of total cholesterol levels by affecting the intestinal flora of hyperlipidemia patients. 17 Transcriptomic analysis in this study revealed that Koumiss had a regulatory effect on the TCA cycle and the respiratory electron transport pathway in the blood of patients with hyperlipidemia. Genes such as ATP6, ND2, CYTB, ND1, ND3, ACAD9, ND5, ND6, ATP8, ND4, and COX2 in this pathway exhibited increased activity. The study also identified elevated expression of the ACAD9 gene in the blood of patients with hyperlipidemia and the livers of rat models, with Koumiss intervention significantly downregulating its expression. Research by Kampjut has indicated that the ACAD9 protein is a component of the MCIA and is chiefly involved in assembling mitochondrial complex I, contributing to oxidative phosphorylation. 12 MCIA is essential for complex I biogenesis and critical for activating the oxidative phosphorylation (OXPHOS) system. FAO and OXPHOS are integral pathways in cellular energy. 18 The OXPHOS system, situated in the inner mitochondrial membrane, encompasses five complexes, with complex I (CI or NADH: ubiquinone oxidoreductase) being the initial one involved in the redox reaction of ATP production and ROS generation. 19 ROS, while playing a vital role in cell signaling and homeostasis, also inflict oxidative harm to DNA, lipids, and proteins, including those in the respiratory chain. 20 Deficiencies in complex I activity are often linked to defects in the assembly process, leading to prevalent OXPHOS diseases in humans.21–24 ROS primarily targets mitochondria, leading to oxidative damage to respiratory chain proteins and mitochondrial DNA. Oxidized DNA bases, along with the depletion of mitochondrial DNA and both genetic and acquired mutations in mitochondrial DNA, have the potential to impair the resynthesis of respiratory chain polypeptides. This interference disrupts electron flow in the respiratory chain, intensifying the generation of mitochondrial ROS and establishing a detrimental cycle. The formation of ROS is notably influenced by the varying FADH2/NADH (F/N) ratios of catabolic substrates. 25 Consequently, FAO leads to higher ROS generation compared to glucose oxidation. ACAD9 assumes a pivotal role in initiating the initial and subsequent cycles of FAO, specifically in palmitic and oleic acid - the primary long-chain fatty acids employed in mitochondrial FAO. ACAD9's involvement is confined to specific tissues within the mitochondrial FAO process.
Through serum drug chemical analysis, this study identified 1194 SCFAs derived from Koumiss in the serum of patients with hyperlipidemia. SCFAs, metabolic products of gut microbiota, have been found to enhance oxidative metabolism and inhibit liver fat synthesis by activating the cAMP/PKA/CREB protein pathway in the liver. 15 Koumiss, abundant in Lactobacillus and Streptococcus, especially Agathobacter, Subdoligranulum, Bacteroides, and Parabacteroides, potentially influences the gut microbiota. Andoh's comparison of the gut microbiota between obese and lean individuals revealed a significantly higher Shannon diversity index in the lean group compared to the obese group. 26 In a study by Wang et al, 27 treatment with Bifidobacterium in middle-aged and elderly individuals with dyslipidemia led to increased relative abundance of Firmicutes, Bacteroidetes, and Actinobacteria in the gut. This treatment also resulted in reduced relative abundance of Fusobacteria and Clostridia. Correlation analysis indicated a significant negative relationship between the relative abundance of Bacteroides and triglyceride levels, as well as a significant negative correlation between the small subclass Dialister of the Firmicutes and LDL-C levels. These findings suggest that Bifidobacterium may regulate the gut microbiota, leading to a reduction in blood lipid levels. Therefore, it can be inferred that probiotics in Koumiss may be pivotal to improving the symptoms of patients with hyperlipidemia. The present study utilized network pharmacology to delve into the targeted association between the small molecule 2-Furoic acid and the TCA cycle and respiratory electron transport pathways, along with the ACAD9 gene in Koumiss probiotic metabolism. This relationship was further substantiated through in vivo and in vitro experiments. Finally, the potential applications and immense value of 2-Furoic acid preventing and treating human hyperlipidemia were discussed. 2-Furoic acid, a metabolic byproduct of Koumiss probiotics encompassing Firmicutes, Bacteroidetes, Proteobacteria, Actinobacteria, Verrucomicrobia, and Cyanobacteria, is also detected in the urine of individuals exposed to furfural, a common industrial solvent. Furfural absorption through the lungs and skin raises health concerns, as it is an eye, mucous membrane, and skin irritant, and acts as a central nervous system depressant. Although furfural is identified as an animal carcinogen, its impact on humans remains unclear, with some suggesting a potential association with liver cirrhosis. Once absorbed, furfural is rapidly metabolized into the metabolite furan-2-carboxylic acid, combining with glycine and excreted in urine. 2-Furoic acid serves as a biological marker for beer consumption. Molecular docking of the primary active component, 2-Furoic acid, with the target gene ACAD9, was conducted. Utilizing Discovery Studio software, the Koumiss probiotic metabolite 2-Furoic acid and the target ACAD9 were imported to construct a network diagram illustrating binding forces. This diagram visually represents the interaction between these components and the target, with a binding force of −5.0, signifying a targeted relationship between 2-Furoic acid and ACAD9.
Our research group posited that Koumiss might alleviate clinical symptoms in hyperlipidemia cases through a third mechanism, namely its regulatory effects on gut microbiota. Additionally, in our study implementing a high-fat diet-induced rat model of hyperlipidemia, we observed that these bacteria effectively reduced triglyceride and LDL-C levels. This suggests a potential association between the Lactobacilli in Koumiss and the reduction of lipid levels in individuals with hyperlipidemia. Elsewhere, Jiao et al found that SCFAs can significantly reduce triglycerides, total cholesterol, high-density lipoprotein-cholesterol, and insulin concentrations (p < 0.05). 28 Our investigation identified elevated levels of ACAD9 and decreased expression of NDUFAF1 in the liver of the high-fat diet-induced rat model of hyperlipidemia. This indicates that Koumiss microbial metabolites contribute immensely to accelerating lipid metabolism in hyperlipidemia. Furthermore, we identified 2-furoic acid as a differentially expressed metabolite of Koumiss probiotics through serum pharmacological screening of hyperlipidemia patients. In summary, the MCIA, with ACAD9 at its core, actively participates in the hyperlipidemia-induced liver damage process mediated by ROS. Koumiss effectively inhibits hyperlipidemia-induced liver damage and accelerates lipid oxidation by regulating the ACAD9 gene and MCIA complex. The Koumiss probiotic metabolite 2-furoic acid may establish a targeting relationship with the active ingredient of Koumiss for lipid oxidation and the ACAD9 protein. This study sheds light on a potential therapeutic approach based on the regulation of ROS generation and lipid accumulation mediated by ACAD9.
This experiment involved clinical and animal experiments to study the mechanical effects of koumiss on FAO. However, to better interpret the study of the mechanism of action of koumiss on FAO, in vitro experiments will be designed in the future to supplement the limitations of this experiment.
Conclusion
KOUMISS has a good therapeutic effect on reducing TG, TC and LDL-C levels in patients with hyperlipidemia. KOUMISS also has a regulatory effect on the dysbiosis of intestinal flora in hyperlipidemia patients. Furthermore, it has been demonstrated that 2-Furoic acid, a metabolite of KOUMISS probiotics, regulates the expression of ACAD9 gene, and regulates the TCA cycle and respiratory electron transport pathway, promoting FAO and lipid metabolism(Figure 9).

A. Schematic diagram of the correlation between the ACAD9 gene and the mitochondrial complex I assembly process. B. Expression of individual proteins within the MCIA complex in hyperlipidemic patients following Koumiss treatment.
Footnotes
Acknowledgments
The current study was granted by “Study on the key issues of curative effect of Koumiss on regional diseases of Mongolian medicine” in 2018 Supported Project of the science and technology program of the Department of Science and Technology of Inner Mongolia Autonomous Region.
Data Availability Statement
All relevant data are within the manuscript and its Additional files.
Declaration of Conflicting Interests
The authors declare that the research was conducted in the absence of any commercial or financial relationships that could be construed as a potential conflict of interest.
Ethnical Approval
The human and animal study was reviewed and approved by Affiliated Hospital of Inner Mongolia Minzu University 2023 No. (NM-LL-2023-02-27-01).
Funding
The authors disclosed receipt of the following financial support for the research, authorship, and/or publication of this article: “Study on the key issues of curative effect of Koumiss on regional diseases of Mongolian medicine” in 2018 Supported Project of the Science and Technology program of the Department of Science and Technology of Inner Mongolia Autonomous Region.
Statement of Informed Consent
Informed consent was obtained from all subjects involved in the study. The human and animal study was reviewed and approved by Affiliated Hospital of Inner Mongolia Minzu University 2023 No. (NM-LL-2023-02-27-01).