
Abstract
Keywords
Introduction
Diabetes mellitus (DM) is a complex chronic metabolic disorder characterized by hyperglycemia. 1 The incidence of diabetes is steadily increasing, with over 422 million people currently affected worldwide. The global adult prevalence rate stands at 8.5%, highlighting the severity of this widespread issue. 2 Type 2 diabetes mellitus (T2DM) is a chronic metabolic disease characterized by insufficient insulin secretion or insulin resistance, 3 accounting for nearly 95% of individuals with diabetes. 4 T2DM can lead to multi-organ damage and various complications, such as diabetic nephropathy, diabetic retinopathy, cardiovascular and cerebrovascular diseases. The incidence of complications is notably higher in diabetic patients who also have obesity, arterial hypertension, dyslipidemia, and other associated risk factors.5,6
At present, the treatment of T2DM mainly includes insulin injection and oral hypoglycemic drugs.7,8 The oral hypoglycemic medicines include biguanides (metformin, etc), sulfonylureas (glipizide, etc), α-glycosidase inhibitors (acarbose, etc), glinides (repaglinide, etc), thiazolidinediones (rosiglitazone, etc), among others. While chemical drugs provide rapid effects in managing T2DM, their action targets are often singular. Therefore, prolonged use of chemical medications is associated with potential risks including ketoacidosis, secondary failure, chronic liver and kidney damage, gastrointestinal dyspepsia, hypoglycemia, heart failure and other adverse reactions. 9 Investigating the mechanisms underlying type 2 diabetes and exploring novel therapeutic agents hole promise for improving clinical outcomes and addressing the needs of diabetes patients, representing a focal point in current research.
Traditional Chinese medicine (TCM), which focuses on holistic diagnosis and treatment, adopts a comprehensive approach to regulate the body's qi, blood, yin, and yang. This approach is effective in both preventing and treating diseases, including Type 2 diabetes mellitus (T2DM), and offers unique insights into managing its complications. JWJT is a preparation derived from renowned medical prescription in our hospital. With more than 50 years of clinical application, it has demonstrated remarkable efficacy in treating type 2 diabetes mellitus without adverse effects. JWJT is formulated from nine types of herbs: Astragali radix, Asparagi radix, Puerariae thomsonii radix, Rubi fructus, Rehmanniae radix, Rehmanniae radix praeparata, Trichosanthis radix, Lycii fructus and Alismatis rhizome. These ingredients undergo water extraction and alcohol precipitation to produce the final formulation. As a compound preparation, JWJT exhibits a complex compatibility relationship and chemical composition, posing challenges for comprehensive research into its overall quality control and underlying mechanisms of action. Currently, Astragali radix, Lycii fructus, and Puerariae thomsonii radix in JWJT have only been identified via TLC, with their quality not comprehensively controlled. In efforts to standardize the quality research of TCM and enhance its quality control and evaluation standards, this study advocates selecting active ingredients strongly correlated with preparation efficacy as quality control indicators to elevate overall quality control standards. 10 Fingerprint of TCM provides a comprehensive means to characterize its chemical composition and assess the quality of TCM preparations in a holistic manner. 11 Chemical pattern recognition, a technique within chemometrics, utilizes algorithms such as classification, dimensionality reduction, and synthesis to interpret multi-indicator data from fingerprints. The integration of these approaches enables a systematic and comprehensive evaluation of TCM quality, and is widely applied in the quality control of TCM preparations. 12 Network pharmacology can rapidly discover the overall mechanism of TCM through the construction of a molecular network of “components-targets-pathways”. These networks serve as evaluation indices for assessing the clinical efficacy of TCM, thereby contributing to the enhancement of TCM quality. 13 Insulin resistance cell model is utilized to investigate the direct impact of intervention factors on insulin resistance, facilitating the screening of active compounds with potential to improve insulin resistance sensitivity. α-Glucosidase plays a role in regulating postprandial blood glucose level, making it convenient to screen hypoglycemic active components by comparing their inhibitory activity against α-glucosidase. 14
In this study, network pharmacology was employed to find potential targets and pathways, and predict effective substances. The HPLC fingerprint of JWJT was established through combining with chemical pattern recognition methods and preliminary screening of differential markers. Glucose consumption of insulin resistant HepG2 cells and α-glucosidase inhibitory activity were verified. The quality index components identified through these analyses were closely linked to clinical applications, providing a foundation for comprehensive quality control of JWJT.
Results
Network Pharmacology Studies
Active Ingredients and Action Targets
l63 active ingredients were obtained by searching TCMSP, ETCM and HERB databases, after prediction on the Swiss Target Prediction platform, 896 action targets were obtained based on the principle of “probability > 0”.
2DM Disease Targets
The GSE25724 chip was utilized to evaluate the transcriptome differences between 6 T2DM patients and 7 non-diabetic normal human pancreatic samples through microarray analysis. Results revealed 373 differential genes on the GSE25724 chip, comprising 116 up-regulated genes and 257 down-regulated genes. The first 50 differential genes were visualized using heat maps and volcano plots (Figure 1). Similarly, the GSE7014 chip was used to compare the gene expression profiles in skeletal muscle tissue between 20 T2DM patients and 6 non-diabetic normal humans. The analysis identified 331 differential genes on GSE7014 chip, with 265 up-regulated genes and 66 down-regulated genes. The first 50 differential genes were visualized using heat maps and volcano maps (Figure 2); In addition, a search in the GeneCards database identified 228 T2DM targets. After removing duplicates with T2DM targets from the GEO datebase chip, a total of 904 unique targets were obtained.

Differential gene heat map (A) and volcano map (B) of the first 50 positions of GSE25724 chip.

Differential gene heat map (A) and volcano map (B) of the first 50 positions of GSE7014 chip.
PPI Diagram
The action targets of the components intersected with T2DM targets yielded 104 common targets. These targets were analyzed for interaction relationships using String database and the results were imported into Cytoscape 3.8.2 software. By combining the degree with the median of the betweenness centrality (BC) and the closeness centrality (CC), 39 core targets were identified. These core targets were used to construct a PPI core protein network diagram (Figure 3), The five core targets with the highest degree value are AKT1, EGFR, PIK3R1, INSR and TNF.

PPI diagram of T2DM core targets.
Pathway Analysis
Through KEGG enrichment analysis,128 signal pathways were identified, with the top 20 pathways selected based on the P value ranking for classification and visual analysis (Figure 4). These pathways prominently include the EFGR tyrosine kinase inhibitor resistance pathway, AGE-RAGE signaling pathway in diabetic complications, HIF-1 signaling pathway, PI3K-Akt signaling pathway, insulin resistance, MAPK signaling pathway, among others. These pathways collectively form the “components-targets-pathways” molecular network integrating the components and common targets (Figure 5). Network topology structure analysis was conducted to compute the topology parameters of network nodes and identify core active ingredients. Active ingredients were screened based on betweenness centrality, closeness centrality, and degree values are all greater than the average value. The top 5 active ingredients with the highest degree values identified through screening are considered the core ingredients: kaempferol, ellagic acid, kaempferol-3-O-rutinoside, puerarin and calycosin.

KEGG pathway enrichment analysis.

Network diagram of “active ingredient-target-pathway”.
Molecular Docking Results
Five core targets are utilized as receptors, while five core component structures served as ligands for molecular docking. The binding energies between the components and targets were all below 7.0 kcal·mol^–1, indicating strong binding capacity. Notably, AKT1 and EGFR target proteins exhibited strong binding capacity with all five active components, displaying binding energies below −8.2 kcal·mol^–1. These findings underscore the potent binding capabilities of these components with their respective targets, positioning them as pivotal entities in disease treatment, illustrated in Figure 6.

Molecular docking bind energy.
Calycosin demonstrated the closest binding affinity to AKT1 based on binding energy analysis, while kaempferol-3-O-rutinoside exhibited significant binding affinity with EGFR. Specifically, calycosin formed interaction bonds with amino acid residues THR-211, SER-205, LYS-268, and GLN-203, whereas kaempferol-3-O-rutinoside interacted with amino acid residues PHE-723, ASP-855, GLY-724, ASN-842, ARG-841, and MET-793. These interactions resulted in stable complexes between calycosin and AKT1, as well as kaempferol-3-O-rutinoside and EGFR, as depicted in Figure 7.

Molecular docking diagram of calycosin with AKT1 (A) and molecular docking diagram of kaempferol-3-O-rutinoside with EGFR (B).
Fingerprint Studies
Instrument Precision Test
The relative standard deviation (RSD) values for the measured common peaks in terms of relative retention time range from 0.04% to 0.57% (n = 6), indicating excellent precision. Similarly, the RSD values for the relative peak area range from 0.90% to 1.12% (n = 6), also reflecting high precision. These results affirm the instrument's capability to reliably determine the compounds from the fingerprint of JWJT.
Stability Test
The relative standard deviation (RSD) values for the relative retention time of each measured common peak range from 0.05% to 0.62% (n = 6), indicating good consistency and stability of the test solution over 24 h at room temperature. Similarly, the RSD values for the relative peak area range from 1.61% to 2.03% (n = 6), further confirming the stability of the experimental conditions. These findings suggest that the test solution remains stable and suitable for analysis within the specified timeframe and environmental conditions.
Repeatability Test
The relative standard deviation (RSD) values for the relative retention time of each measured common peak range from 0.06% to 0.51% (n = 6), indicating excellent repeatability of the experimental method. Similarly, the RSD values for the relative peak area range from 1.45% to 2.51% (n = 6), demonstrating good consistency in measuring peak areas across multiple samples. These results collectively indicate that the experimental method exhibits strong repeatability, ensuring reliable and consistent results in the analysis of the samples.
Fingerprint and Correlation Analysis of JWJT
A total of 10 common peaks were identified from 12 batches of JWJT samples, and the overlay and control fingerprints are depicted in Figure 8. The similarity scores (S1∼S12) between samples were found to be 0.990, 0.997, 0.994, 0.995, 0.994, 0.994, 0.998, 0.996, 0.995, 0.994, 0.995, and 0.991 respectively. All similarity values exceeded 0.99, indicating high consistency among different batches of JWJT samples and confirming a uniform and stable production process. By comparing the retention times of chromatographic peaks between sample and mixed reference chromatograms, four common peaks were identified in the fingerprint of all 12 batches of JWJT samples. These peaks are: peak 4 (puerarin) from Puerariae thomsonii radix, peak 8 (calycosin) from Astragali radix, peak 9 (ellagic acid) from Rubi fructus, and peak 10 (kaempferol-3-O-rutinoside) from Astragali radix and Puerariae thomsonii radix, as shown in Figure 9.
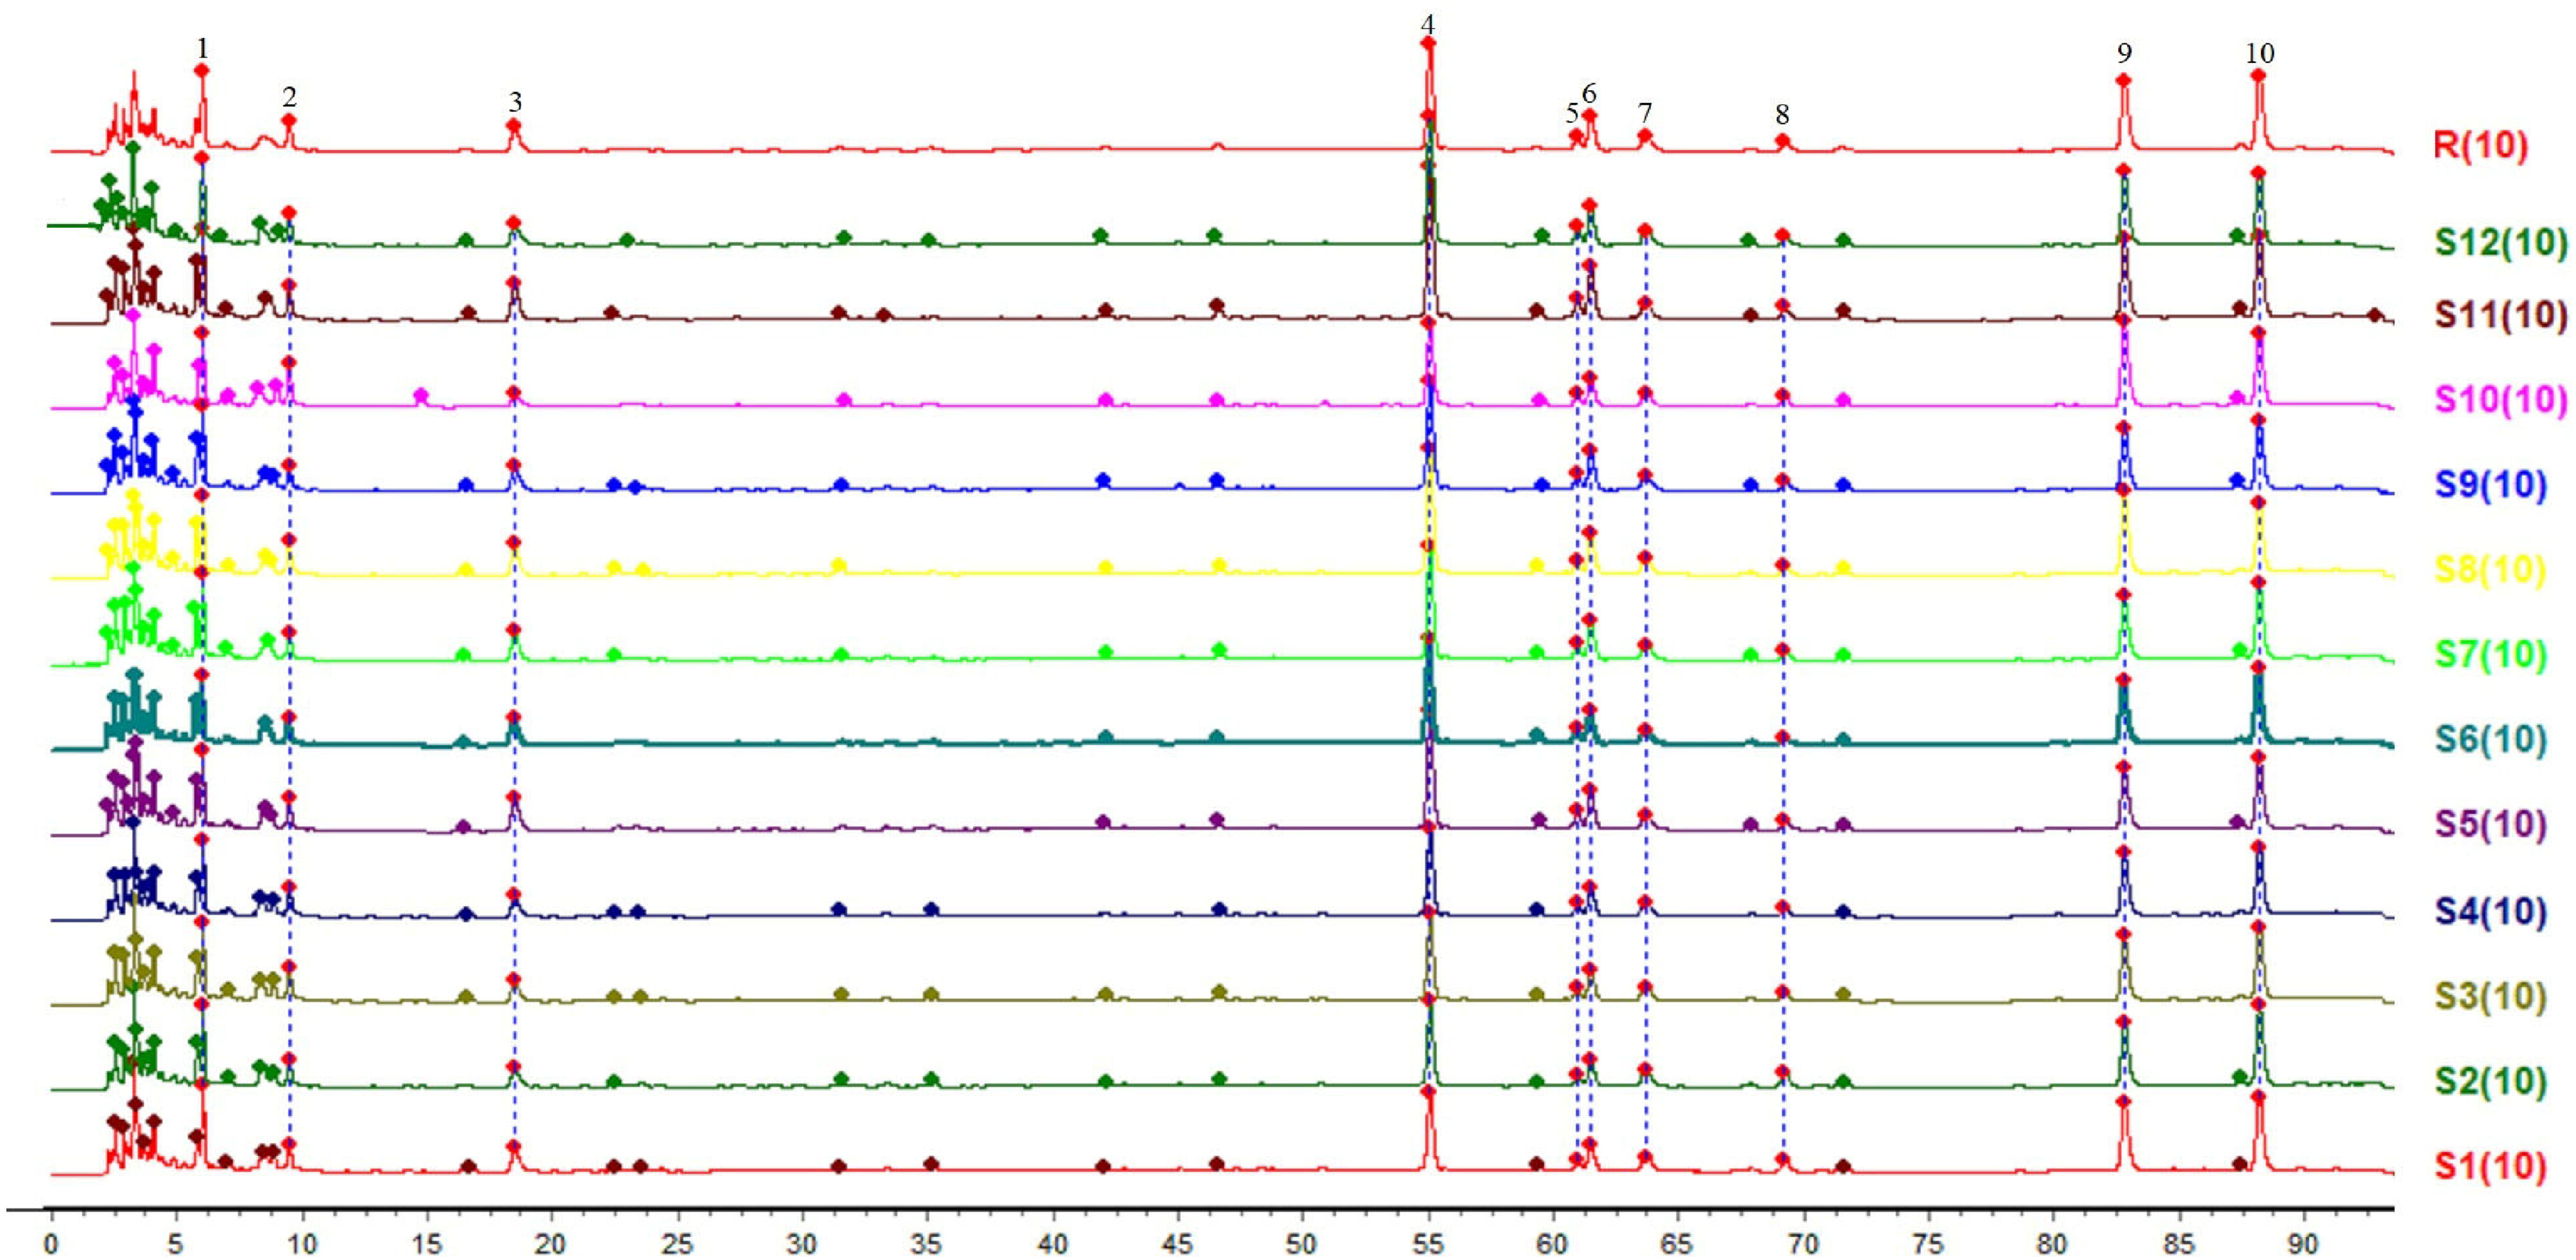
12 batches of SQTM HPLC fingerprint chromatograms (S1∼S12) and their reference chromatograms (R).

HPLC chromatograms of reference solution (A) and the test solution (B) of JWJT.
Chemical Recognition Pattern Analysis
CA
The clustering analysis of 12 batches of JWJT samples is depicted in Figure 10, revealing two distinct categories. Class I comprises smples S1, S2, S3, S4, and S5, representing JWJT batches produced in different batches in 2020. Class II includes samples S6, S7, S8, S9, S10, S11, and S12, corresponding to JWJT batches produced in different batches in 2021. This indicates that JWJT samples produced within the same year exhibit minimal and consistent differences. This finding is corroborated by the results of similarity evaluation, where S10 and S2 show indistinct differentiation, potentially influcenced by variations in medicinal source materials and processing of decoction pieces.
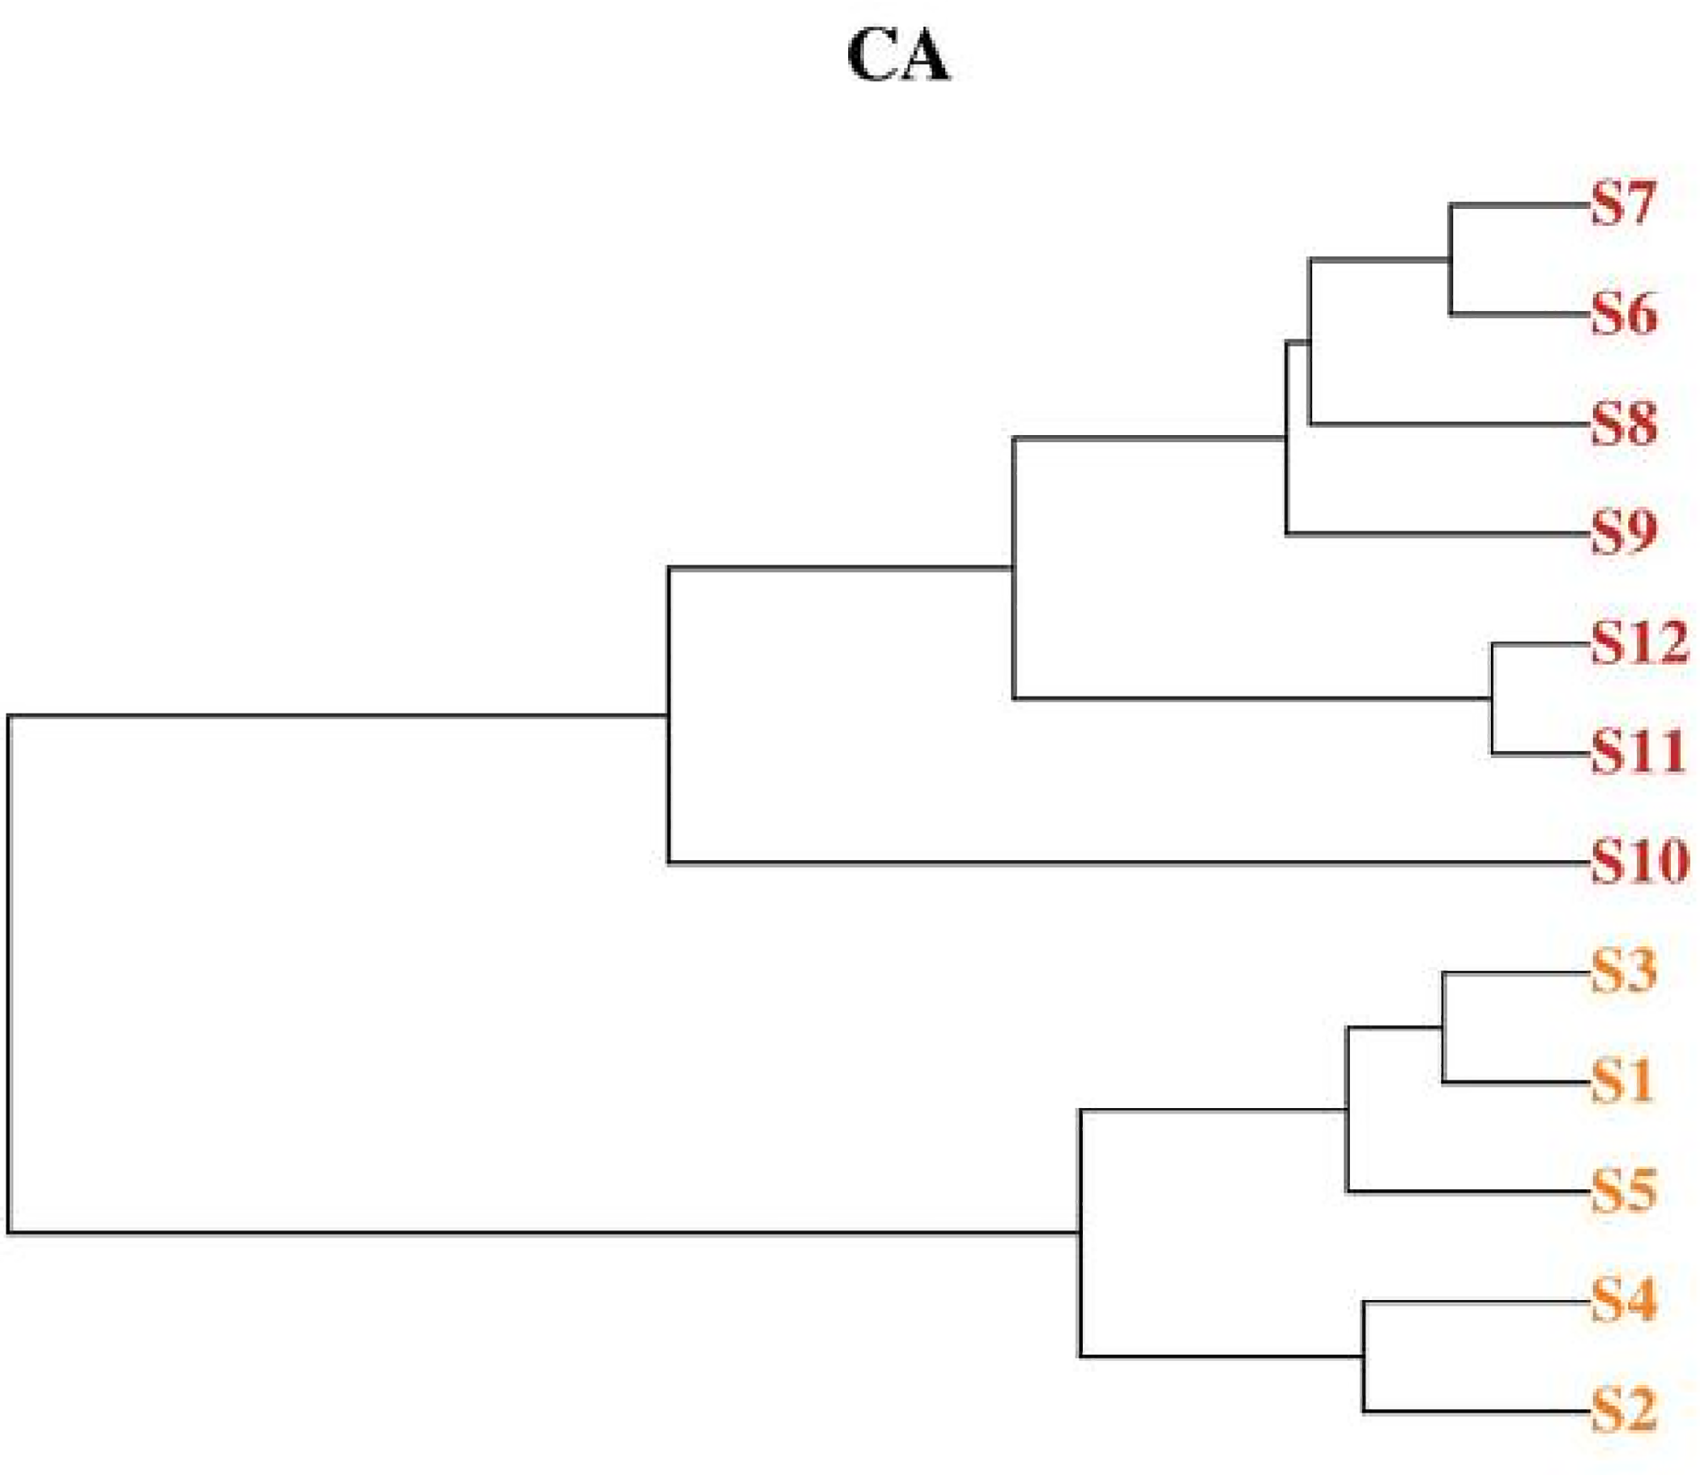
Ca diagram for 12 batches of JWJT.
PCA
PCA reduces the original data into principal components that contain comprehensive and non-overlapping information, facilitating quick identification of patterns and relationships. The PCA results for 12 batches of JWJT samples show that PCA1 explains 97.11% of the variance, while PCA2 explains 2.39%, indicating robust predictive capability. The score matrix in Figure 11 reveals that the 12 batches of JWJT samples cluster into two distinct groups. Specifically, samples S1, S2, S3, S4, and S5 form one group, while samples S6, S7, S8, S9, S10, S11, and S12 constitute the second group, consistent with the results of cluster analysis (CA).

PCA plot of 12 batches of JWJT.
PLS-DA
To enhance differentiation between groups and minimize result variability, the peak areas of 10 common peaks from 12 batches of JWJT were subjected to Partial Least Squares Discriminant Analysis (PLS-DA), illustrated in Figure 12A. To ensure the robustness of the PLS-DA model and avoid overfitting that could compromise accuracy, the model underwent 200 iterations of cross-validation. The validation results are presented in Figure 12B, where the following indicators were assessed: the model fitting parameter R^2 = 0.9175, and the model prediction parameter Q^2 = 0.8449. Both R^2 and Q^2 values exceed 0.5, with an intercept of Q^2 = -1.3753, indicating the model's reliability and absence of overfitting. These findings validate the results, affirming their suitability for screening key components.12 batches of samples are obviously divided into two categories on their preparation time: S1, S2, S3, S4, S5 form one category, while S6, S7, S8, S9, S10, S11, and S12 form another. The clustering analysis shows strong efficacy, consistent with both CA and PCA results. Markers differentisting JWJT, identified through the VIP method, typically fall within a 95% confidence interval, where VIP > 1 plays an important role in classification. Figure 12C illustrates the degree of contribution to sample classification, highlighting significant components such as chromatographic peaks 3, 2, 8 (containing calycosin), 4 (containing puerarin), and 9 (containing ellagic acid). These finding underscore the importance of monitoring calycosin, puerarin, and ellagic acid through JWJT production to minimize batch-to-batch variations. This insight guides the selection of control indicates for JWJT production.
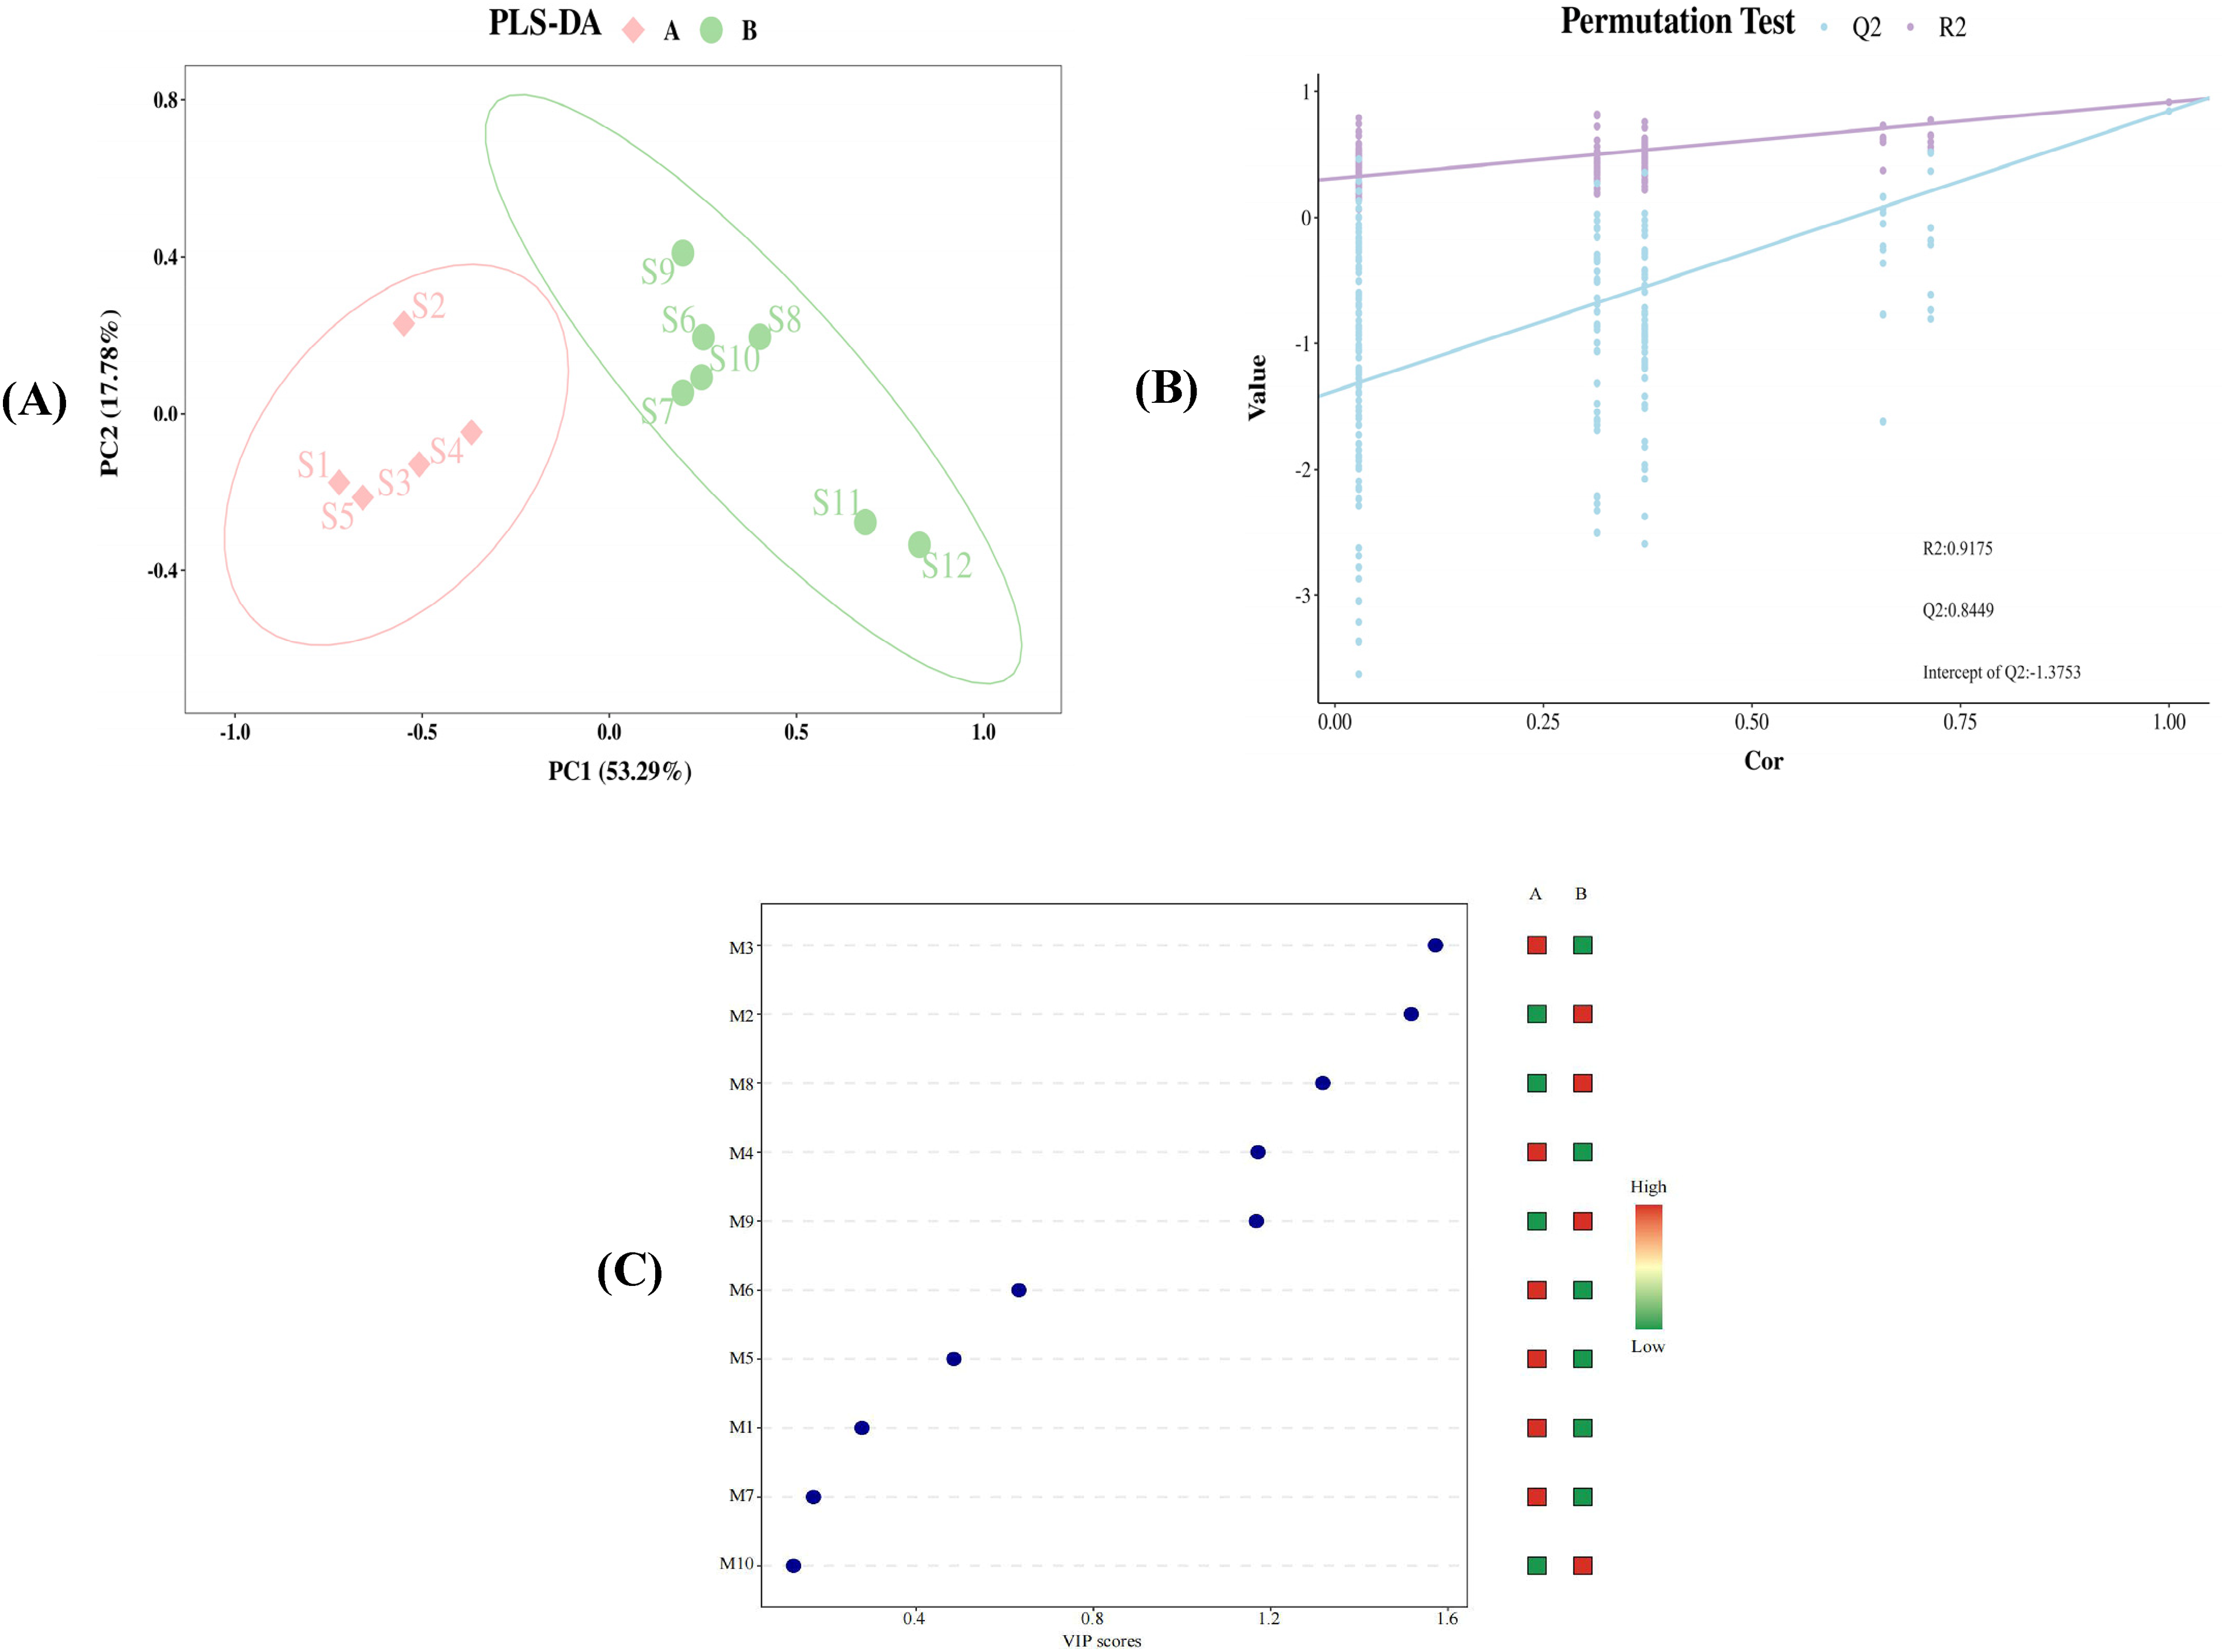
Model scores (A), model permutation test (B) and VIP values (C).
In Vitro Experiment
This study employed glucose consumption in insulin-resistant HepG2 cells and α-glucosidase inhibitory activity to validate the reliability of network pharmacology predictions. Key active ingredients identified through network pharmacology and chemical pattern recognition—puerarin, ellagic acid, and calycosin—were selected for testing. In the glucose consumption assay of insulin-resistant HepG2 cells, compared to the normal control group, the glucose content in the culture medium of HepG2 cells significantly increased in the model group, indicating successful establishment of insulin resistance (P < 0.01). Conversely, compared to the model group, puerarin, ellagic acid, and calycosin significantly reduced glucose content in the culture medium of insulin-resistant HepG2 cells (P < 0.01), as depicted in Figure 13A.

Glucose consumption (A) and α-glucosidase inhibition rate (B). Note: (A) ##P < 0.01 compared with blank group; **P < 0.01 compared with model group. (B) **P < 0.01.
In the α-glucosidase inhibitory activity test, acarbose at 1 mg·mL^-1 as the positive control exhibited 94.03% inhibition of α-glucosidase. At the same concentration (1 mg·mL^-1), ellagic acid showed the strongest inhibitory effect on α-glucosidase activity among the three compounds (P < 0.01), as shown in Figure 13B.
Discussion
According to network pharmacology and molecular docking, the active ingredients of Jiuwei Jiangtang Oral Liquid in the treatment of T2DM were explored.15,16 Studies indentified its material basis using fingerprint to establish 12 batches of JWJT, with four common peaks identified. The fingerprint results were assessed for similarity and chemical recognition using CA, PCA, and PLS-DA. Twelve batches of JWJT, divided into two categories by preparating time, showed a similarity above 0.99, indicating the homogeneity and stability of JWJT. PLS-DA analysis identified the five differential compounds; puerarin, calycosin and ellagic acid were found to affect the quality differences among groups. These three components heightened attention in production. T2DM, characterized by insulin resistance and hyperglycemia, showed improved glucose consumption in insulin-resistant Hep G2 cells and α-glucosidase inhibitory activity with these markers. Puerarin, calycosin and ellagic acid are proposed as the key pharmacodynamic basis for JWJT in the intervention of T2DM. They regulate MAPK, HIF-1, PI3K-Akt pathways, enhancing insulin metabolism and improving insulin resistance via potential proteins AKT1, EGFR, PIK3R1, INSR, TNF, etc 17
The puerarin, calycosin, and ellagic acid are key effective in ingredients in the treatment of T2DM, as supported by multiple previous studies. Calycosin, found in Astragali radix of TCM, is recognized as a significant active ingredient. It possesses various beneficial properties including anti-lipid peroxidation and anti-inflammatory effects. Additionally, calycosin is known for its protective effects against diabetic nephropathy. 18 Puerarin is a bioactive isoflavone component found in Puerariae thomsonii radix, a herb used in TCM. It is known for its ability to significantly improve conditions associated with T2DM, including insulin resistance, lipid dysregulation, pancreatic dysfunction, and inflammatory activity. 19–21 . Ellagic acid, the main active ingredient in Rubi fructus of TCM, exhibits significant antidiabetic and anti-inflammatory propertie. 22 Research indicates that ellagic acid can improve oxidative stress and insulin resistance in HepG2 cells induced by high glucose levels, potentially through the activation of Keap1-Nrf2 mediated by miR-223. This mechanism underscores its potential therapeutic role in managing T2DM. 23 The overexpression of AKT1, a critical target in insulin signal transduction, has been associated with disruptions in glucose regulation and the induction of insulin resistance within insulin-sensitive tissues.24–26 EGFR, or Epidermal Growth Factor Receptor, is a tyrosine kinase that plays a pivotal role in cellular homeostasis regulation. It activates various downstream signaling pathways, such as the PI3K-AKT and MAPK pathways, which are crucial for controlling processes like cell apoptosis. This study revealed that inhibiting EGFR activity not only significantly suppresses the progression of diabetic nephropathy but also improve insulin resistance. 27 Insulin receptor (INSR) plays a key role in maintaining glucose homeostasis. 28 Knockout of INSR specifically in β cells has been shown to inhibit glucose-stimulated insulin secretion, 29 and interference with the INSR recovery process can lead to insulin resistance and subsequently T2DM. 30 Reduced expression of PIK3R1, the key target in insulin action, improves glucose tolerance and insulin sensitivity, 31 whereas disfunction of PIK3R1 results in severe insulin resistance.32,33 Cytokine TNF-α is implicated in T2DM pathogenesis. 34 Increased secretion of TNF-α negatively regulates insulin receptor substrate 1 (IRS-1), contributing to insulin resistance. 35 Glucose uptake and improvement of IR can be increased by activating the IRS-1/PI3 K/Akt pathway in HepG2 cells stimulated by glucosamine (GlcN), and then the PI3 K inhibitor is used to confirm that PI3 K/Akt pathway can be regulated to mitigate T2DM. 36 HIF-1 pathway significantly influences metabolic diseases; its imbalance leading to hypoxia damage, promotes diabetes and its complications. 37 The MAPK signaling pathway mediates glucagon's role in regulating glucose homeostasis and contributes to T2DM pathogenesis. 38 The literature indicates a correlation between quality control components, key targets, and pathways, which aligns with clinical applications.
In conclusion, this study utilized network pharmacology to screen 5 main active ingredients related to the efficacy of JWJT, identified 4 compounds through the fingerprinting of 12 batches of JWJT, and 3 differential components using stoichiometric methods. Finally, based on the glucose consumption of insulin-resistant Hep G2 cells and α-glucosidase inhibitory activity, puerarin, ellagic acid and calycosin were preliminarily identified as the quality control indicators for JWJT, therefore enhancing the overall quality control of JWJT.
This study employed the network pharmacology method for JWJT, complemented by fingerprint and chemometric methods, offering insights into overall quality control. This is expected to elevate the quality standards of JWJT and provide theoretical backing for its mechanism of action of JWJT. However, the study has some limitations: it did not explore the synergy among the predicted effective ingredients, multiple targets, and multiple signaling pathways. Moreover, the validation method was limited to in vitro experiments, without investigating the effective ingredients in vivo. Future research should include more comprehensive efficacy evaluations to provide a more robust experimental basis. This would support the study's finding and offer theoretical insights for further clinical application and advancement.
Materials and Methods
Drugs
Jiuwei Jiangtang Oral Liquid (batch number: 20200401, 20200702, 20200801, 20201101, 20201102, 20210402, 20210601, 20210701, 20210801, 20210901, 20211001, 20211101); Metformin hydrochloride tablets (Shanghai Squibb Pharmaceutical Co., Ltd, batch number: ABZ8875). The reference substance puerarin (batch number: 110752-201816, purity: 95.40%) was purchased from China Academy of Food and Drug Control, and the calycosin (batch number: A807AS, purity: 98.00%) was purchased from Dalian Meilun Biotechnology Co., Ltd, ellagic acid (batch number: MUST-2106021, purity: 99.84%), kaempferol-3-O-rutinoside (batch number: MUST-21040704, purity:99.07%) was purchased from Chengdu Manster Biotechnology Co., Ltd.
Cells
HepG2 cells were presented by Ma Hongmei, associate professor of the College of Traditional Chinese Medicine, Xinjiang Medical University.
Reagents
Blood glucose test dry tablets (dry chemical method, batch number 0321285249) were purchased from Nova Biomedical Co., Ltd Glucose (GLU) kit (glucose oxidase method GOD) (batch number: 20211126) was purchased from Nanjing Jiancheng Bioengineering Research Institute.
Instruments
High performance liquid chromatograph (HPLC) (Agilent Technology Co., Ltd, model 1260); Carbon dioxide incubator (Taicang Yisigao Medical Device Technology Co., Ltd, model CLM-170B-8-CN); Super clean workbench(Suzhou Antai Air Technology Co., Ltd, model SW-CJ-2FD); Inverted microscope(Guangzhou Mingmei Photoelectric Technology Co., Ltd, model MI52-N); Full wavelength microplate reader (Thermo Scientific, model Multiskan Skyhigh); Blood glucose detector(Nova Biomedical Co., Ltd, model StatStrip Xpress2).
Network Pharmacology Studies
Screening of Active Ingredients and Prediction of Potential Targets
In TCMSP, ETCM and HERB databases, search for active ingredients of “Astragali radix”, “Asparagi radix”, “Puerariae thomsonii radix”, “Rubi fructus”, “Rehmanniae radix”, “Rehmanniae radix praeparata”, “Trichosanthis radix”, “Lycii fructus” and “Alismatis rhizome”, the screening index and threshold are oral bioavailability (OB) ≥ 30%, Drug Likeness (DL) ≥ 0.18, collect eligible active ingredients; search through Pubchem, the obtained SMILES chemical formula is input to the Swiss Target Prediction platform to obtain the potential target of each active ingredient, and the JWJT component action targets are obtained by combining and deduplicating.
T2DM Targets Screening
Obtain the data of GSE25724 and GSE7014 chips and platforms through the NCBI gene expression database, annotate and sort out the data of the two groups of chips respectively, clean the data with R language, conduct secondary analysis, identify the differential expression genes of chip data with lima package, assign P value < 0.05 and | log2 (fold change) | > 1, and draw heat maps and volcano maps. T2DM related targets were retrieved from GeneCards database with “Type 2 diabetes mellitus” as the search term, and the restrictive condition of Relevance score ≥ 50 was set. The targets obtained were combined with the differential gene of GEO chip data to obtain T2DM targets.
Protein Interaction Network (PPI) Construction and Core Targets Screening
Component action targets cross T2DM targets, import the intersection targets into the String database, set the species as “Homes sapiens”, set the parameters as default settings, use cystoscope 3.8.2 for visualization, and screen out core targets.
Pathway Analysis
The DAVID biological information annotation database was used to carry out KEGG enrichment analysis on core targets. The species was selected as “Homes sapiens”, with a limit of P ≤ 0.05. The top 20 KEGG pathways were selected for visual analysis. Cytoscape 3.8.2 software was used to build a “components-targets-pathways” molecular network with pathways, components and targets, and screen core components.
Molecular Docking Verification
Download the 3D structure of core components through Pubchem platform, download the protein crystal structure of core targets in the PDB database, and use PyMOL 2.4.0 to dehydrate and remove ligands from the obtained receptors; Autodocktools 1.5.7 software was used to process the conversion format,such as hydrogenation and calculation of charge number, and then molecular docking was carried out. The docking affinity was observed to reflect the stability of intermolecular binding.
Fingerprinting Studies
Chromatographic Conditions
Use Aglient Diamonsil C18 (250 × 4.6 mm, 5 μm) Chromatographic column, mobile phase is methanol (C) and 0.2% phosphoric acid water (D), elution gradient: 0∼12 min, 95% D; 12∼50 min, 95%→75% D; 50∼60 min, 75%→70% D; 60∼75 min, 70%→65% D; 75∼90 min, 65%→50% D. Detection wavelength: 260 nm, flow rate: l mL·min^-1, column temperature: 30 °C, injection volume: 10 μL.
Mixed Reference Solution
Weigh accurately a quantity of ellagic acid, kaempferol-3-O-rutinoside, puerarin and calycosin reference substances into a 20 mL volumetric flask, add methanol to constant volume, and prepare mixed reference solution containing the above ingredients in mass concentrations of 50.37, 12.64, 22.79 and 38.35 μg·mL^-1.
Test Solution
Take 12 batches of JWJT, measure accurately 1.0 mL into a 10 mL volumetric flask, add methanol to fix volume to scale and mix, take the supernatant, filter it through 0.45 μm membrane, and take the continued filtrate.
Instrument Precision Test
Take the same batch of JWJT (S1), prepare the test solution, inject samples for 6 consecutive times according to the chromatographic conditions, and calculate the relative retention time and relative peak area with peak 4 (puerarin) as the reference peak.
Stability Test
Take the same batch of JWIT (S1) test solution, inject samples at 0, 2, 4, 8, 12, 24 h respectively according to the chromatographic conditions, and calculate the relative retention time and relative peak area with peak 4 (puerarin) as the reference peak.
Repeatability Test
Take the same batch of JWJT (S1) preparing 6 samples of test solution, inject samples for detection according to the chromatographic conditions, take peak 4 (puerarin) as the reference peak, and calculate the relative retention time and relative peak area.
Establishment of Fingerprint and Similarity Analysis
Take 12 batches of JWJT samples (Sl-S12), prepare the test solution, inject samples according to the chromatographic conditions, and record the chromatogram. The chromatogram was imported into the similarity evaluation system of chromatographic fingerprint of TCM (2012.130723 version), and the overall similarity evaluation was conducted with reference to the reference chromatogram R.
Identification of Common Peaks and Drug Attribution
Take the test solution and mixed reference solution, inject and measure them respectively according to the chromatographic conditions, and record the chromatogram. By comparing the retention time of the sample chromatographic peak and the mixed reference chromatographic peak, identify the common peaks in the fingerprint of 12 batches of JWJT samples, and assign the common peaks to the drug taste.
Chemical Recognition Pattern Analysis
Cluster Analysis (CA)
Take the common peak area of 12 batches of JWJT samples as the original data, use the Origin 2021 software for systematic cluster analysis, adopt the inter group average connection method, and the measurement scale is Euclidean.
Principal Component Analysis (PCA)
Select the common peak area of 12 batches of JWJT samples as a variable, use SPSS 26 software for processing, and uses the PCA calculated by unsupervised pattern recognition method to naturally aggregate the samples.
Partial Least Squares Discriminant Analysis (PLS-DA)
Take the peak areas of the common peaks of 12 batches of JWJT samples as the original data, and carry out PLS-DA processing in the supervised mode. The variable importance in the projection (VIP) method was used to screen the difference markers of JWJT.
In Vitro Experimental Studies
Preparation of Compound Samples
Accurately weigh 1 mg of the compound reference powder, place it in an Eppendorf tube, dissolve with DMSO, and prepare a sample solution with a mass concentration of 1 mg·mL^-1 for use.
Glucose Consumption of Insulin Resistant HepG2 Cells
Comply with the reference method, 39 applying 30mmo/L glucose to HepG2 cells for 48 h to establish insulin resistance model. HepG2 cells with a concentration of 2 × 10⁵ cells·mL−1 were evenly mixed and inoculated into a 96 well plate. The normal control group, model group, positive drug group (metformin 0.1 mg·mL^-1), and test drug group (compound 0.1 mg·mL^-1) were set up, and three double wells were set up in each group. The normal control group was not treated and cultured normally; the drug group and the model group were cultured in DMEM high glucose medium to establish insulin resistance cell models. After 24 h of drug intervention, the cell supernatant was taken to measure the glucose content with the glucose oxidase method, and the glucose consumption (GC) of the cell to the supernatant was calculated according to the glucose content.
α-Glucosidase Activity
Take 50 μL sample solution of compound to be tested and 50 μL α-glucosidase (0.5 U·mL^-1) in sequence, incubated at 37 °C for 10 min; add 50 μL substrate (p-nitrophenyl-α-D-glucopyranoside, 2.5 mmol·L^-1) solution and 200 μL phosphate buffer (pH 6.8), incubation at 37 °C for 30 min; then add 500 μL Na2CO3 (1 mol·L^-1) solution to terminate the reaction. After mixing evenly, measure the absorbance A at the wavelength of 405 nm. Perform parallel measurement for 3 times, and take the average value. Use acarbose solution with a mass concentration of 1.0 mg·mL^-1 as the positive control instead of the sample solution, other conditions remain unchanged, after the reaction, determine the absorbance. 40 The inhibition rate of the sample on α-glucosidase was calculated according to the formula. Inhibition rate (%) = [1 - (A1 - A2) / A0)] × 100% (A1 is the absorbance of added sample solution; A2 is the absorbance of replacing the α-glucosidase solution with phosphatic buffer solution; A0 is the absorbance of replacing the sample solution with phosphate buffer solution).
Statistical Analysis
SPSS 26.0 software was used for analysis and processing, and the data were expressed by mean ± standard deviation (±SD), single factor variance (ANOVA) and independent sample t-test were used, P < 0.01 showed that the difference was statistically significant.
Footnotes
Authorship Contribution Statement
Methodology, investigation, formal analysis, visualization, and writing original draft: Qian Li, Li Wang, Jingnan Pei and Jinsha Li. Validation and writing-original draft: Qian Li, Danjian Qin and Huining Mo. Conceptualization, writing-review &editing, supervision, and project administration: Hongping Zhang.
Acknowledgments
The authors would like to extend their sincere gratitude and acknowledge the unyielding support of Xuezheng Liang throughout this research.
Declaration of Conflicting Interests
The authors declared no potential conflicts of interest with respect to the research, authorship, and/or publication of this article.
Ethical Approval
Ethical Approval is not applicable for this article.
Funding
The authors disclosed receipt of the following financial support for the research, authorship, and/or publication of this article: Scientific Research Project of Administration of Traditional Chinese Medicine of Guangxi Zhuang Autonomous Region (GZZC2020393), General Project of Natural Science Research Project of Guangxi University of Traditional Chinese Medicine (2020MS053).
Statement of Human and Animal Rights
There are no human subjects in this article and human and animal rights are not applicable.
Statement of Informed Consent
There are no human subjects in this article and informed consent is not applicable.