The 13C-NMR data described for perezone (1), a 3-hydroxy p-quinone stated as the first natural product isolated as crystals in the New World, and rigidone (2), a 4-hydroxy o-quinone isolated from a coral species, are essentially the same. Some years ago, we described, using theoretical calculations, that a 4-hydroxy-1,2-quinone is more than 11 kcal/mol less stable than a 3-hydroxy-1,4-quinone making coexistence in nature of this type of quinones. In the present study, we approach the situation by comparing of the experimental 13C-NMR data for 1 and those described for 2 with the calculated using computational methods. Additional evidence was obtained from a X-ray diffraction analysis for the reaction product of perezone with o-phenylendiamine.
Methods
The 13C-NMR data for the quinoid rings were calculated using the GIAO and CSGT methods, density functional theory (DFT) and the functional/basis set pairs B3LYP/6-31 g(d,p) and MPW1PW91/6-31 g(d,p); and TPSSTPSS/cc-PVTZ and PBE1PBE/aug-cc-PVDZ. Perezone reaction with o-phenylenediamine was achieved using a described method in MeOH at room temperature. X-Ray diffraction analysis of phenazine from perezone reaction was done using MoKα radiation. The data were used to calculate the Flack parameter.
Results
After conformational analysis, complete optimization of the geometry of the conformers found and, calculation of the 13C-NMR chemical shifts for the quinone ring of 1 and 2, in all cases a better agreement was observed between the experimental data for 1versus2. Perezone reaction with o-phenylenediamine afforded the corresponding phenazine in its amine-keto tautomeric form as evidenced from a X-ray diffraction study.
Conclusion
The better agreement observed between the experimental and calculated data for 1versus2, along with the free energy difference of more than 11 kcal/mol in favor of the 3-hydroxy p-quinone versus 4-hydroxy o-quinone, previously established for us, allow to say that the structure described for rigidone corresponds to ent -perezone.
Perezone (1) (Figure 1) is an extraordinary molecule that, since its isolation in the New World in 1852,1 remains current and generating interesting results for the natural products chemistry understanding.2,3 In this sense, Prof. Pedro Joseph-Nathan contribution has been invaluable as can be seen from the almost thirty contributions related to structural assignment, isolation from different sources, NMR studies, cyclizations, biological activity and vibrational circular dichroism studies from 1965 to 2023.2–4
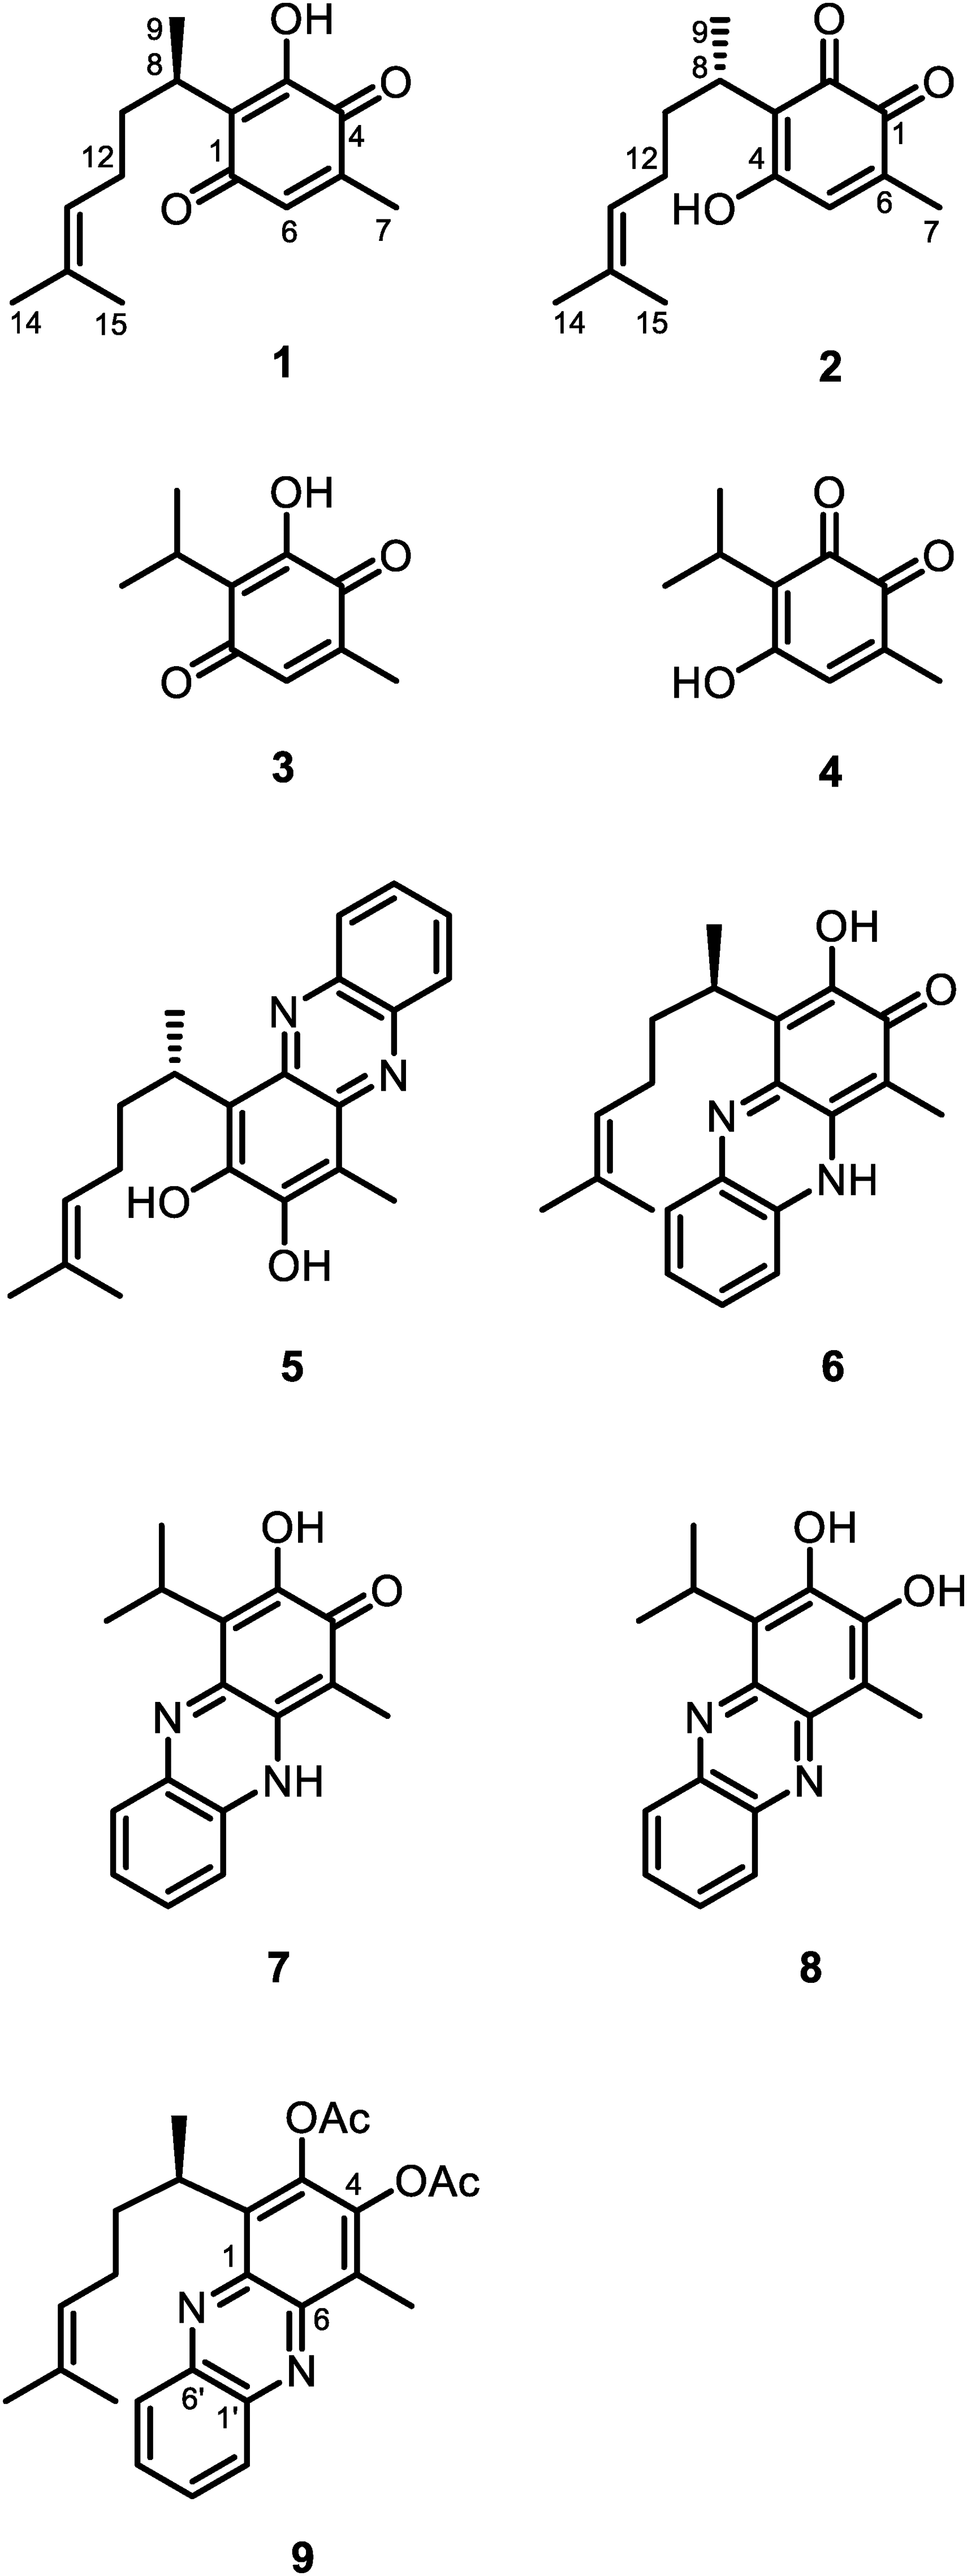
Formulas of perezone (1), rigidone (2) and their analogues (3 and 4) and, phenazine derivatives (5–9).
Rigidone (2) (Figure 1) is an o-quinone, described as a natural product isolated from the coral Pseudopterogorgia rigida,5 whose structural deduction was based on spectroscopic data, including 1D- and 2D-NMR experiment. The observed correlations at the HMBC NMR experiment were consistent with either p-quinone or o-quinone.5 Structural evidence was taken from the rigidone reaction with o-phenylenediamine, from which diazine 3 (Figure 1) was described as the reaction product. The formation of 3 was described as an unexpected and unclear hydroxylation reaction of the o-phenylenediamine addition product to rigidone. The absolute configuration of rigidone was assigned by comparison of its optical rotation with that observed for other structurally related sesquiterpenes, which is not a good practice, since it has been observed that small structural changes can give rise to a specific rotation sign change.6,7
Perezone (1) and diperezone also have been described from the same coral species P. rigida,8,9 and their structure deduced by comparison with spectroscopic data described for terrestrial natural products.10,11 Unfortunately, in no case has explicit optical rotation comparison been shown.
A close observation of the 13C-NMR chemical shifts for 1 and those described for 25 shown that these data are essentially the same. In addition, it has been described for simple quinones that the chemical shift of the carbonyl groups in p-quinones is around 187 ppm; while in o-quinones it is around 180 ppm.1213C-NMR substituent chemical shifts in hydroxy-p-benzoquinones also has been described for us 24 years ago.13
The molecular structure of 1 and 2 show that, regardless of the alkyl chain absolute configuration, these two molecules are tautomers. A similar situation that we faced some years ago for the romulogarzone and the icetexone structure where, through theoretical calculations, it was shown that between a 2-hydroxy-1,4-quinone and its tautomer 4-hydroxy-1,2-quinone there is more than 11 kcal/mol energetic difference, which makes very unlikely the coexistence in nature of species with this type of tautomerism.14
Methods
General Experimental Procedures
1H, 13C, and 2D NMR experiments were acquired on a Bruker Avance III spectrometer (600 MHz for 1H and 150 MHz for 13C) in solutions using TMS as internal reference. HRMS data were obtained with the electron impact mode on a Jeol GCMateII spectrometer. Uncorrected melting points were obtained on an Electrothermal IA9100X1 apparatus. Column chromatography was achieved using Merck 230–400 mesh. Analytical TLC was carried out with Merck TLC Silica gel 60 F254 over aluminum sheets which were visualized by spraying an acid solution of ammonium cerium(IV) sulfate and heating.
Compounds
Perezone (1) and 3-hydroxythimoquinone (3) were obtained from a previous work.15
Reaction of Perezone with o-Phenylendiamine
To 1.0 g of perezone was reacted with 0.53 g (1.2 eq) de o-phenylendiamine in MeOH at rt for 2 h. The crude reaction was work-up as described.5 The obtained solid was dissolved in hot MeOH and left to room temperature. Diazine 6 was obtained (1.01 g, 78%) as dark red crystals. HRMSEI: m/z 336.1837 (calc for C21H24N2O2+, 336.1832). mp: 214.2–215.8 °C. 1H-NMR (600 MHz, DMSO-d6) δH: 8.05–7.91 (m, 2H, H-2′ and H-5′), 7.69–7.50 (m, 2H, H-3′ and H-4′), 5.05 (m, 1H, H-12), 4.05 (m, 1H, H-8), 2.45 (s, 3H, Me-7), 1.50 (s, 3H, Me-15), 1.41 (d, J = 7.03 Hz, 3H, Me-9), 1.28 (s, 3H, Me-14).
To 600 mg of phenazine (6), dissolved in 3 ml of pyridine, 3 ml of (Ac)2O were added. The reaction mixture was left at rt for 24 h. After this time, the reaction mixture was poured into ice water and extracted with EtOAc (x2). The organic phase was worked in the usual way. The reaction crude was purified by column chromatography on silica gel using hexanes-EtOAc gradient. From the fraction eluted with a 95:5 mixture, 560 mg (74%) of a white powder (9) was obtained which was recrystallized from EtOAc-hexanes. mp 84–86 °C. [α] (0.9, CHCl3): [α]589 −6.78, [α]578 −8.16, [α]546 −11.83 degrees. IR (CHCl3): 3011, 3023, 2967, 2933, 1773, 1417, 1372 and 1196 cm−1. 1H-NMR (300 MHz, CDCl3) δH: 8.26–8.16 (m, 2H, H-2′ and H-5′), 7.84–7.74 (m, 2H, H-3′ and H-4′), 5.10 (m, 1H, H-12), 4.12 (m, 1H, H-8), 2.71 (s, 3H, Me-7), 2.412 (s, 3H, COCH3-3 or COCH3-4), 2.408 (s, 3H, COCH3-3 or COCH3-4), 2.14 (m, 1H, H-10a), 1.94 (m, 3H, H-10b and H-12), 1.61 (brs, 3H, Me-14), 1.52 (d, J = 6.8 Hz, 3H, Me-9), 1.43 (s, 3H, Me-15). 13C-NMR (75 MHz, CDCl3) δC: 168.5 (COCH3-3), 167.7 (COCH3-4), 142.9 (C-3), 142.8 (C-4), 141.9 (C-1), 141.9 (C-6), 141.7 (C-1′), 141.7 (C-6′), 134.3 (C-2), 131.2 (C-13), 130.2 (C-3′ or C-4′), 129.9 (C-3′ or C-4′), 129.8 (C-2′ or C-5′), 129.5 (C-2′ or C-C-5′), 127.5 (C-5), 124.7 (C-12), 35.9 (C-10), 31.5 (C-8), 26.7 (C-11), 25.7 (C-15), 20.6 (COCH3), 20.4 (COCH3), 19.8 (C-9), 17.5 (C-14), and 11.1 (C-7).
Single-Crystal X-Ray Diffraction Analysis of Phenazine from Perezone
The data were collected on a Bruker D8 Venture diffractometer with MoKα radiation (λ = 0.71073 Å) at 293(2) K in phi and omega scans mode. Unit cell refinements using 1500 machine detected reflections were done with the APEX3 v2016.1 (Bruker AXS Inc., 2016) software. Crystal data were C21H24N2O2, M = 336.41, monoclinic, α = 90, γ 90, space group P21, a = 4.832(1) Å, b = 10.332(2) Å, c = 17.950(3) Å, β = 92.985(8), V = 895.0(3) Å3, Z = 2, ρ = 1.245 mg/mm3, μ = 0.080 mm-1, F(000) = 358 e, total reflections = 13228, unique reflections 1560 (Rint 0.0740), observed reflections 1192. The structure was solved by direct methods using the SHELXT 2014 program. For the structural refinement, the non-hydrogen atoms were treated anisotropically, and the hydrogen atoms, included in the structure factor calculation, were refined isotropically. The final R indices were [I > 2σ(I)] R1 = 4.9% and wR2 = 10.9%. Largest difference peak and hole, 0.118 and −0.178 e.Å3.
Computational Methods
13C-NMR Calculation
To calculate the 13C-NMR data of the perezone (1) and rigidone (2) quinone ring, 3-hydroxythymoquinone (3) and 4-hydroxy-3-isopropyl-6-methyl-1,2-benzoquinone (4) were used as models.
13C-NMR data were calculated using the GIAO and CSGT method at different levels of calculations according to what was reported for some natural products. In all cases, the continuous polarizable model (PCM) was used to consider the CDCl3 effects, and TMS was taken as reference.
In the GIAO method, full geometry optimization was done using density functional theory (DFT) with the functional/basis set B3LYP/6-31 g(d) and MPW1PW91/6-31 g(d,p), and the 13C-NMR data were calculated at the same level of calculations.16,17 In the CSGT method, the geometry optimization was done at the B3LYP/6-31 g(d) theory levels, while the δ13C-NMR were calculated using the functional/basis set TPSSTPSS/cc-PVTZ and PBE1PBE/aug-cc-pvdz.18,19
In all cases two and four minimum energy conformers, after complete geometry optimization, were observed for the p-quinone and o-quinone, respectively. These conformers were considered in the following steps.
After δ13C-NMR calculations at the mentioned levels of theory, the best results were observed using the CSGT method and DFT PBE1PBE/aug-cc-pvdz.
Statistical Analysis
Pearson correlation (r) and coefficient of determination (R2) were used to establish the dispersion of calculated NMR chemical shifts from experimental ones. Linear regression analyses were used to determinate the best fit between experimental NMR data and the different calculation basis sets and functionals. Statistical analyses were performed using GraphPad Software 8.0.1 (GraphPad, La Jolla, CA, USA).
Results
The quinone ring 13C-NMR chemical shifts of perezone (1) and rigidone (2) were calculated using the GIAO and CSGT methods as described,16–19 using density functional theory (DFT) and the functional/basis set pairs B3LYP/6-31 g(d,p) and MPW1PW91/6-31 g(d,p); and TPSSTPSS/cc-PVTZ and PBE1PBE/aug-cc-PVDZ, respectively.
After the conformational search, using the Monte Carlo protocol at the MMFF94 calculation level, and the single point energy calculation using DFT at the B3LYP/6-31 g(d) level, two and four conformers were observed for 3 and 4, respectively. The geometry of all these conformers was completely optimized (Figure 2) and the 13C-NMR chemical shifts calculated at the level of theory above mentioned. The final 13C-NMR calculated values were obtained by considering their contribution to the conformational population from ΔE and the Boltzmann equation. In all cases, a Pearson correlation analysis showed more appropriate coefficient of determination values (R2) for 1 (0.9991-0.9996) versus2 (0.9875-0.9880) (Table 1). The calculated slope (Table 1) showed a better fit between the experimental ones and those obtained with PBE1PBE/aug-ccPVDZ basis set and functional (Table 2 and 3). Table 3 shows the experimental 13C-NMR chemical shifts, obtained in CDCl3, for perezone (1), 3-hydroxythymoquinone (4) and those describer for rigidone (2).5 As can be seen, the best match is observed between the experimental data of perezone (1) and 3-hydroxythimoquinone (4) with those calculated for 3-hydroxythimoquinone, while the greatest dispersion corresponds to C-2 (10.7 ppm) and C-4 (−11.4 ppm) of rigidone (2).
The most stable DFT PBE1PBE/aug-cc-PVDZ conformers of 3 and 4.
Coefficient of Determination (R2) and Slope Values for the Experimental and Calculated 13C-NMR Chemical Shifts Comparison for the Quinone Ring of 1 and 2 at Different Level of Calculation.
B3LYP/6-31 g(d,p)
MPW1PW91/6-31 g(d,p)
TPSSTPSS/cc-PVTZ
PBE1PBE/aug-cc-PVDZ
1
2
1
2
1
2
1
2
R2
0.9996
0.9875
0.9994
0.9880
0.9991
0.9812
0.9995
0.9877
Slope
0.9652
0.9218
0.9715
0.9277
0.9682
0.9216
0.9979
0.9517
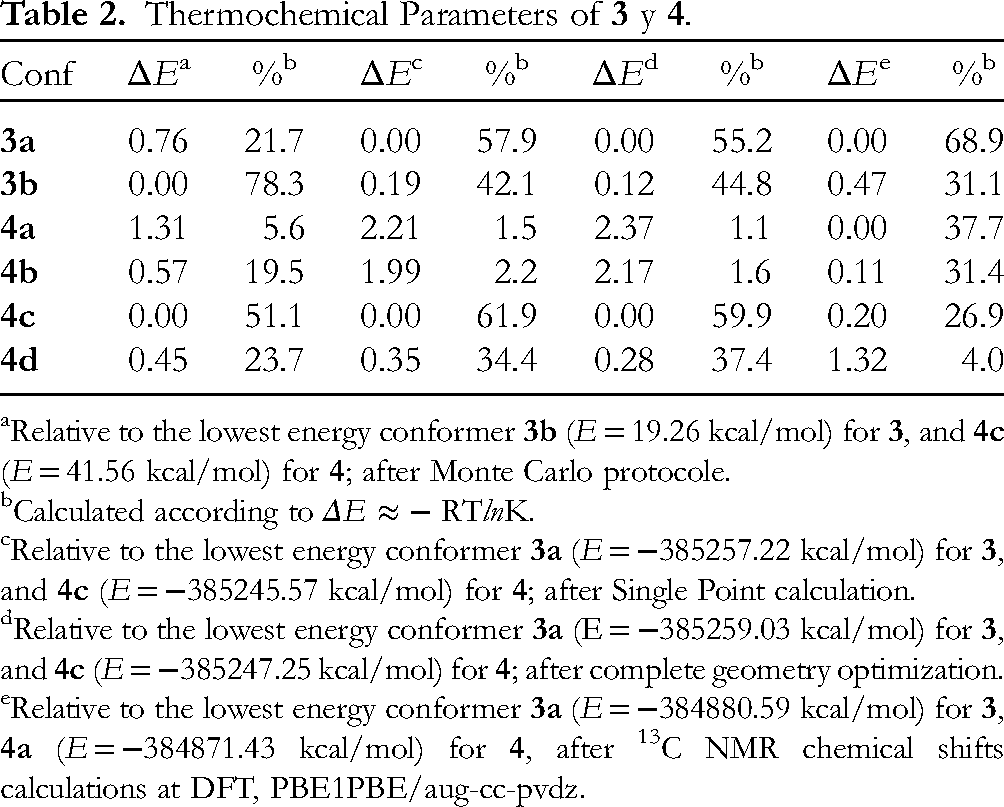
Thermochemical Parameters of 3 y 4.
Conf
ΔEa
%b
ΔEc
%b
ΔEd
%b
ΔEe
%b
3a
0.76
21.7
0.00
57.9
0.00
55.2
0.00
68.9
3b
0.00
78.3
0.19
42.1
0.12
44.8
0.47
31.1
4a
1.31
5.6
2.21
1.5
2.37
1.1
0.00
37.7
4b
0.57
19.5
1.99
2.2
2.17
1.6
0.11
31.4
4c
0.00
51.1
0.00
61.9
0.00
59.9
0.20
26.9
4d
0.45
23.7
0.35
34.4
0.28
37.4
1.32
4.0
Relative to the lowest energy conformer 3b (E = 19.26 kcal/mol) for 3, and 4c (E = 41.56 kcal/mol) for 4; after Monte Carlo protocole.
Calculated according to ΔE ≈ − RTlnK.
Relative to the lowest energy conformer 3a (E = −385257.22 kcal/mol) for 3, and 4c (E = −385245.57 kcal/mol) for 4; after Single Point calculation.
Relative to the lowest energy conformer 3a (E = −385259.03 kcal/mol) for 3, and 4c (E = −385247.25 kcal/mol) for 4; after complete geometry optimization.
Relative to the lowest energy conformer 3a (E = −384880.59 kcal/mol) for 3, 4a (E = −384871.43 kcal/mol) for 4, after 13C NMR chemical shifts calculations at DFT, PBE1PBE/aug-cc-pvdz.
Experimental (1, 2 and 3) and DFT PBE1PBE/aug-cc-pvdz(3 and 4)13C-NMR Chemical Shiftscalculated for the Quinone Ring.
Exp
Calc
C
1
2a
3
3
4
1
187.5
184.3
187.5
189.3
181.7
2
124.6
187.4
125.5
124.3
176.7
3
151.1
124.6
150.8
151.9
122.3
4
184.5
151.0
184.5
188.1
162.4
5
140.7
135.8
140.5
142.0
136.1
6
136.0
140.5
135.8
137.2
141.0
From reference 5.
Addition of o-phenylendiamine to p-quinones to afford the corresponding phenazines has been described.20
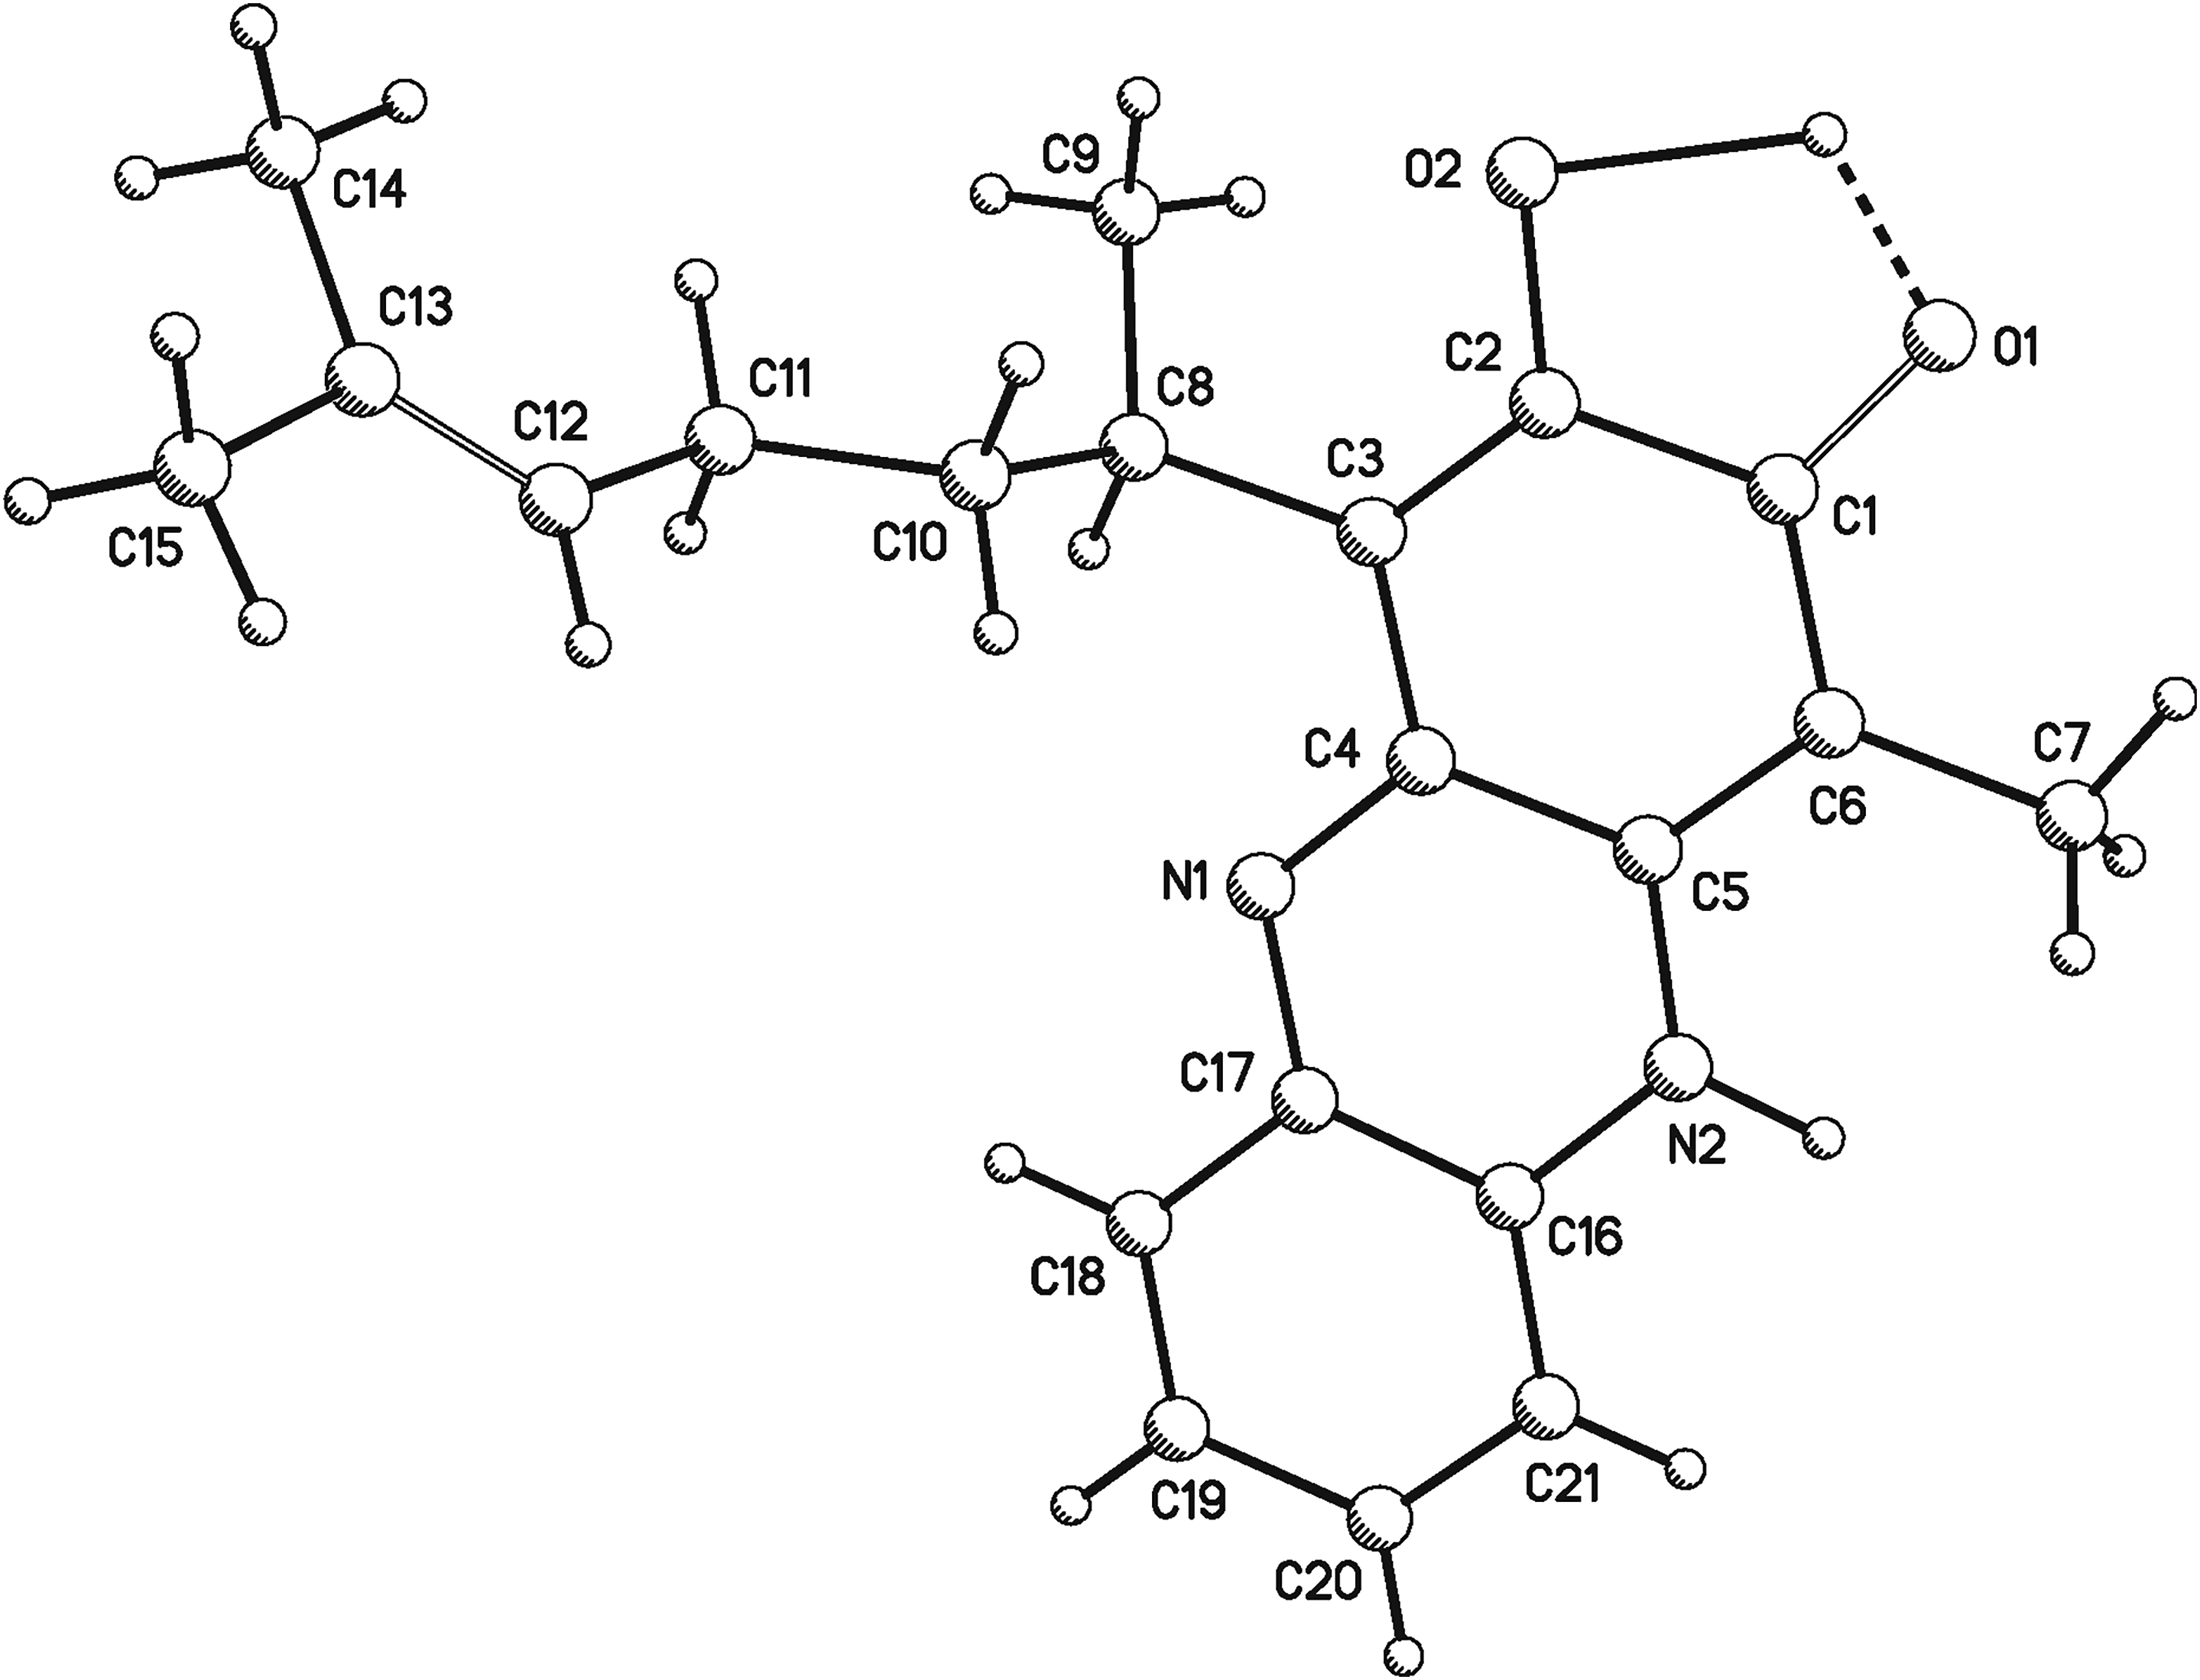
Perezone (1) and o-phenylenediamine reactions afford 6 (Figure 1) as a dark red solid, whose HRMSEI showed a molecular ion at m/z 336.1837 (calc. for C21H24N2O2+ 336.1832), which was poorly soluble in most common deuterated solvents. Fortunately, recrystallization from hot MeOH generated crystals suitable for X-ray diffraction study (Figure 3). These crystallized as a P21 monoclinic system. The non-hydrogen atoms were treated anisotropically, while the hydrogen atoms used for the calculation of the structural factor were treated isotropically. The final R indices were RI = 4.9% and R2 = 10.9%. The Flack parameter21 was x = 0.0(5) and x = 1(5) for the R and S enantiomer, respectively.
PLUTO X-ray structure plot of 6.
Crystallographic data (excluding structure factors) was deposited at the Cambridge Crystallographic Data Centre, under deposit number 2365210. Copies of the data can be obtained from the CCDC, 12 Union Road, Cambridge CB2 IEZ, UK. Fax: +44 (0) 1223 336033 or e-mail: deposit@ccdc.cam.ac.ik.
As evident, keto-amine and enol-imine tautomerism in 6 is possible. Again, using structures 7 and 8 as models, the free energy was calculated. After the conformational search, complete optimization of the energy and frequencies calculation to extract the Gibbs free energy (Table 4), two and four conformers were observed for the keto-amine and enol-imine forms (Figure 4), respectively. An energy difference of 3.15 kcal/mol was observed in favor to the keto-amine form (7), according to the observed X-ray diffraction structure (Figure 3).
The most stable DFT B3LYP/DGDZVP conformers of 7 and 8.
Thermochemical Parameters of 7 and 8.
Conf
ΔEMMFFa
%b
ΔE6−31G(d)c
%b
ΔEDGDZVPd
%b
ΔGDGDZVPe
%f
7a
0.56
28.1
0.00
67.7
0.00
74.4
0.00
75.1
7b
0.00
71.9
0.44
32.3
0.63
25.6
0.65
24.8
8a
1.17
6.1
0.90
12.7
0.41
22.9
0.00
55.3
8b
0.00
43.7
0.00
57.7
0.00
45.6
0.44
26.1
8c
0.00
43.6
0.44
27.5
0.45
21.2
0.91
11.8
8d
1.14
6.4
1.99
2.0
0.88
10.2
1.24
6.80
Relative to the lowest energy conformer 7b (E = 77.04 kcal/mol) for 7, and 8b (E = 92.06 kcal/mol) for 8; after Monte Carlo protocole.
Calculated according to ΔE = − RTlnK.
Relative to the lowest energy conformer 7a (E = −551770.01 kcal/mol) for 7, and 8b (E = −551766.55 kcal/mol) for 8; after Single Point calculations.
Relative to the lowest energy conformer 7a (E = −551832.22 kcal/mol) for 7, and 8b (E = −551828.41 kcal/mol) for 8; after complete geometry optimization.
Relative to the lowest energy conformer 7a (E = −551677.58 kcal/mol) for 7, and 8a (E = −551674.43 kcal/mol) for 8; after frequency calculations.
Calculated according to ΔG = − RTlnK.
Keto-amine and enol-imine tautomerism was evidenced by reaction of 6 with acetic anhydride in pyridine. After the reaction work up the diacetyl derivative 9 (Figure 1) was extracted as a white amorphous solid. The IR spectra for 9 shown a signal at 1773cm−1 and the 1H-NMR spectra shown two additional methyl signals at 2.412 and 2.408 ppm, while in the 13C-NMR two signals at 168.2 y 167.4 ppm were observed, all corresponding for the acetate carbonyl groups. NMR data assignment shown in Experimental Part was made with the aid of 1D- and 2D-NMR experiments, including one bond and long-range correlations, 1H/13C.
Discussion
Any calculation of a spectroscopic property of a molecule involving sigma bonds must begin with a rigorous conformational analysis, followed by the calculation of the physical property for the selected conformers, weighting the results according to their conformational population contribution and, finally, comparison between calculated and experimental data. Twelve years ago,22 we reported that perezone (1), at the DFT B3LYP/DGDZVP calculation level, shows 25 conformers representing 99.2% of their conformational population. Considering that different side chain conformations basically do not contribute to the 13C-NMR chemical shift of the quinone ring and, the great computational cost that this represents, it was decided to use 3-hydroxythymoquinone (3) and 4-hydroxy-3-isopropyl-6-methyl-1,2-benzoquinone (4) as truncated models for 13C-NMR data calculations of 1 and 2 quinone ring, respectively. However, the most important limitation of this work corresponds to the impossibility of having an authentic sample of the described rigidone (2), which would allow physical and spectroscopic evaluations of mixtures with perezone (1) to be carried out.
After complete geometry optimization, the conformational difference for the two most stable conformers of 3 was generated by rotation of the isopropyl group, while for 4, two additional conformations were observed from the hydroxy group rotation.
The 13C-NMR chemical shift data weighted according to the conformational population distribution, at first glance, appear to be in better agreement with the perezone (1) experimental data. To obtain numerical data for the comparison, coefficient of determination value (R2) was obtained, which, regardless of the basis set used, was better for 1. As can be seen from Table 3, the experimental quinone ring 13C-NMR data of perezone (1) and of 3-hydroxythymoquinone (3) are indeed similar, further validating the truncated models used.
Addition of o-phenylendiamine to p-quinones to afford the corresponding phenazines has been described,20 which presumably occurs through an 1,4-conjugated addition, followed by tautomerization and oxidation to regenerate the quinone ring, and the imine formation by attacking of the near carbonyl group. Perezone (1) and o-phenylenediamine reactions afford 6 (Figure 1) as a dark red solid, which was poorly soluble in most common deuterated solvents and some 13C-NMR signals were observed extraordinarily broad, presumably caused by the quadrupole electrical moment of the nitrogen atoms and by the tautomeric equilibrium. Fortunately, recrystallization from hot MeOH generated crystals suitable for X-ray diffraction study (Figure 3), whose Flack parameter was 0(5). This parameter is used to estimate the absolute configuration of a structure determined by X-ray diffraction,21 which is located between 0 and 1, where a value close to zero, with a small uncertainty, correspond to the correct configuration. As expected for perezone phenazine (6), the Flack parameter was close to 0.
Conclusions
The remarkable similarity between the 13C-NMR experimental data for the perezone (1) and the rigidone (2), the ΔEDFT B3LYP/DGDZVP = 14.1 kcal/mol between a p-quinone and an o-quinone tautomerizable to p-quinone, together with a better match between calculated and experimental 13C-NMR data of the perezone and, the sign and value of the optical rotation, allow to conclude that the structure described for rigidone (2), really corresponds to the ent-perezone. Therefore, based on biogenetic considerations, it is suggested to review the absolute configuration described for perezone, its dimer, perezoperezone and curcuperezone isolated from the same coral P. rigida.
Footnotes
Acknowledgments
This work was supported by CONACYT (Grant A1-S-17910), and SIP-IPN (Grants 20221472, 20232017 and 20241896).
Declaration of Conflicting Interests
The authors declared no potential conflicts of interest with respect to the research, authorship, and/or publication of this article.
Ethical Approval
Ethical approval is not applicable for this article.
Funding
The authors disclosed receipt of the following financial support for the research: This work was supported by Consejo Nacional de Ciencia y Tecnología (Grant A1-S-17910), and SIP-IPN (Grants 20221472, 20232017 and 20241896).
ORCID iD
Pedro Joseph-Nathan
Eleuterio Burgueño-Tapia
Statement of Informed of Human and Animal Rights
This article does not contain any study with human or animal subjects.
Statement of Informed Consent
There are no human subjects in this article and informed consent is not applicable.
Trial Registration
Not applicable, because this article does not contain any clinical trials.
References
1.
Río de la LozaL, Discurso pronunciado por el Catedrático de Química Médica de la Escuela de Medicina (November 23th, 1852). In: NoriegaJM, Compiler, Escritos de Leopoldo Río de la Loza, Imprenta de Ignacio Escalante, México, 1911; 94-100.
2.
Joseph-NathanPSantillanRL. The chemistry of perezone and its consequences. In: Atta-ur-Rahman, ed. Studies in natural products chemistry. Vol. 5. Elsevier; 1989:763-813.
3.
Escobedo-GonzálezRMendozaPNicolás-VázquezMIHernández-RodríguezMMartínezJMiranda RuvalcabaR. A timeline of perezone, the first isolated secondary metabolite in the New World, covering the period from 1852 to 2020. Prog Chem Org Nat Prod.2021;116:67-133. Doi: https://doi.org/10.1007/978-3-030-80560-9_3
4.
MuñozMABurgueño-TapiaEJoseph-NathanP. Individual scale factor approach for the vibrational circular dichroism similarity-guided spectral and conformational analysis of perezone and dihydroperezone. Chirality. 2023;35(1):67-79. Doi: https://doi.org/10.1002/chir.23517
5.
FreyerAJPatilADKillmerLZuberGMyersCJohnsonRK. Rigidone, a sesquiterpene o-quinone from the gorgonian Pseudopterogorgia rigida. J Nat Prod.1997;60(3):309-311. Doi: https://doi.org/10.1021/np960653m
6.
NakahashiAYaguchiYMiuraNEmuraMMondeK. A vibrational circular dichroism approach to the determination of the absolute configurations of flavorous 5-substituted-2(5H)-furanones. J Nat Prod.2011;74(4):707-711. Doi:https://doi.org/10.1021/np1007763
7.
Buendía-TrujilloAITorres-ValenciaJMJoseph-NathanPBurgueño-TapiaE. The absolute configuration of angular 3'-acyloxypyranocoumarins by vibrational circular dichroism exciton chirality. Tetrahedron:Asymmetry. 2014;25:1418-1423. Doi: https://doi.org/10.1016/j.tetasy.2014.09.001
8.
GeorganteaPIoannouEVagiasCRoussisV. Perezoperezone and curcuperezone: bisabolane dimers from the soft coral Pseudopterogorgia rigida. Tetrahedron Lett.2013;54(50):6920-6922. Doi: https://doi.org/10.1016/j.tetlet.2013.10.041
9.
AbreuPAWilkeDVAraujoAJ,et al.Perezone, from the gorgonian Pseudopterogorgia rigida, induces oxidative stress in human leukemia cells. Revista Brasileira de Farmacognosia. 2015;25(6):634-640. Doi:https://doi.org/10.1016/j.bjp.2015.07.020
10.
Joseph-NathanPHernándezJDRománLUGarcíaEGMendozaVMendozaS. Cumarin and terpenoids from Perezia alamani var. oolepis. Phytochemistry. 1982;21(5):1129-1132. Doi:https://doi.org/10.1016/S0031-9422(00)82430-9
HollensteinRPhilipsbornW. 13C- And 1H-NMR. Spectra of ortho-benzoquinone. On the assignment problem in 13C spectra. Helv Chim Acta.1973;56(1):320-322. Doi: https://doi.org/10.1002/hlca.19730560123
EsquivelBBurgueño-TapiaEBustos-BritoCPérez-HernándezNQuijanoLJoseph-NathanP. Absolute configuration of the diterpenoids icetexone and conacytone from Salvia ballotaeflora. Chirality. 2018;30(2):177-188. Doi: https://doi.org/10.1002/chir.22781
15.
Burgueño-TapiaEDíaz-FernándezMJoseph-NathanP. Vibrational circular study of pipitzols and of their inverse epimer constituents α- and β-pipitzol. Nat Prod Commun.2022;17(9):1-8. Doi:https://doi.org/10.1177/1934578X221127970
16.
CiminoPGomez-PalomaLDucaDRiccioRBifulcoG. Comparison of different theory models and basis sets in the calculation of 13C NMR chemical shifts of natural products. Magn Reson Chem.2004;42(S1):S26-S33. Doi: 10.1002/mrc.1410
17.
SarottiAMPellegrinetSC. A multi-standard approach for GIAO 13C NMR calculations. J Org Chem.2009;74(19):7254-7260. Doi:https://doi.org/10.1021/jo901234h
18.
IronMA. Evaluation of the factors impacting the accuracy of 13C NMR chemical shift predictions using density functional theory-the advantage of long-range corrected functionals. J Chem Theory Comput.2017;13(11):5798-5819. Doi:https://doi.org/10.1021/acs.jctc.7b00772
19.
ToomsaluEBurkP. Critical test of some computational methods for prediction of NMR 1H and 13C chemical shifts. Journal of Molecular Modeleling. 2015;21(9):244. Doi: 10.1007/s00894-015-2787-x
20.
KourHPaulSSinghPPGuptaR. A mild and simple method for the synthesis of substituted phenazines. Synlett. 2014;25(4):495-500. Doi: 101055/s-0033-1340478
Burgueño-TapiaECerda-García-RojasCMJoseph-NathanP. Conformational analysis of perezone and dihydroperezone using vibrational circular dichroism. Phytochemistry. 2012;74:190-195. Doi: 10.1016/j.phytochem.2011.10.005