
Abstract
Introduction
Brassica spp. are classified in the Brassicaceae family, and most of them can generate phytochemicals, such as glucosinolates (GSLs) and phenolic compounds. 1 For this reason, these crops are considered agriculturally and economically important. They can be consumed as vegetables, condiments, or oilseeds. 2 B. rapa and its subspecies greatly enhance plant defense and human health. 3 According to epidemiological studies, Brassica vegetables are associated with a lower risk of developing diseases.4,5 There are many variations in B. rapa growth habits, leaf morphology, and the type of vegetable grown. This species has various uses, including as a vegetable and an oilseed.6,7 Compared to most Brassica species, B. rapa has a broad global distribution. 8 The B. rapa chemical structure and its contents determine the bioavailability and activity of dietary phytochemicals. GSLs and phenolic compounds have been the primary targets of previous B. rapa studies. For example, various B. rapa varieties were examined by Liu et al and Zou et al,9,10 for their GSL profiles. Additionally, Chihoub et al 11 have examined phenolic compounds in turnip, Bok choi,12,13 Chinese cabbage, 14 and mizuna, 15 and found that the significant phenolic compounds are hydroxycinnamic acids.
GSLs are primarily found in cruciferous plants, including the widely consumed Brassicaceae family.16,17 Recent research has demonstrated the positive impacts on GSLs, which have direct antibacterial capabilities, regulatory roles in inflammation, plant stress response, phase I metabolism, and antioxidant activities. 18
Among plant secondary metabolites, phenolic compounds are a large group of metabolites present in vegetables and other higher plant organs, 19 fruit,20,21 spices, 22 grains, 23 legumes, and nuts, 24 playing an essential role in plant quality, color, flavor, and stress tolerance. As part of the human diet, plant phenolics also play a crucial role due to their biological properties, which include antioxidant, 25 antimicrobial, 26 anti-inflammatory, 27 anticarcinogenic activities, 28 and diseases associated with oxidative stress. 29 It is recommended that humans consume plant-based foods high in phenolic compounds to improve their health. 30 Nonetheless, the variety of colors, flavors, and tastes in B. rapa suggests a much more complex metabolism, possibly including a whole new array of compounds and biochemical processes. Brassica crops are commonly used for various side dishes in many countries. To understand the metabolic characteristics, in the present study, we detected and quantified the GSLs and phenolic compound content across the sprouts of 7 B. rapa subspecies for the comparative analysis of these 2 phytochemical profiles. Furthermore, GSLs and phenolic compound profiling in these B. rapa subspecies will improve our understanding of the distribution pattern of GSLs and phenolics in whole plant tissues. We found variations in the composition and the total concentration of GSLs and phenolic compounds on these B. rapa subspecies.
Results
Phenotype of B. rapa Subspecies Sprouts
After 10 days, the 7 B. rapa plants were harvested, and shoot, root length (RL), and fresh weight (FW) were measured. For shoot length (SL), a high value was found in turnip rape, and a low value was observed in Chinese cabbage. A similar trend was achieved for RL. However, Bok choy showed the highest value for FW, whereas the lowest value was found in choy sum (Table 1). A difference in plant development among the subspecies was observed, and it was clear that the Chinese cabbage presented the worst phenotypic characteristics than the others, namely leaf development and plant height (Figure 1).
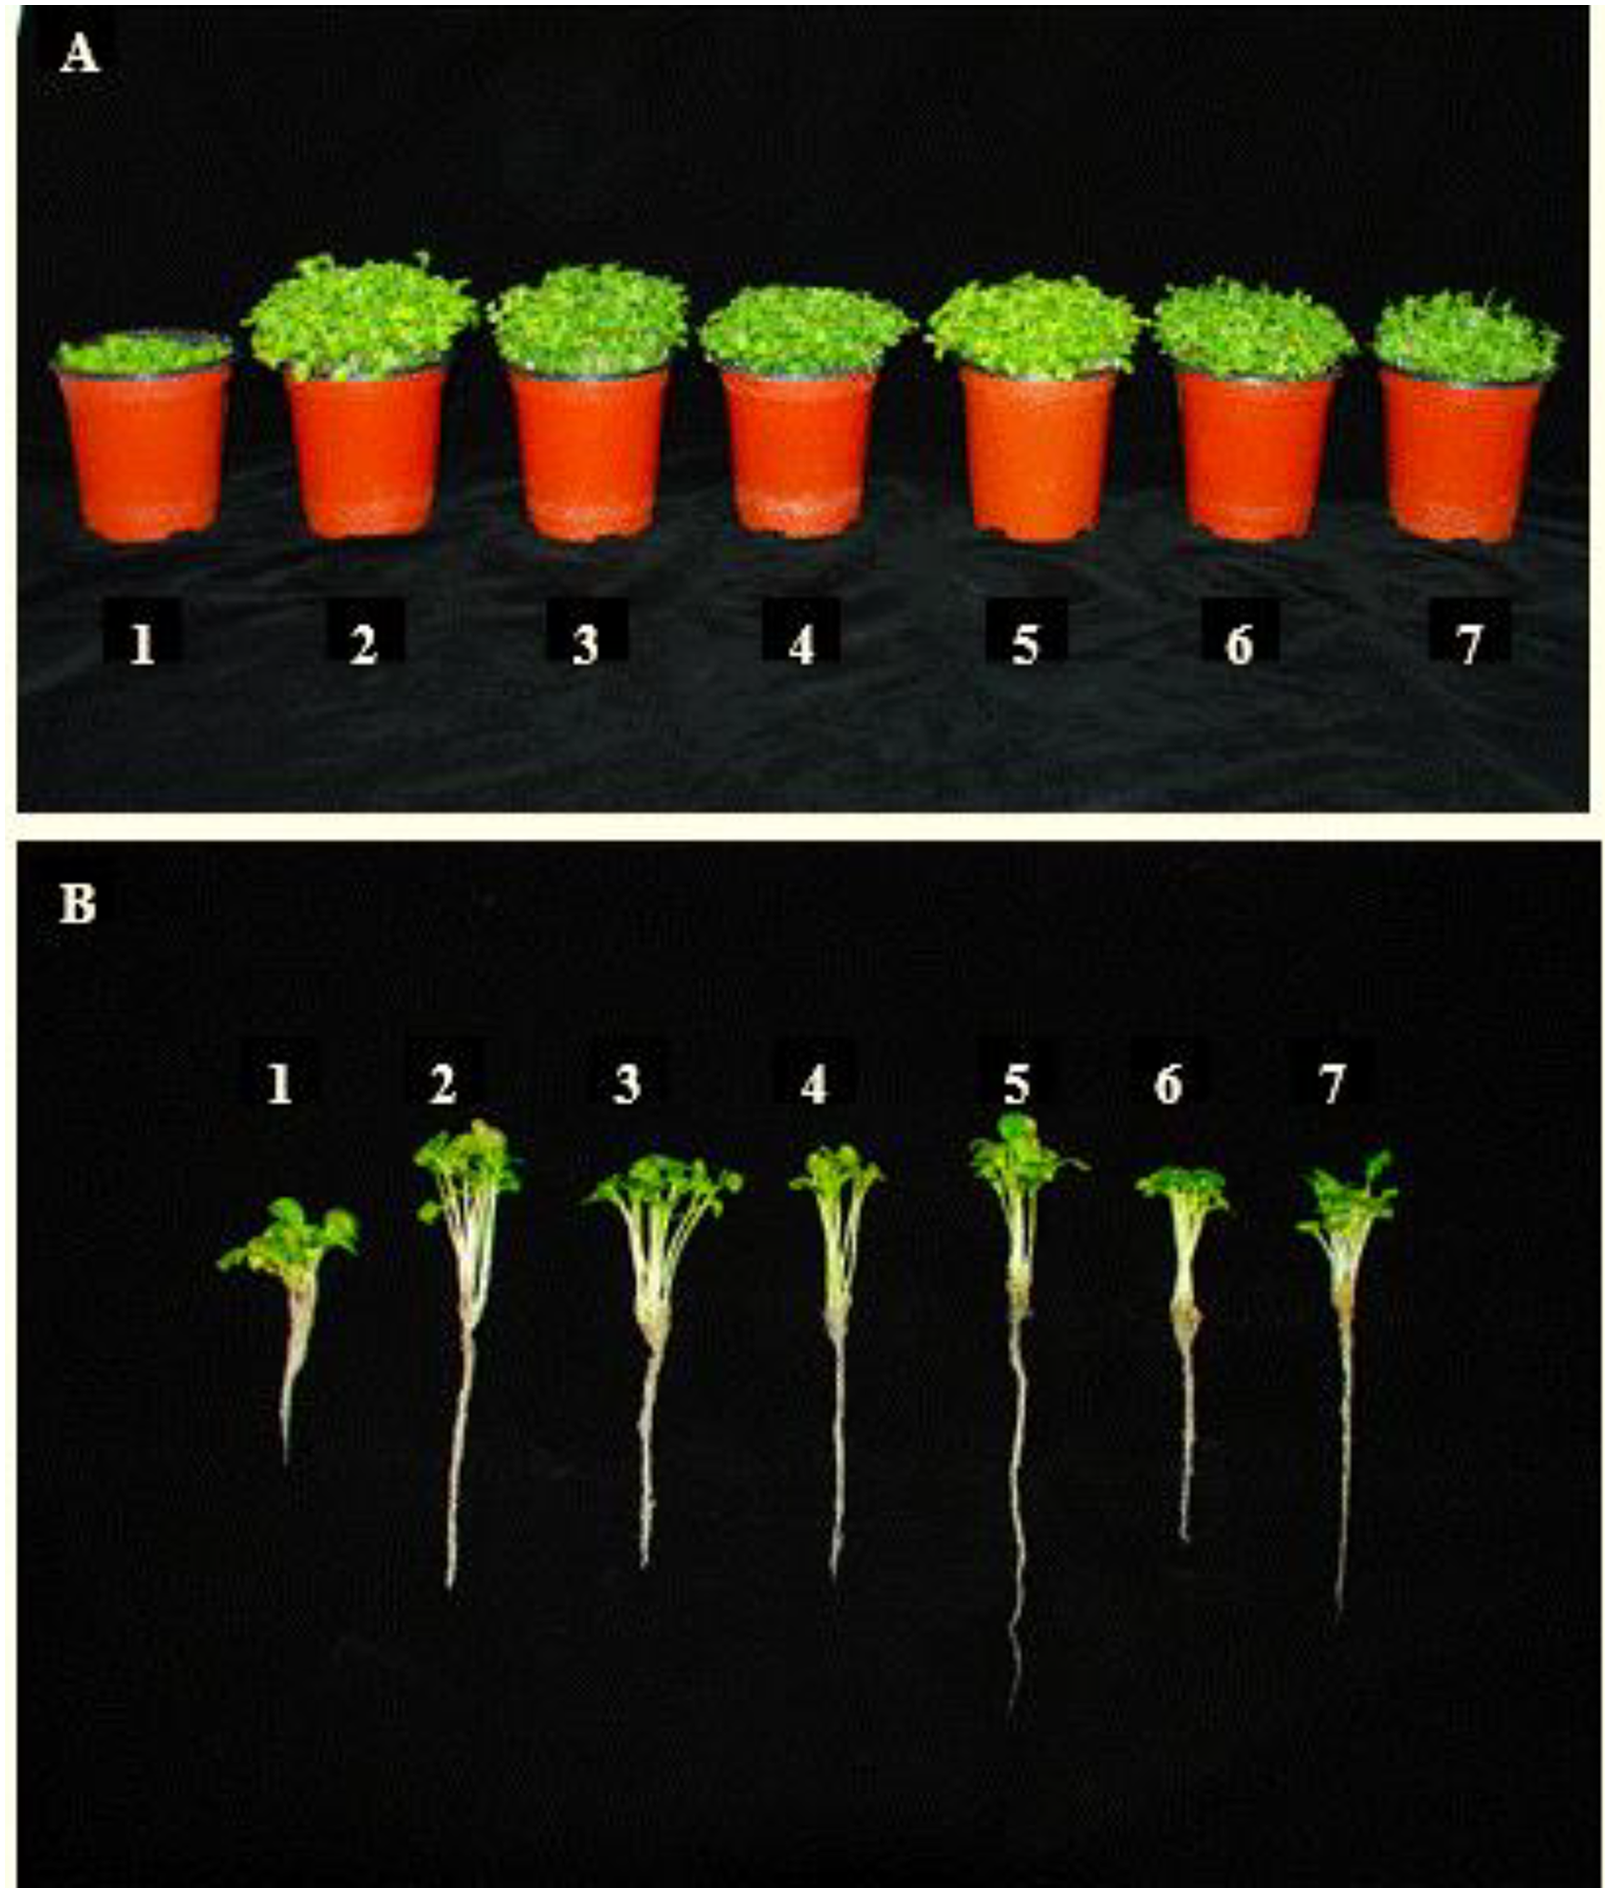
The phenotype of the 7 Brassica subspecies observed 10 DAS in grown pots (A), and after washed and cleaned (B).
Shoot Length, Root Length, and Fresh Weight of 7 Brassica rapa Subspecies Sprout Determined 10 DAS in a Growth Chamber.

Different letters in the row indicate a statistically significant difference between the means when Duncan's multiple range test is used (P < .05).
GSL Content in B. rapa Sprouts
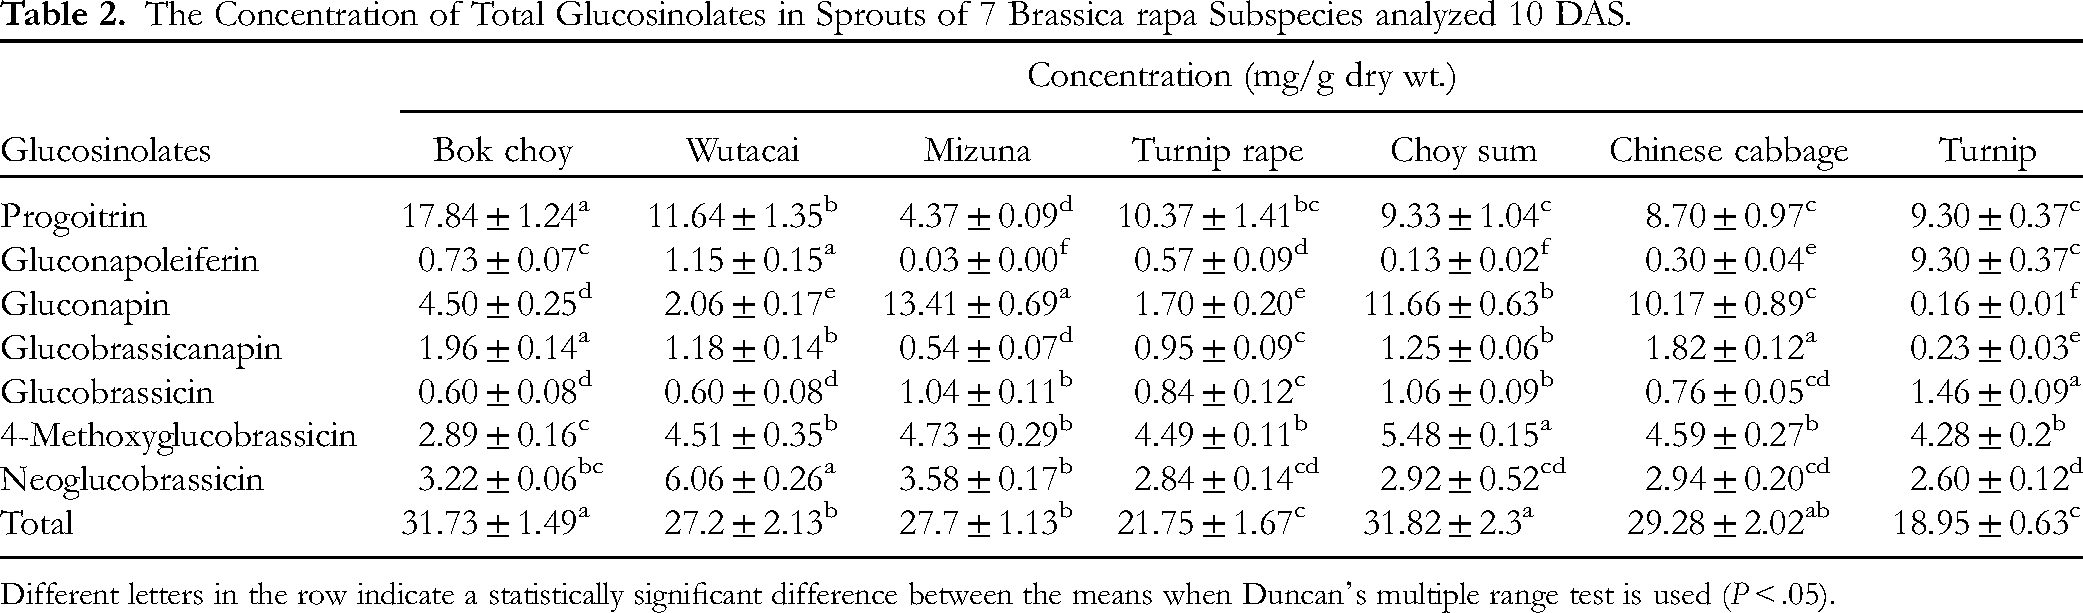
high-performance liquid chromatography (HPLC) analysis identified 7 GSLs, namely 4 aliphatic and 3 indolic GSLs, from all 7 B. rapa subspecies. The concentrations of total GSLs in all 7 B. rapa showed a statistical difference (Table 2). For glucobrassicanapin content, HPLC analysis found that a high content was achieved in Bok choy, whereas a low concentration was observed in turnip (1.96 ± 0.14 and 0.23 ± 0.03 mg/g DW, respectively). For progoitrin content, the highest and lowest concentrations were found in Bok choy (17.84 ± 1.24 mg/g DW) and mizuna (4.37 ± 0.09 mg/g DW), respectively. High concentrations of gluconapoleiferin were observed in wutacai sprouts (1.15 ± 0.15 mg/g DW), and the lowest concentrations were observed in mizuna sprouts (0.03 ± 0.00 mg/g DW). For gluconapin, HPLC analysis showed that the highest values were found in mizuna (13.41 ± 0.69 mg/g DW), and the lowest values were observed in turnip (0.16 ± 0.01 mg/g DW). Glucobrassicin concentrations were high in turnip sprouts (1.46 ± 0.09 mg/g DW), and a low concentration was observed in Chinese cabbage sprouts (0.76 ± 0.05 mg/g DW). The highest 4-methoxyglucobrassicin content was achieved in the choy sum sprouts (5.48 ± 0.15 mg/g DW), whereas the lowest content was observed in Bok choy sprouts (2.89 ± 0.16 mg/g DW). The neoglucobrassicin content was highest in wutacai (6.06 ± 0.26 mg/g DW) and lowest in turnip (2.60 ± 0.12 mg/g DW).
The Concentration of Total Glucosinolates in Sprouts of 7 Brassica rapa Subspecies analyzed 10 DAS.
Different letters in the row indicate a statistically significant difference between the means when Duncan's multiple range test is used (P < .05).
Phenolic Compounds in B. rapa Subspecies
Concerning the phenolic compound concentration, 13 phenolic compounds, namely 5 hydroxycinnamic acids, 3 hydroxybenzoic acids, 3 flavonols, and 2 flavan-3-ol, were identified by HPLC analysis of the sprouts of all 7 B. rapa subspecies. The phytochemical composition of phenolic compounds can vary considerably from species to species and even from one crop to another. The total concentrations of phenolic compounds of the 7 B. rapa subspecies were submitted to ANOVA, and the statistical analysis of concentrations of the 13 detected compounds showed a significant difference (Table 3). The individual phenolic compound with the highest concentration in all 7 B. rapa subspecies was benzoic acid, followed by rutin, and the phenolic compounds gallic acid and trans-cinnamic acid showed the lowest concentrations. For the benzoic acid concentration, mizuna sprouts (0.96 ± 0.01 mg/g DW) showed the highest content of all analyzed subspecies. HPLC analysis found the same content (0.02 ± 0.00 mg/g DW) for all 7 B. rapa subspecies for the trans-cinnamic acid content. The same results were found for gallic acid content, except in mizuna and Chinese cabbage sprouts (0.01 ± 0.00 mg/g DW). It appears that benzoic acid regulates growth and stress by regulating metabolism. Rutin is a flavonoid glycoside found in many vegetables, while gallic acid and trans-cinnamic are more present in other plant species than vegetables. Among all 7 B. rapa subspecies, the highest concentration of total phenolic compounds was found in Chinese cabbage sprouts (2.7 ± 0.05 mg/g DW), and a low concentration was found in Choy sum sprouts (2.17 ± 0.05 mg/g DW).
The Concentration of Total Phenolic Compounds in Sprouts of 7 Brassica rapa Subspecies analyzed 10 DAS.

Different letters in the row indicate a statistically significant difference between the means when Duncan's multiple range test is used (P < .05).
Discussion
Brassicas have a great diversity of biotic and abiotic stress adaptations because of their immense genetic and morphological diversity. 31 Brassica genera have a wide variety of morphological characteristics that can be used to study domestication and artificial selection.32–35 The morphological characteristics of the 7 subspecies of B. rapa in the present study indicate variations. These findings align with those made by Pino del Carpio et al and Tanhuanpää et al,36,37 who discovered that B. rapa has divergent morphologic, genetic, and geographic patterns. However, some studies have shown that geographically distant crops have close morphological similarities.
A plant species contains an average of 4 distinct GSLs. 38 These results agree with the findings in the present study, where 4 GSLs (progoitrin, gluconapin, 4-methoxyglucobrassicin, and neoglucobrassicin) were found in higher amounts. Among the 7 GSLs determined through HPLC analysis, the highest concentrations were achieved for progoitrin, followed by gluconapin. The Brassica subspecies with the highest total concentrations of GSLs were Bok choy and Choy sum sprouts. Our results differ from those by Bhandari et al, 39 who compared 12 GSL profiles and concentrations in 9-day-old Brassica sprouts, including 2 B. rapa subspecies. Gluconapin, glucobrassicin, and gluconasturtiin were the most common GSL in all examined crops. Previous studies reported that the significant GLSs found in turnip were progoitrin and gluconapin, whereas, in Chinese cabbage, gluconapoleiferin and gluconapin were the major GSLs. 40 Likewise, according to Yang et al, 41 compared with other B. rapa subspecies, turnip contains more aliphatic GSLs. In addition, Yang and Quiros 42 reported that turnip had a higher GSL content than Bok choy, Chinese cabbage, and rapeseed. These results differ from those found in the present study, where higher concentrations of progoitrin were found in Bok choy, followed by wutacai.
The phenolic compounds and GSLs in Brassicas are also major bioactive components strongly associated with vegetables’ taste, color, and species characteristics. 43 A study identified 74 phenolic compounds in 12 Brassica vegetables and found that quercetin, kaempferol, and isorhamnetin were the main flavonoids. In contrast, the primary hydroxycinnamic acids were ferulic, sinapic, caffeic, and p-coumaric acids. 44 According to Miean and Mohamed, 45 myricetin, quercetin, and kaempferol are significant flavonoids in the Brassicaceae family. In the present study, among the 13 phenolic compounds identified in the HPLC analysis, the highest total concentrations were found in benzoic acid (a hydroxybenzoic acid), followed by rutin (a flavonol glycoside). These results do not agree with the findings of Kyriacou et al, Soengas et al, and Dejanovic et al,15,46,47 who showed that Chinese cabbage, Bok choy, turnips, and mizuna presented high amounts of kaempferol derivatives. There is also a discrepancy between the current findings and previous studies on Brassica microgreens, in which quercetin and kaempferol are the main flavonols, 48 and the primary hydroxycinnamic acids include caffeic and ferulic acids. 49 In another study, 3 with 14 main B. rapa groups for metabolite profiling analysis found a higher concentration of kaempferol, followed by quercetin and isorhamnetin. For example, a study conducted by Romani et al 50 revealed that turnip top contains a high amount of isorhamnetin, kaempferol, and quercetin. In a study with hairy roots of turnips, Chung et al 51 found higher levels of gentisic acid, ferulic acid, and catechin. These results do not agree with those found in the current research, which showed high levels of benzoic acid, followed by rutin and epicatechin. In a study done by Jeon et al, 12 the amount of rutin in purple Bok choy was much higher than that of the other compounds. Our findings show that among the 3 flavonols identified in HPLC analysis, the highest concentrations of rutin, followed by kaempferol and quercetin, were observed.
Limitations of the Study
The results of this study deliver helpful information on the phytochemical composition of B. rapa subspecies. Still, it is essential to recognize that some limitations must be considered when interpreting the results of this study. The study was limited to evaluating the content of phenolic compounds and GSLs. The other classes of phytochemicals that were not analyzed are not within the scope of this research. Further studies should address other phytochemical classes. Other chromatography techniques, such as gas chromatography–time-of-flight mass spectrometry, could also be performed to find specific phytochemicals. The second limitation concerns the exclusive identification of free forms of polyphenols that the current study addressed and the lack of a comprehensive method for GSL analysis, such as chromatography (gas chromatography), liquid chromatography combined with mass spectrometry, or another method capable of detecting more GSLs. This limitation was due to the absence of this type of instrument in the laboratory. The third limitation concerns the harvesting period; 10 days after sowing (DAS) may not reflect the full range of variations in B. rapa phenolic and GSLs compounds. The phytochemicals detected during this period offer an idea, but more time variation sampling could provide a complete understanding of the plant's phytochemical composition. Finally, the limited availability of articles that only compare phenolic compounds and GSLs within cultivars of B. rapa also impacted the discussion section of this article. Studies such as the one presented here will partly overcome this limitation.
Conclusion
In conclusion, the current findings illustrate the accumulation patterns of individual GSLs and phenolic compounds in 7 subspecies of B. rapa sprouts. Our findings show that plants belonging to the same species can vary the content of phytochemical compounds such as GSLs and phenolic acids, and also show that the phenotypic shape in B. rapa subspecies after 10 DAS is not directly proportional to the total content of GSLs and phenolic acids. Using HPLC analysis, a total of 20 metabolites were successfully identified. The main GSLs identified were progoitrin, Gluconapin, and 4-Methoxyglucobrassicin, and the main flavonol identified was rutin. The main flavanol detected was epicatechin; the primary phenolic acid was p-coumaric acid. Bok choy and Choy sum sprouts presented a high content of total GSLs, and Chinese cabbage and turnip presented a better content of total phenolic compounds detected among the subspecies. The results of the present study showed those distinctive metabolic signatures entrenched in these Brassica subspecies. They will be helpful for future studies and for choosing the best subspecies to use as sprouts containing functional compounds among B. rapa.
More studies on bioavailability, metabolism, dietary intake, effective dosages, and dietary guidelines are necessary to improve health and nutrition. Researchers are also encouraged to examine the nutritional and phytochemical composition of sprouts of other brassicas subspecies. Furthermore, there are still gaps in knowledge regarding metabolic profiling, antioxidant activity, anthocyanin, carotenoid, chlorophyll, protein, vitamin, and mineral categories.
Materials and Methods
Plant Material
The seeds of the 7 B. rapa subspecies were obtained from Asia Seed Co, South Korea (Table 4). A total of 100 seeds were counted and immersed in distilled water overnight. These seeds were then transferred into the pots filled with vermiculite. The experiment was arranged in a completely randomized design with 3 replications for each subspecies. The seedlings were germinated and grown under controlled conditions of a temperature between 24.8 °C and 26.8 °C, a photoperiod of 16/8 h, a fluorescent light photon flux of 700 lux, and 60% to 70% humidity in an LED plant growing chamber (Sejong Scientific Co., Sejong, South Korea). The sprouts from each subspecies were harvested 10 DAS. After being harvested, the sprouts were washed and cleaned with distilled water. For growth measurements, 10 plants from each subspecies were selected randomly, and growth measurements were taken. The SL and RL were measured in cm using a meter ruler. To determine the FW, the Brassica subspecies were weighed in mg using a balance. The non-selected sprouts were ground into a powder by using a motor and pestle with liquid nitrogen and then freeze-dried using a freeze-dryer machine (HyperCOOL, Gyrozen Co. LTD, Gyeonggi-do, Korea). After 72 h in a dryer machine at −40 °C, the dehydrated powder sprout samples were used to analyze for GSLs and phenolic acid content (Figure 2).

A roadmap for the detection and quantification of phenolic compounds and glucosinolates.
List of B. rapa Subspecies Used in the Study.

GSL Extraction and HPLC Analysis
With some modifications, GSLs were extracted using previously reported procedures. 52 Briefly, 100 mg of a freeze-dried powdered sample was collected in a 2 mL Eppendorf tube, and 1.5 mL of methanol was added. For 5 min, the tubes were placed in a water bath at 70 °C. In a new 5 mL Eppendorf tube, supernatants were collected after centrifugation at 12 000 rpm for 10 min at 4 °C. Using the combined supernatants from the 2 extractions described above, crude GSL extracts were prepared from the residues. A Mini column filled with DEAE-Sephadex A-25 (Sigma-Aldrich, St. Louis, MO, USA) was used to load the extracts, and 75 μL of aryl sulfatase solution was used to desulfate them. With 0.5 mL of ultrapure water, the desulfated (DS) GSLs were eluted into 2 mL microcentrifuge tubes. A 1200 series HPLC system attached with a photodiode array detector (Agilent Technologies 1200 series, Seoul, South Korea) was used to analyze DS-GSLs. The mobile phase compositions were used as follows: 0 min (B) 0%, kept constant at (B) 0% by 2 min, continually raised (B) 10% until 7 min, progressively improved (B) 31% by 16 min, maintained steady at (B) 31% by 19 min, further (B) 0% by 21 min, and then kept constant at (B) 0% for 6 min (total 27 min). A desulpho-sinigrin (Sigma-Aldrich Co., Ltd, St. Louis, MO, USA) was used as a standard to identify and quantify GSLs by high HPLC peak area ratios, retention times, and response factors. The results were carried out in triplicate and expressed as milligrams per gram of dry weight (mg/g DW).
Determination of Phenolic Compounds
A method previously described by Lee et al 52 was used to analyze phenolic compounds. A volume of 1.5 mL of aqueous methanol was added to 100 mg of dried sprout powder samples. At 25 °C, the mixture was sonicated for 1 h. In a fresh tube, the supernatant was transferred after centrifuging the crude extract for 10 min at 10 000 rpm. Two more extractions were performed to remove the remaining sludge. A 0.45 μm PTFE syringe filter was used to filter the collected supernatant after centrifugation for 15 min at 10 000 rpm. Based on a previous study performed by Lee et al, 52 the HPLC analysis conditions, system, and gradient program were used. We used the HPLC (NS-4000, Futecs, South Korea) and RP-HPLC columns (OptimaPak C18, 250 × 4.6 mm, 5 μm, RS Tech, Daejeon, South Korea) with a UV-vis detector and autosampler. Solvent A: 0.2% (v/v) acetic acid, and Solvent B: pure methanol was used for the gradient program of the mobile phase. Following this condition, solvent B started at 5%, followed a linear gradient to 45% for 55 min, held for 10 min, and then slowly decreased to 5% for about 30 min. Injection volume and column oven were 0.1 mL and 30 °C, respectively, and compounds were chromatographically detected at 280 nm. Individual phenolics were identified by comparing retention times using the spike test, and compounds in the sample extracts were quantified using a calibration curve. The pure standard solutions of gallic acid, 4-hydroxybenzoic acid, catechin hydrate, chlorogenic acid, caffeic acid, epicatechin, p-coumaric acid, ferulic acid, benzoic acid, rutin, trans-cinnamic acid, quercetin, kaempferol (Sigma-Aldrich, St. Louis, MO, USA) were dissolved in methanol and analyzed the samples. The results were carried out in triplicate and expressed as milligrams per gram of dry weight (mg/g DW).
Statistical Analyses
With statistical analysis software (SAS) at P ≤ .05, the mean values of 3 biological replicates and their respective standard deviations for the identified GSLs and phenolic compounds were determined, and Duncan's multiple range test was used to assess cultivar differences using the results of ANOVA.
Footnotes
Author Contributions
JSP and SUP designed the experiments and analyzed the data. LTDCB, BVN, CP, RS, and GB performed the experiments and analyzed the data. LTDCB wrote the original draft of the manuscript. LTDCB and RS review and edit the manuscript. All authors have read and agreed to the published version of the manuscript.
Declaration of Conflicting Interests
The authors declared no potential conflicts of interest with respect to the research, authorship, and/or publication of this article.
Funding
The authors disclosed receipt of the following financial support for the research, authorship, and/or publication of this article: This work was supported by Ministry of Agriculture, Food and Rural Affairs of Republic of Korea (322077-3, Development of water supply technology and foundation for universal use of paddy fields according to changes in agricultural environment).
Statement of Human and Animal Rights
No human participants were included in this study, and informed consent was not required.
Statement of Informed Consent
No human subjects are in this article, and informed consent is not required.