
Abstract
Keywords
Introduction
Diabetes mellitus (DM) is a universal endocrine and metabolic disorder.1,2 Type 2 diabetes mellitus (T2DM) and metabolic syndrome make a great contribution to the increased morbidity and mortality globally, which are the result of insulin resistance (IR) as a central element.3,4 IR will occur when insulin-sensitive tissues like the liver, skeletal muscle, and adipose tissue go through reduced sensitivity to insulin caused by the disruption of the insulin pathway. 5 Metabolism-related symptoms such as hyperglycemia, hyperinsulinemia, and hyperlipidemia can caused by IR. 5
The liver is the first organ to be affected by IR in patients with IR. Hepatic IR induces T2DM, leading to metabolic abnormalities. 6 The main feature of IR is that insulin-mediated promotion of hepatic glycogen synthesis and inhibition of gluconeogenesis is reduced, resulting in increased glucose synthesis and reduced consumption, ultimately leading to the development of hyperglycemia-induced T2DM. 7 Hepatic IR induces impaired insulin secretion and successive deficiency of β-cell loss, which accumulates the progress of T2DM. 8 Insulin signaling in the liver plays a critical role in the regulation of glucose homeostasis in- and out of the liver. 9 Insulin signaling is coordinated with counterregulatory signaling through tyrosine phosphorylation of insulin receptor substrates (IRS). 10 Insulin signaling is activated by IRSs 1 and 2 (IRS1 and IRS2) as mediators and liver-specific IRS1- or IRS2-knockout mice could induce IR directly.9,11 Reports have suggested that 2 major pathways have participated in the control of glucose metabolism: IRS1/phosphoinositide 3-kinase (PI3K)/protein kinase B (AKT), and AMP-activated protein kinase (AMPK). AMPK regulates metabolism (eg, cell growth and protein synthesis) based on nutrient availability through direct binding to adenine nucleotides or targeting transcriptional regulators.12,13 IRS1 is associated with the cue of IR in the liver. PI3K is activated after IRS1 phosphorylation to regulate the downstream factor AKT, which promotes glucose uptake. 14 Although there are many new antidiabetic drugs in the clinic and their therapeutic effect is very good, most of them also have many side effects. As the global incidence of diabetes continues to rise, new antidiabetic compounds must be explored. Nature has provided vital phytochemicals with potential therapeutic applications in various ailments.
Isobavachalcone (IBC) is a natural product flavonoid derived from the dried and mature seeds of the Psoralea corylifolia Linn,15,16 its structural formula is shown in Figure 1, Psoralea corylifolia Linn is a very important Chinese medicine with the effect of tonifying the kidneys and nourishing the yang. The use of IBC has been demonstrated to possess antibacterial, antifungal, anticancer, antitubercular, and antioxidant activities in various research models. 16 IBC potentially improves the inflammatory environment and age-related diseases.7,17 Studies have shown that IBC can inhibit lipid synthesis and deposition, 18 however, little research has been conducted on the link between IBC and diabetes. Therefore, more data are needed to further validate the role of IBC in the control of diabetes and its underlying mechanisms.

The chemical structure of Isobavachalcone (IBC), a natural compound.
Here, we constructed the T2DM mice model with a high-fat diet (HFD) combined with a low dose of streptozotocin (STZ). The effect of IBC on body weight, glucose tolerance, fasting blood glucose (FBG), and other indicators like total cholesterol (TC), triglyceride (TG), high-density lipoprotein (HDL-C), low-density lipoprotein (LDL-C), and related proteins in IRS1/PI3K/AKT pathway in the liver helped us to understand the effect of IBC on glucose and lipid metabolism in T2DM model as a treatment and its potential mechanism. We hope to provide some experiment basis on applying IBC to postpone hyperglycemia, hyperlipemia, and the onset of diabetes.
Results
Effect of HFD and STZ on all Experimental Animals
Compared with the control group, the mice in the HFD group had a significant increase in body weight (P < .001, Figure 2A). FBG levels in the HFD group showed an increasing trend compared with the control group (P < .001, Figure 2B). Both the oral glucose tolerance test (OGTT) and insulin tolerance test (ITT) were abnormal in the HFD group compared to the control group. The area under the curve (AUC) of OGTT and ITT of mice in the HFD group was greater than those in the control group (P < .01, Figure 2C to F). After the STZ injection, food lasted for one week, and the level of FBG was measured. Fasting blood glucose increased significantly in the HFD group after STZ injection (Figure 2G), and FBG doubled after 7 days compared to the control group (P < .001). Insulin level in serum was significantly higher in the HFD group than in the control group (P < .001, Figure 2H).

Effect of HFD and STZ on all experimental animals: (A) body weight, (B) FBG, (C) OGTT, (D) AUC of OGTT, (E) ITT, (F) the AUC of ITT, (G) fasting blood glucose 7 days after STZ injection in the tail vein, and (H) insulin content. *P < .05, **P < .01, ***P < .001, compared with the control group; control group (n = 6), HFD group (n = 28).
Effect of IBC on Body Weight, Fasting Blood Glucose, Serum Insulin, and Serum Glucagon in DM Mice
At week 10, the body weight of mice in the DM group decreased sharply by 40% after STZ injection (Figure 3A). No significant changes in the body weight of mice in other groups. Compared with the control group, the FBG level in the DM group was increased by 1.25 times (P < .001, Figure 3B). FBG levels in the IBC group and Metformin (Met) group were lower than those in the DM group (P < .001). Figure 3C shows that the level of insulin in the DM group mice was significantly higher than that of the control group (P < .05), and there was no significant difference between the IBC group and DM group than those of the control group. Figure 3D reveals that there was no significant decrease in the level of glucagon in each group. The change in the IR index in mice was consistent with the trend of insulin content in the serum (Figure 3E).

Effect of IBC on body weight, FBG, insulin, and glucagon levels in DM mice: (A) body weight, (B) FBG, (C) insulin content, (D) glucagon content, and (E) insulin resistance index. All data are expressed as the mean ± SD (n = 6 per group). *P < .05, ***P < .001, compared with the control group; ###P < .001, compared with the DM group.
Effect of IBC on Blood Lipid Metabolism Index in DM Mice
Compared with the control group, TG levels in the DM group were significantly higher (P < .001, Figure 4A). TG levels were significantly decreased in the Met group than those in the DM group (P < .001, Figure 4A). Compared with the DM group the level of TG in the IBC group was decreased by 70%. The level of TC in the DM group was higher than that in the control group. While compared with the DM group, the IBC group and the Met group were not significantly different (Figure 4B). In addition, there was no significant change in HDL-C levels between groups (Figure 4C), and the level of LDL-C between groups had no significant difference (P > .05) with a decreasing trend (Figure 4D).

Effect of IBC treatment on blood lipid levels in DM mice: (A) TG, (B) TC, (C) HDL-C, and (D) LDL-C. All data are expressed as the mean ± SD (n = 6 per group). *P < .05, **P < .01, ***P < .001, compared with the control group; ###P < .001, compared with the DM group.
Effect of IBC on mRNA Expression of Insulin Receptor (INS-R), Glucose Transport 2 (GLUT2), IRS1, AKT, and PI3K in DM Mice
Compared with the control group, the expression of GLUT2 in the DM group was significantly increased (P < .001, Figure 5A), and the INS-R was significantly different (P < .05) with an increasing trend (Figure 5B). The expression of GLUT2 and INS-R in the IBC group was lower than those in the DM group (P < .001, P < .01, respectively; Figure 5A and B). IRS1 in the DM group was significantly lower than that in the control group (P < .01, Figure 5C). Compared to the DM group, IBC treatment significantly upregulated the levels of IRS1 (P < .01, Figure 5C). There were no significant differences in AKT and PI3K in the DM group compared with the control group (Figure 5D and E). However, compared with the DM group, IBC treatment significantly upregulated the mRNA levels of AKT and PI3K (P < .01, P < .05, respectively, Figure 5D and E).

Effect of IBC treatment on INS-R, IRS1, GLUT2, AKT, and PI3K mRNA expression in DM mice: (A) expression of GLUT2 mRNA, (B) expression of INS-R mRNA, (C) expression of IRS1 mRNA, (D) expression of AKT mRNA, and (E) expression of PI3K mRNA. All data are expressed as the mean ± SD (n = 6 per group). *P < .05, **P < .01, ***P < .001, compared with the control group; #P < .05, ##P < .01, ###P < .001, compared with the DM group.
Effect of IBC on Protein Expression of INS-R, IRS1, GLUT2, p-AKT, AKT, p-PI3K, and PI3K in DM Mice
Compared with the control group, the expression of IRS1, p-AKT, and p-PI3K in the DM group was significantly decreased (P < .01, Figure 6A to C and E), and the level of GLUT2 in the DM group was significantly increased (P < .01, Figure 6D and E). Compared with the DM group, the expression of IRS1, p-AKT, and p-PI3K in the IBC group and Met group were significantly increased (P < .01, Figure 6A to C and E), and the level of GLUT2 in the IBC group and Met group were significantly decreased (P < .01, Figure 6D and E). Compared with the control group, the expression of INS-R, IRS1, p-AKT, AKT, and PI3K in the DM group was significantly decreased (P < .01, Figure 6F to H and J to L), and the level of GLUT2 in the DM group was significantly increased (P < .05, Figure 6F and I). Compared with the DM group, the expression of INS-R, IRS1, p-AKT, AKT, and PI3K in the IBC group and Met group were significantly increased (P < .05, Figure 6F to H and J to L), and the level of GLUT2 in the IBC group and Met group were significantly decreased (P < .01, Figure 6F and I).

Effect of IBC intervention on INS-R, INS1, GLUT2, p-Akt, Akt, p-PI3K, and PI3K expression in DM mice: (A-D) quantification of proteins with immunohistochemistry staining; (E) the expression of IRS1, p-Akt, p-PI3K, and GLUT2 was performed by immunohistochemistry, (F) the expression of INS-R, INS1, GLUT2, p-Akt, Akt, and PI3K proteins was detected by western blotting, and (G-L) quantification of proteins with western blotting. All data are expressed as the mean ± SD (n = 3-6 per group). *P < .05, **P < .01, ***P < .001, compared with the control group; #P < .05, ##P < .01, ###P < .001, compared with the DM group.
Effect of IBC Treatment on Liver Histopathology in Experimental Mice
The histopathological microstructures of liver tissues in each group are shown in Figure 7. Liver injury in each group was observed by using hematoxylin and eosin (H&E) staining. Microscopic examination of the liver tissue showed that in the control group, the size of liver cells was uniform, the lobules of the liver are well defined, and the hepatic marrow was ordered from the central vein to the periphery, without obvious steatosis and inflammatory cell infiltration. In the DM group, many small vacuoles were observed in the cytoplasm of hepatocytes; additionally, in some liver cells, the fusion of multiple small vacuoles into large vacuoles was observed, vacuolar degeneration, the hepatocyte nucleus being squeezed aside, hepatocyte steatosis, and sinus. In the IBC group, the liver lobule structure was clear, the cytoplasmic vacuoles of hepatocytes were significantly reduced, a few hepatocytes around the liver leaflet showed steatosis changes, individual cells showed edema, and vacuolar degeneration was observed.
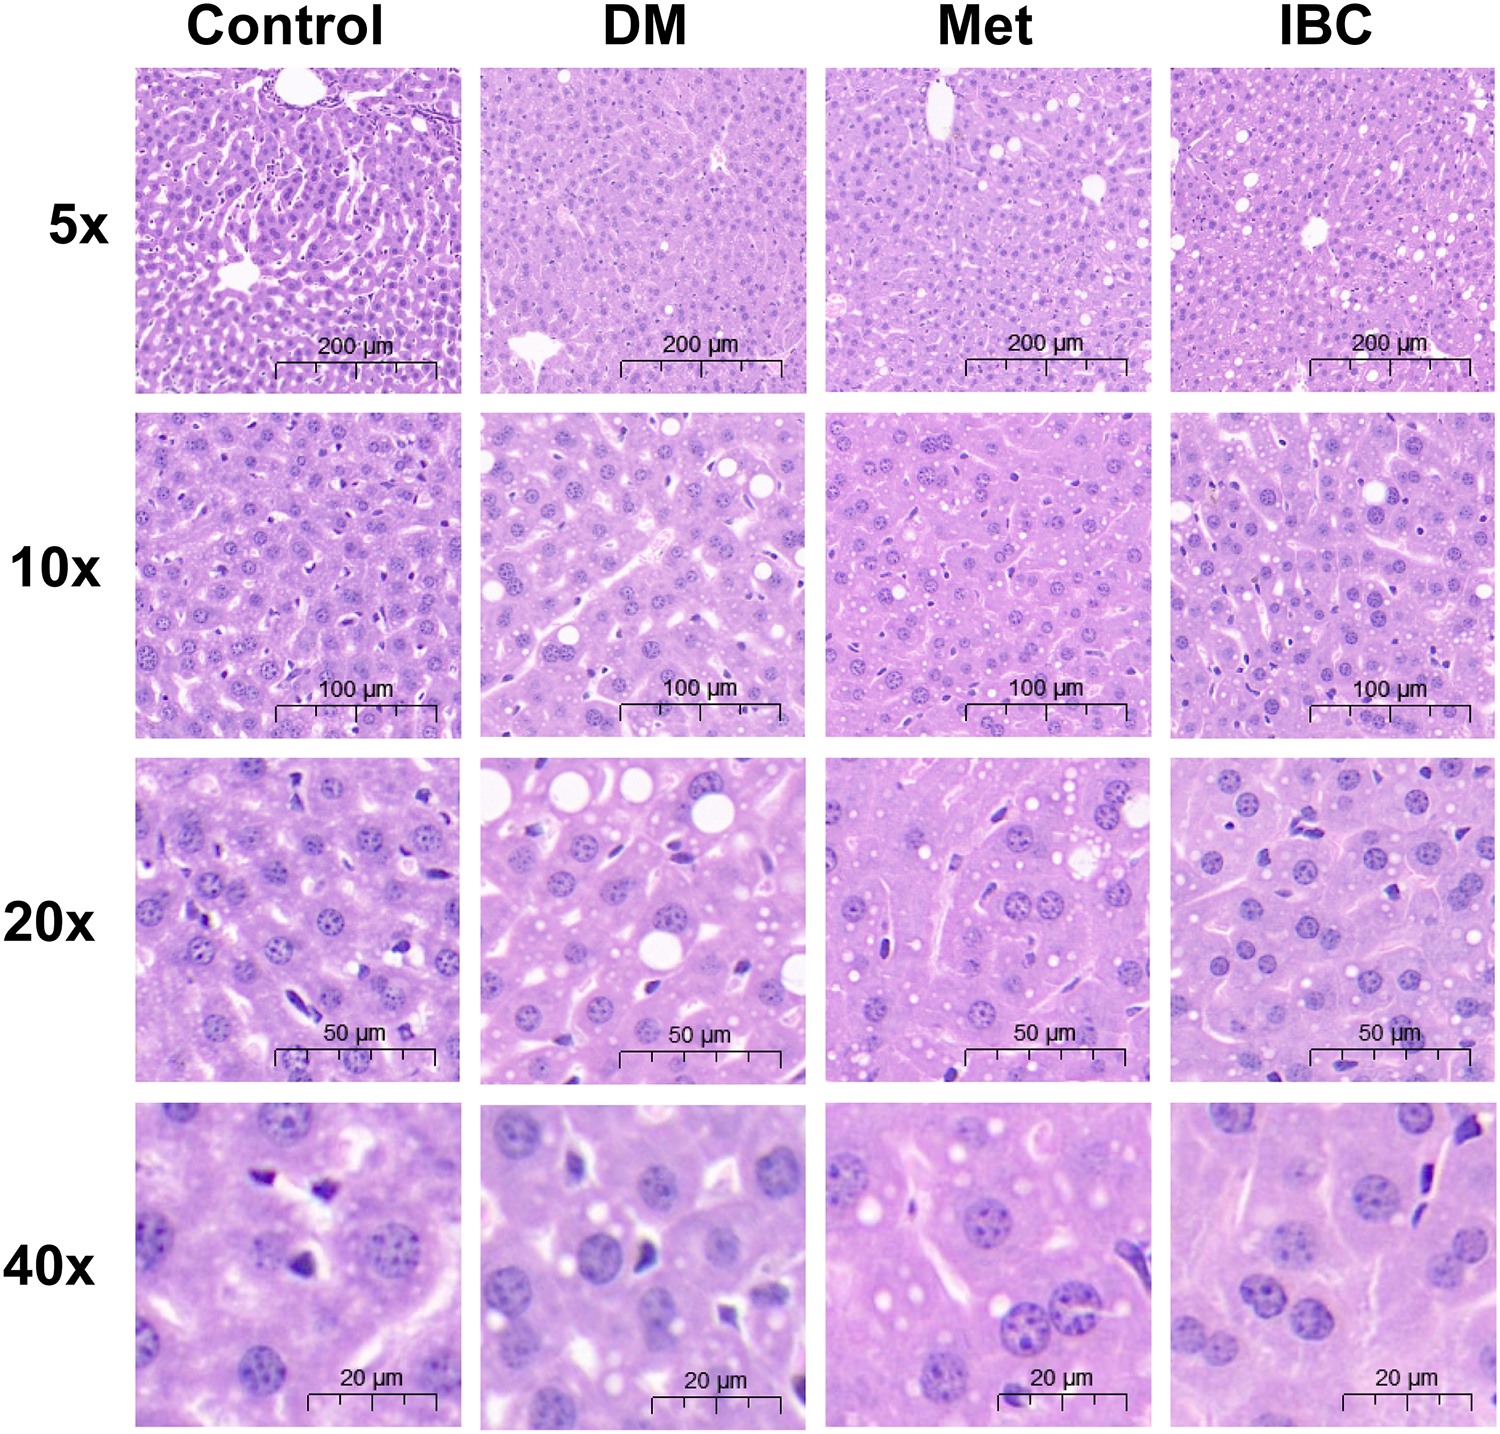
Effect of IBC treatment on histopathological changes in the liver of T2DM model mice.
Discussion
This study investigated the potential hypoglycemic effect of IBC on diabetic mice and its mechanism. T2DM mice were established by providing an HFD combined with low-dose tail vein injections of STZ. One week after STZ injection, mice exhibiting FBG levels ≥ 7.0 mmol/L were considered to have T2DM and were used for further experiments. 19 The results showed that FBG levels were 1.25-fold higher in the DM group than in the control group (P < .001, Figure 3B), elevated FBG leads to an increased risk of diabetic complications, so it is important to strictly control FBG to control the development of T2DM. 20 IBC treatment given to T2DM mice for 4 weeks had a positive effect on FBG levels, FBG was significantly lower in both the met and IBC groups compared to the DM group (P < .001). Therefore, the above results indicate that IBC has a good hypoglycemic effect.
T2DM mice induced with an HFD were characterized by lipid abnormalities, such as higher levels of TG and TC, due to the increased mobilization of free fatty acids from peripheral deposits to central blood circulation. 21 Obesity is the most significant risk factor for the onset of diabetes. 22 The triglyceride to high-density lipoprotein cholesterol (TG/HDL-C) ratio is a predictor of IR in a Chinese population with different glucose tolerance statuses.23,24 Dyslipidemia is multifactorial and related to poor glycemic control, IR, inflammation, and genetic susceptibility. 25 Recently, it has also been reported that IBC inhibits adipogenesis and prevents lipid accumulation, 18 in our study, IBC significantly reduced the expression level of serum TG (P < .001), and there was no significant difference in serum HDL-C level (P > .05), and there was a trend of down-regulation of TC and LDL-C expression in serum in the IBC group compared to the DM group although there was no significant difference. Therefore, IBC may be beneficial in the treatment and prevention of T2DM and diabetic complications.
In this study, no changes in the effects of IBC on hormones related to glucose regulation (eg, insulin and glucagon) were observed. To determine the molecular mechanism of action of IBC, we examined the gene and protein expression of INS-R, IRS1, PI3K, AKT, and GLUT2 in the liver. Insulin receptor substrate (IRS) proteins play an important role in the insulin signaling pathway, 26 IRS is phosphorylated when insulin binds to receptors on the surface of target cells, followed by PI3K activation. 27 Agriophyllum oligosaccharides have been reported to significantly enhance glycemic control by increasing the expression of molecules such as insulin receptors and insulin receptor substrates in liver tissue. 2 In T2DM mice, the expression of IRS1 was significantly inhibited, which corresponds to our results, as shown in Figures 5 and 6. After IBC treatment, compared with the DM group, the proteinic and mRNA expression of IRS1 and the expression of INS-R protein in the liver were significantly increased.
PI3K plays a critical role in insulin-induced signaling of hepatic glucose uptake. PI3K is upregulated by IRS, which binds and activates its downstream effector, AKT and GLUT2. 28 Alterations in GLUT2 expression can cause glucose uptake disorders, resulting in IR. 29 PI3K interacts with p-IRS and subunit p85 to activate or phosphorylate its downstream effector AKT. 28 This response results in the translocation of GLUT2 to the cellular membrane to facilitate glucose uptake. Glucose is transported into liver cells by GLUT2, which is mainly distributed in cell vesicles. Abnormal GLUT2 translocation can lead to disorders in glucose utilization, resulting in IR. 28 In the liver, GLUT2 plays an important regulatory role in maintaining blood glucose levels. A previous study demonstrated that GLUT2 is closely related to diabetes and GLUT2 expression is significantly reduced in diabetes. 30 GLUT2 in pancreatic islets is a crucial target molecule in diabetes induced by low doses of STZ in mice. 31 STZ can selectively destroy β cells in certain animal species and cause diabetes in many animals. STZ is transported to β-cells via the GLUT2, resulting in DNA damage and the further activation of proteins involved in DNA repair. 32 In this study, GLUT2 mRNA expression increased 3.3 times in T2DM mice injected with a low dose of STZ. As shown in Figure 4, 4 weeks after being treated with IBC, the mRNA levels of GLUT2 decreased by 62% in T2DM mice (P < .05). As shown in Figure 5, 4 weeks after being treated with IBC, the protein expression levels of PI3K and AKT were significantly improved in T2DM mice. These results suggest that IBC can control IR and glucose release by activating IRS1/PI3K/AKT signaling pathway.
Conclusions
In the present study, IBC played a role in regulating glucose and lipid metabolism and had a protective effect against type 2 diabetes-induced liver injury. Furthermore, we found that IBC affected the expression of IRS1/PI3K/AKT signaling pathway-related proteins in the liver of type 2 diabetic mice. These results may contribute to the development of compounds and new approaches for the prevention of T2DM-related diseases, and future experimental and clinical studies with larger samples are needed to facilitate their application.
Materials and Methods
Experimental Animals
C57BJ/6L mice (male) were obtained from Beijing Vital River Laboratory Animal Technology Co., Ltd [SCXK (JING) 2020-0006]. The animals were kept in an atmosphere of temperature (22 ± 2 °C) and humidity within a 40% to 60% RH in a 12 h light/dark cycle and available to food and water. Mice were domesticated within one week for further experiments. The experimental protocols were approved by the Committee on the Ethics of Animal Experiments of Binzhou Medical University (no. 057/2020).
Materials and Reagents
Streptozotocin (STZ) was purchased from Beijing Boao Tuoda Technology Co., Ltd. Glucose test strips were purchased from Tianjin Jiuan Medical Electronics Co. Ltd. IBC was purchased from Meilunbio. Carboxymethylcellulose sodium (CMC-Na) and sodium citrate buffers were purchased from Beijing Solarbio Technology Co., Ltd. The BCA Protein Concentration Assay Kit (enhanced) was purchased from Biyuntian Co., Ltd.
Experimental Design and Procedure
After selected at random, 34 healthy C57BL/6J male mice were acclimatized for 7 days, 6 mice were grouped as control and were fed with a standard diet (containing up to 4.0% fat); the rest of mice were given to the HFD (containing roughly 45.6% fat). Both diets were provided by Beijing HFK Bioscience Co. Ltd. After 8 weeks, glucose tolerance and insulin tolerance were detected using the OGTT and ITT. Mice with the HFD were injected with STZ (20 mg/kg body weight) via tail vein 19 after 7 days of OGTT and ITT. The mice with FBG levels ≥ 7.0 mmol/L were considered as T2DM model after 3 days of injection. Twenty-one out of the 28 mice with the T2DM model were fully completed. Twenty-one T2DM model mice with HFD were then stochastically grouped into the DM group (8 mice), Met group (6 mice), and IBC group (7 mice). The mice in the DM group were gavaged with 0.5% CMC-Na (2 mL/kg weight, p.o.), and the mice in the Met group and IBC groups were gavaged with (p.o.) 300 and 10 mg/kg/day, respectively. The treatment period was 4 weeks, and the body weight of mice was detected once per week. The mice were anesthetized with isoflurane after 4 weeks of treatment. Blood samples were collected for biochemical analysis.
Determination of Insulin Tolerance and Glucose Tolerance in Mice
Mice were fasted for 12 h before the OGTT. We measured the FBG of all mice, and blood glucose at 30, 60, 90, and 120 min were tested according to 2.0 g/kg with oral glucose. To determine insulin sensitivity, mice were intraperitoneally administered insulin (0.75 U/kg of body weight), and blood glucose was tested at 30, 60, 90, and 120 min. Calculate the AUC according to the formula, AUC (mg/dL/h) = (BG0 + BG30) × 15/60 + (BG30 + BG60) × 15/60 + (BG60 + BG90) × 15/60 + (BG90 + BG120) × 15/60.
Enzyme-linked Immunosorbent Assay (ELISA)
Triglyceride (TG), high-density lipoprotein cholesterol (HDL-C), low-density lipoprotein cholesterol (LDL-C), insulin, and glucagon in serum samples were performed using a microplate reader (TECAN) and available diagnostic kits (Shanghai Enzyme-linked Biotechnology Co., Ltd) following their corresponding instruction.
qRT-PCR
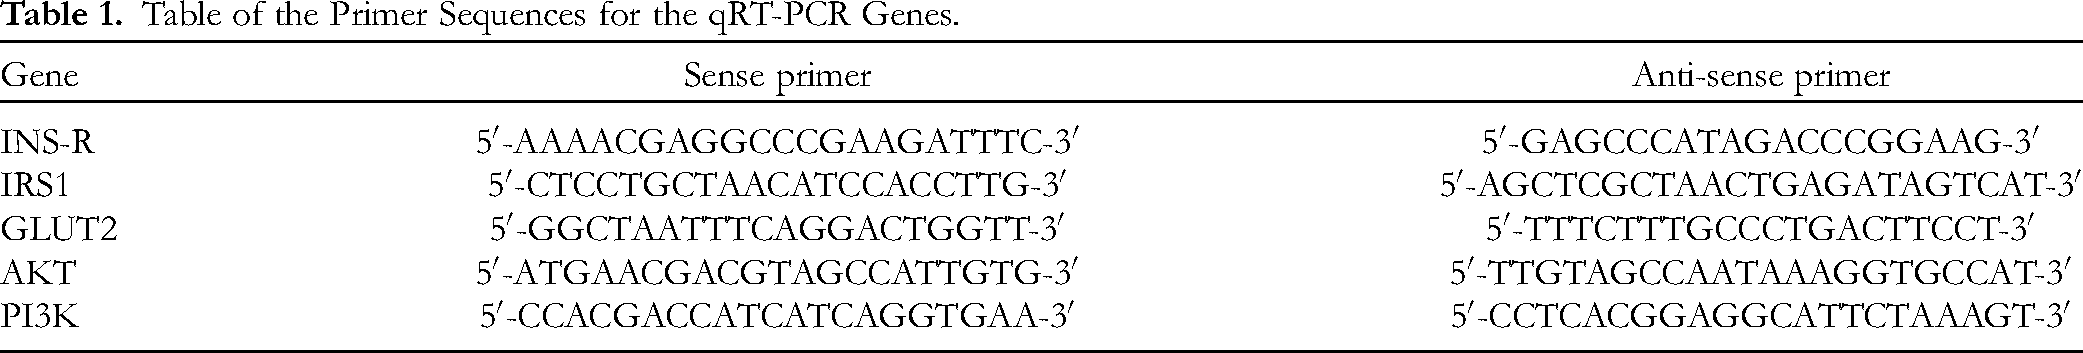
RNA was extracted from the liver tissue using the RNeasy Plus Micro Kit. For qRT-PCR, cDNA was reversed from the RNA using a reverse-transcription kit (Vazyme, HiScript® III RT SuperMix for qPCR). Relative gene expression was detected with SYBR Green (Applied Biosystems) on QuantStudio 3 Flex Real-Time PCR systems and calculated with ΔΔ cycle threshold (ΔΔCT) normalized to the loading control. The sequences used are given in Table 1.
Table of the Primer Sequences for the qRT-PCR Genes.
Immunohistochemistry
The liver sections were incubated with primary antibodies against IRS1 (1:300); phosphorylated AKT (p-AKT) (1:300); phosphatidylinositol 3-kinase (p-PI3K) (1:300); GLUT2 (1:200) overnight. Slices were then incubated with biotinylated anti-rabbit IgG secondary antibody, followed by DAB staining for signal development. A light microscope was used to obtain the results.
Western Blot
The protein concentration in the liver samples was examined using the BCA method (P0009, Biyuntian Co., Ltd). The extracted samples were separated in gel electrophoresis. Next, the proteins were transferred onto the nitrocellulose membranes and blocked with milk. Subsequently, the membrane was incubated overnight with primary antibodies: glyceraldehyde-3-phosphate dehydrogenase (GAPDH) (1:1000), INS-R (1:500), IRS1 (1:1500), GLUT2 (1:1500), PI3K (1:1000), AKT (1:1000), and p-AKT (1:1000). Next, the membranes were washed with TBST 3 times and were incubated with secondary antibodies at room temperature. Visualization was performed with ECL (Advansta Inc.) by an image analysis system (Shanghai Tian Neng Technology Co., Ltd).
Hematoxylin and Eosin Staining
The liver was stabled in 4% paraformaldehyde, after dehydration, the tissue was embedded in paraffin and cut into 5 µm thick sections. Sections were stained with H&E and observed under a microscope (ZEISS).
Statistical Analysis
GraphPad Prism 9 software was utilized for all data analysis. The data were presented as the means ± standard deviation (SD). One-tailed, unpaired Student's t-tests were used to assess the statistical significance between the 2 groups. Comparisons between multiple groups were performed using a one-way analysis of variance (one-way ANOVA). Results with P < .05 were considered statistically significant; results with P < .01 were considered extremely significant.
Supplemental Material
sj-tif-1-npx-10.1177_1934578X231204742 - Supplemental material for Isobavachalcone Inhibits Hyperglycemia and Hyperlipemia in Type 2 Diabetes and the Underlying Mechanisms
Supplemental material, sj-tif-1-npx-10.1177_1934578X231204742 for Isobavachalcone Inhibits Hyperglycemia and Hyperlipemia in Type 2 Diabetes and the Underlying Mechanisms by Zhenhong Xia, Xiaoran Liu, Yuqi Li, Zhiqi Li, Feixue Ni, Geng Tian and Wenguo Jiang in Natural Product Communications
Footnotes
Author Contributions
All authors had full access to all research results and were responsible for the accuracy of the data. Zhenhong Xia and Xiaoran Liu performed all the experiments; Zhenhong Xia and Xiaoran Liu contributed equally to this work and should thus be considered co-first authors; Yuqi Li, Zhiqi Li, and Feixue Ni assisted with parts of the experiments. Wenguo Jiang and Geng Tian contributed to writing and critically revising the manuscript. All the authors have read and agreed to the published version of the manuscript.
Data Availability Statement
Data is contained within the article.
Declaration of Conflicting Interests
The author(s) declared no potential conflicts of interest with respect to the research, authorship, and/or publication of this article.
Funding
The author(s) disclosed receipt of the following financial support for the research, authorship, and/or publication of this article: This work was supported by the Major Basic Research Project of [Natural Science Foundation of Shandong Province] under Grant [ZR2019ZD27], [Shandong Province Higher Educational Youth Innovation Science and Technology Program] under Grant [2019KJE013], and [Special Project of Central Government for Local Science and Technology Development of Shandong Province] under Grant [YDZX20203700001291], [Taishan Scholars Construction Engineering to GT], and [Natural Science Foundation of Shandong Province] under Grant [ZR2021QH305], and [Startup Foundation for Introducing Talent of Binzhou Medical University] under Grant [BY2020KYQD24]. We would like to thank Editage for the English language editing.
Ethical Approval
The animal study protocol was approved by the Committee on the Ethics of Animal Experiments of the Binzhou Medical University (No. 057/2020), following the guidelines of animal use and care.
Statement of Human and Animal Rights
All experimental procedures involving animals were in accordance with the Binzhou Medical University Institutional Animal Care Guidelines and approved by the Binzhou Medical University Laboratory Animal Management Committee.
Statement of Informed Consent
There are no human subjects in this article and informed consent is not applicable.
Supplemental Material
Supplemental material for this article is available online.
References
Supplementary Material
Please find the following supplemental material available below.
For Open Access articles published under a Creative Commons License, all supplemental material carries the same license as the article it is associated with.
For non-Open Access articles published, all supplemental material carries a non-exclusive license, and permission requests for re-use of supplemental material or any part of supplemental material shall be sent directly to the copyright owner as specified in the copyright notice associated with the article.