
Abstract
Keywords
Introduction
Ericameria nauseosa (Pursch) G.L. Nesom & G.I. Baird [syn. Chrysothamnus nauseosus (Pall. ex Pursh) Britton], rubber rabbitbrush (Asteraceae) is a shrub that grows in arid regions of western North America from around 102° west longitude to the Pacific coast. 1 The plant serves as winter forage for mule deer (Odocoileus hemionus), elk (Cervus canadensis), and pronghorn (Antilocapra americana). 2 The Cheyenne Native Americans used a decoction of the aerial parts as a wash to treat sores and skin eruptions; an infusion of the inflorescences was taken to treat coughs. 3 The plant has been considered as a substitute source of rubber. 4 Currently, E. nauseosa is made up of 2 subspecies (subspp. nauseosa and consimilis) and 22 varieties.5,6
The phytochemistry of E. nauseosa has been previously investigated (as Chrysothamnus nauseosus). A chloroform extract of E. nauseosa has yielded polyacetylenes 7 and grindelane diterpenoids. 8 There have been several investigations into the volatile phytochemistry of E. nauseosa.9–12 Major compounds reported in the essential oils were monoterpene hydrocarbons, β-phellandrene (18.0%-26.0%), β-pinene (9.2%-30.3%), limonene (4.7%-33.2%), (Z)-β-ocimene (trace-14.6%), myrcene (0.9%-10.5%), and (E)-β-ocimene (0.3%-9.1%).11,12 The purpose of this work was to examine the essential oil compositions of E. nauseosa subsp. nauseosa from several locations in southwestern Idaho and north-central Utah.
Results and Discussions
Essential oil Composition
Hydrodistillation of E. nauseosa aerial parts gave colorless essential oils in yields ranging from 0.030% to 0.294% (Utah samples) and 0.763% to 2.011% (Idaho samples). The essential oil compositions for the Utah and the Idaho samples are compiled in Tables 1 and 2, respectively.
Chemical Composition (%) of Aerial Parts Essential oil of Ericameria nauseosa subsp. nauseosa from North-Central Utah.

— = not detected.
Abbreviations: RIcalc, retention index determined with respect to a homologous series of n-alkanes on a ZB-5 ms column; RIdb, reference retention index obtained from the databases; tr, trace (<0.05%).
Chemical Composition (%) of Aerial Parts Essential Oil of Ericameria nauseosa subsp. nauseosa from Southwestern Idaho.

— = not detected.
Abbreviations: RIcalc, retention index determined with respect to a homologous series of n-alkanes on a ZB-5 ms column; RIdb, reference retention index obtained from the databases; tr, trace (<0.05%).
The total number of compounds identified in the essential oils from Idaho ranged from 31 (ID#3) to 53 (ID#1), accounting for ≥99% of the total compositions. The major components in E. nauseosa essential oils from Idaho were β-phellandrene (29.4%-56.5%), β-pinene (4.2%-13.7%), (Z)-β-ocimene (0.2%-29.3%), and sabinene (2.0%-8.8%), with monoterpene hydrocarbons, in general (84.7%-92.1%), dominating the compositions. In contrast, the essential oils from Utah showed higher percentages of sesquiterpene hydrocarbons (4.9%-37.1%) and oxygenated sesquiterpenoids (0.0%-50.7%). In the Utah essential oils, β-phellandrene (1.8%-35.9%%), β-pinene (0.3%-23.3%), (Z)-β-ocimene (0.1%-12.9%), and sabinene (0.2%-7.6%) were major monoterpene components, along with myrcene (0.7%-12.9%) and limonene (0.9%-22.3%). The dominant sesquiterpenoid components in the Utah samples were α-cadinol (0.8-21.7%), δ-cadinene (0.6-10.5%), and ar-curcumene (2.9-6.6%). The essential oil compositions reported by Chao et al. 11 (collected near Salt Lake City, Utah; coordinates not reported) and by Tabanca et al. 12 (collected from Blaine County, Idaho; coordinates and elevation not reported) are similar in composition to those found in Utah samples UT#1, UT#2. UT#3, UT#4, and UT#5 in this present study.
Multivariate Analysis
In order to investigate the phytochemical relationships between the E. nauseosa essential oil samples, the percentages of the major components were subjected to agglomerative hierarchical cluster analysis (HCA) (Figure 1). The HCA shows that most of the E. nauseosa samples show >50% similarity in essential oil compositions. The lone exception was sample UT#8, which was collected in March 2021, from Pleasant Grove, Utah.
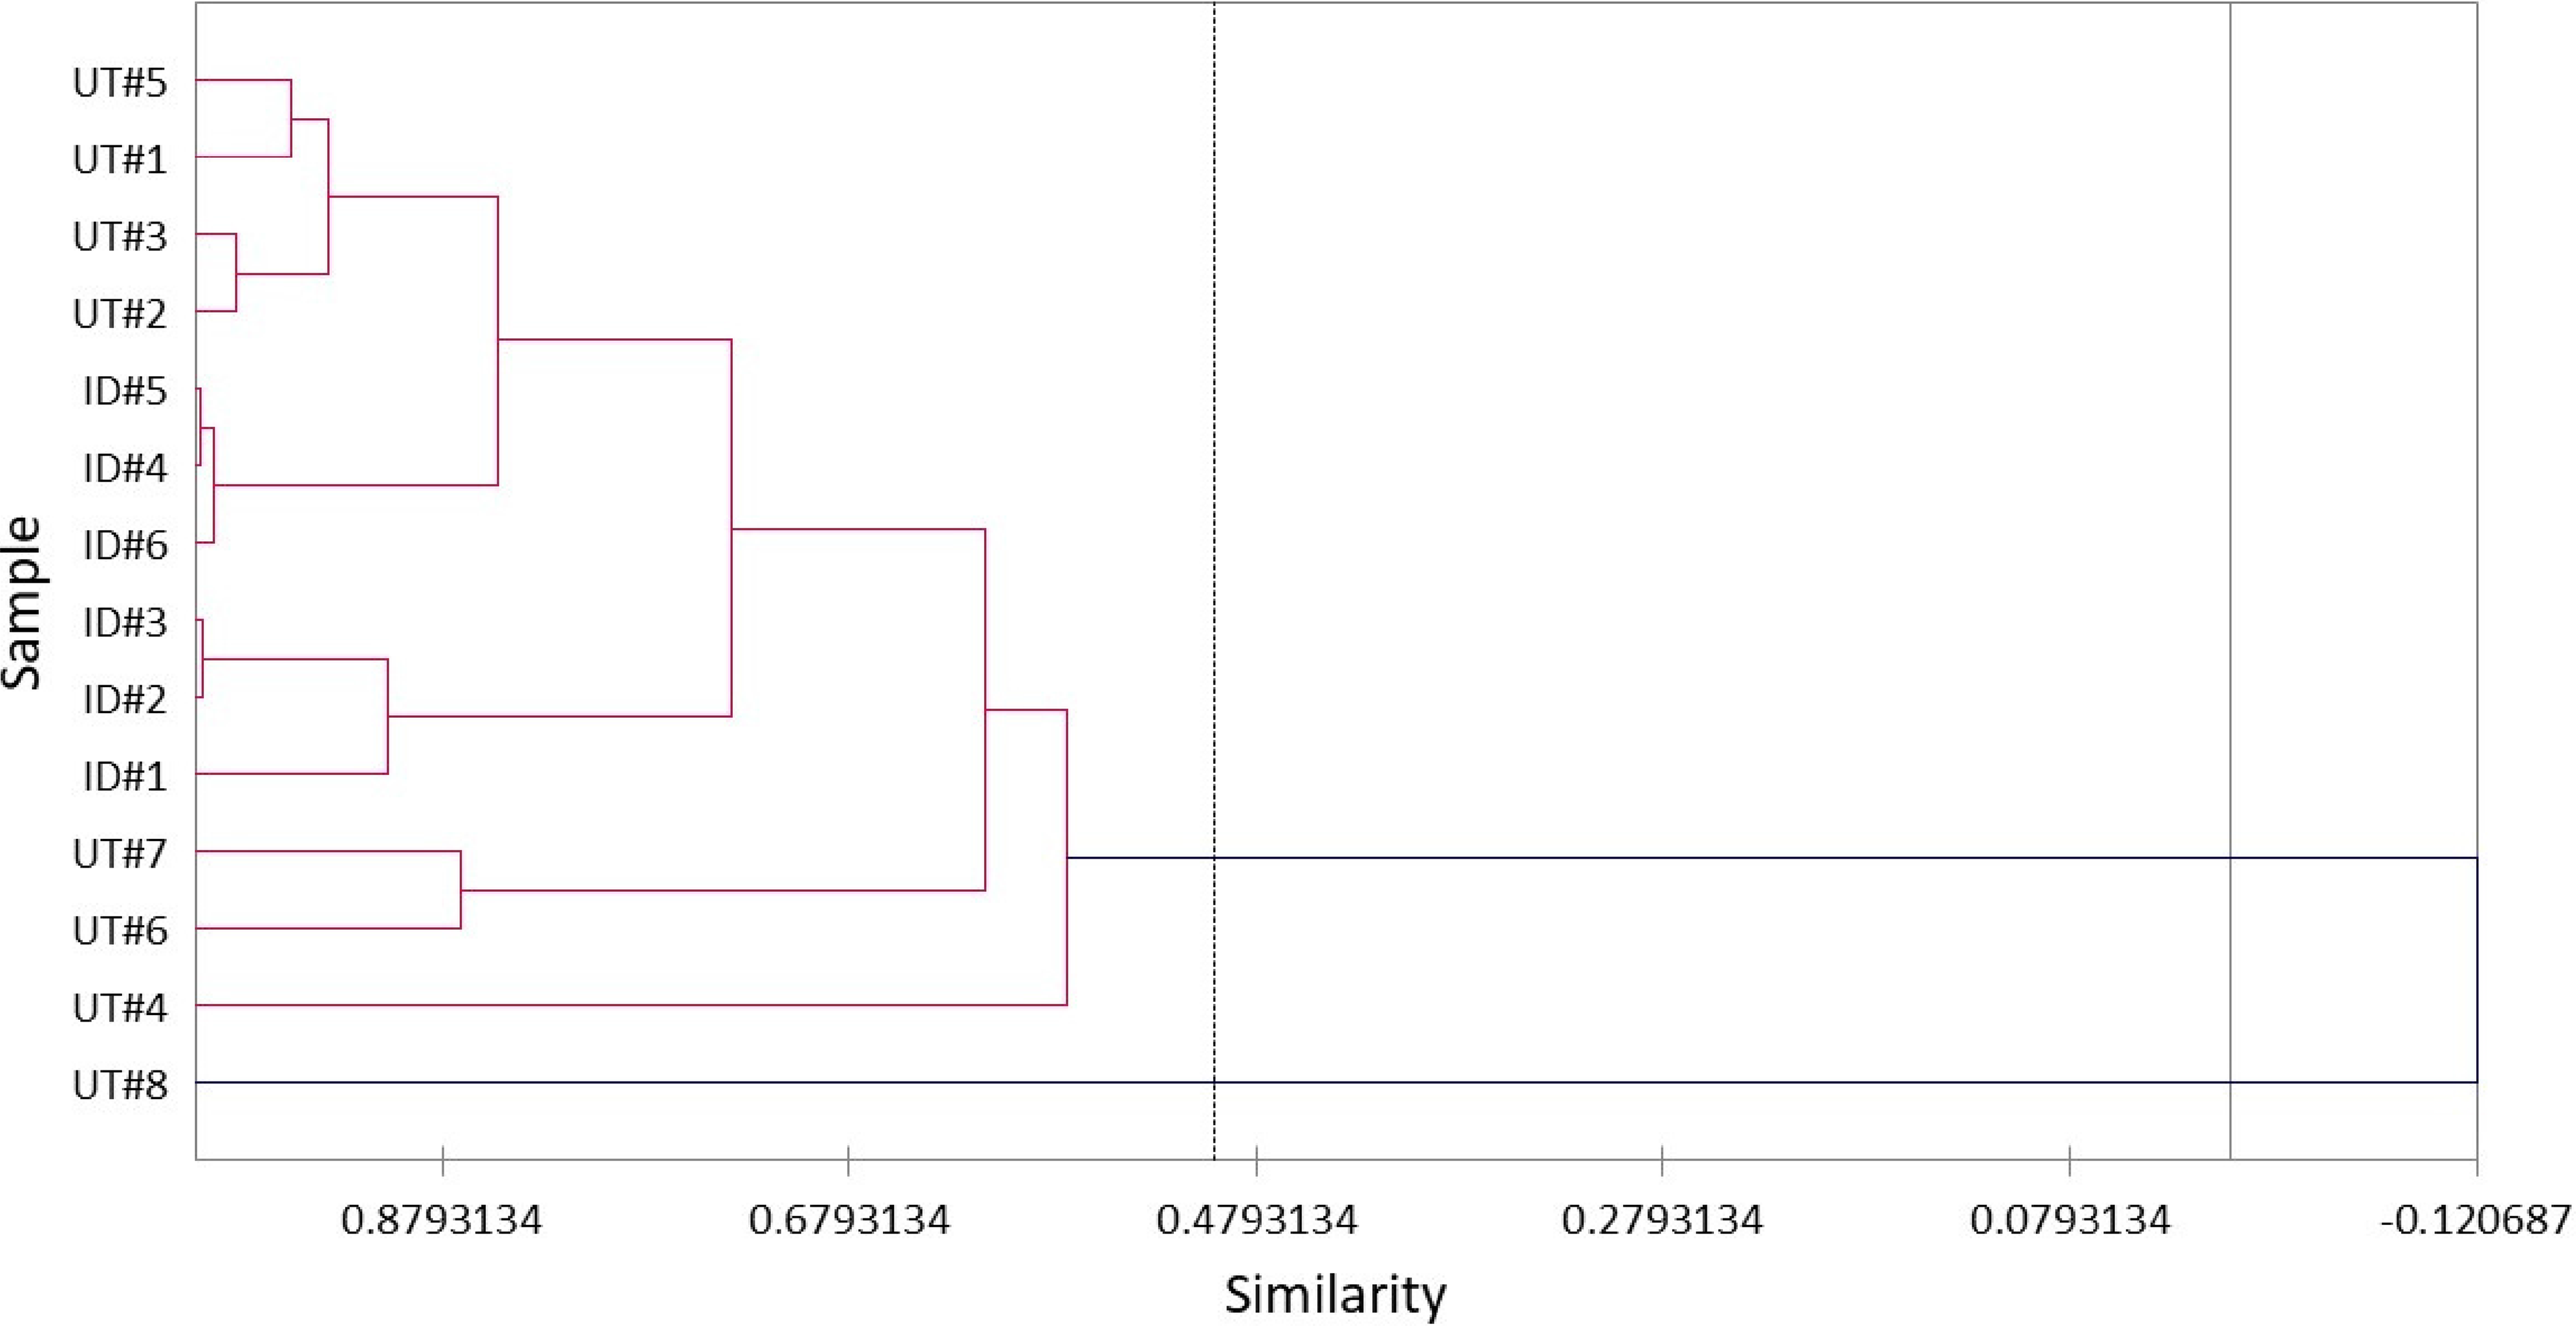
Dendrogram representing the similarities of the essential oil compositions of Ericameria nauseosa.
A principal component analysis (PCA) was carried out to verify the interrelation between the major components in the essential oils (Figure 2). The PCA shows most of the E. nauseosa essential oils positively correlate with the monoterpene hydrocarbons β-phellandrene, β-pinene, limonene, and (Z)-β-ocimene, while sample UT#8 correlated with sesquiterpenoid concentrations.

Principal component analysis (PCA) of the essential oils of Ericameria nauseosa.
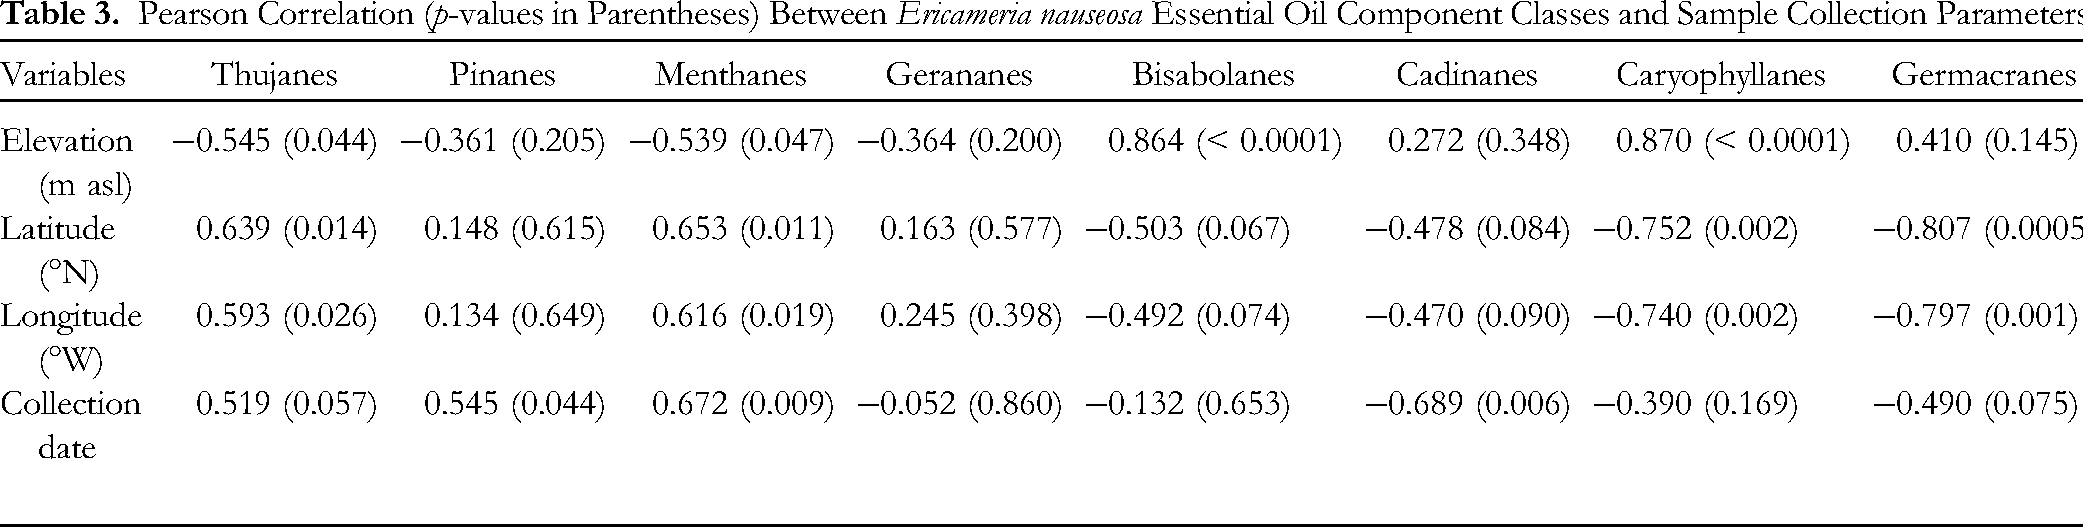
In order to examine the potential correlation between chemical composition and geographical location (elevation, latitude, and longitude) and season (date of collection), a Pearson correlation analysis was carried out. Based on the Pearson correlation analysis (Table 3), the elevation of the collection site showed a positive and statistically significant correlation (p < 0.05) with bisabolane sesquiterpenoids (r = 0.864, p < 0.0001), and caryophyllane sesquiterpenoids (r = 0.870, p < 0.0001), and negative correlation with thujane monoterpenoids (r = −0.545, p = 0.044) and menthane monoterpenoids (r = −0.539, p = 0.047). The thujane and menthane monoterpenoids had a positive correlation with both latitude (r = 0.639, p = 0.014; r = 0.593, p = 0.026) and longitude (r = 0.653, p = 0.011; r = 0.616, p = 0.019). There was a negative correlation between caryophyllane sesquiterpenoids and latitude (r = −0.807, p = 0.0005) and longitude (r = −0.797, p = 0.001). These correlations are consistent with the higher concentrations of monoterpene hydrocarbons observed for the Idaho samples and the higher concentrations of sesquiterpenoids found in the Utah samples. The Utah collections sites were higher in altitude, but lower in both latitude and longitude. The geographical site of collection had an important effect on the chemical compositions of the essential oils. There were also positive correlations between collection date (ie, seasonal variation) and pinane (r = 0.545, p = 0.044) and menthane (r = 0.672, p = 0.009) monoterpenoids. Conversely, a negative correlation was found for cadinane sesquiterpenoids and collection date (r = −0.689, p = 0.006). That is, pinane and menthane concentrations apparently increased during the season, while cadinane concentrations decreased.
Pearson Correlation (p-values in Parentheses) Between Ericameria nauseosa Essential Oil Component Classes and Sample Collection Parameters.
In order to further compare the E. nauseosa essential oil samples collected from Utah with those from Idaho, the concentrations of the major components were subjected to two-sample t-test for each compound. The average (± standard deviations) concentrations of the major components are listed in Table 4. The concentrations of the monoterpenoids, sabinene, β-phellandrene, 1,3,8-p-menthatriene, and terpinene-4-ol were significantly higher in the Idaho samples compared to the Utah samples. Conversely, several sesquiterpenoids, (E)-β-caryophyllene, γ-curcumene, germacrene D, α-muurolene, γ-cadinene, and δ-cadinene, had higher concentrations in the Utah samples.
Comparison of Concentrations of Major Components of Ericameria nauseosa Essential Oils Collected from North-Central Utah and Southwestern Idaho.

*Significantly higher concentration (t-test), p < 0.05.
Terpenoid Enantiomeric Distributions
Several of the E nauseosa essential oils were analyzed by chiral gas chromatography-mass spectrometry (GC-MS) in order to determine the enantiomeric distributions of monoterpenoids (Table 5).
Enantiomeric Distribution of Monoterpenoid Components in Ericameria nauseosa Essential Oils from Utah and Idaho.

Abbreviations: nd, not detected; RT, retention time (min).
(−)-α-Thujene was the dominant enantiomer in all samples, and showed a higher proportion in the samples from Idaho compared to the samples from Utah, but the differences were not significant (t-test, p = 0.072). Although variable, (−)-α-pinene predominated over (+)-α-pinene in all samples, ranging from 59.5% to 90.1% for the Utah samples and 78.0%-90.6% for the Idaho samples. (−)-Sabinene was the exclusive enantiomer in the Utah samples but showed variation (74.4%-81.0%) in the Idaho samples. (−)-β-Pinene was the major enantiomer in all samples, ranging from 89.6% to 99.6%. (−)-α-Phellandrene was dominant in the Idaho samples (average 96.0%), but was variable in the Utah samples (31.1%-94.8%). Interestingly, limonene was nearly racemic in the Utah samples with an average of 40.9% (−)-limonene and 59.1% (+)-limonene, but (−)-limonene dominated in the Idaho samples (average 94.5%). (−)-β-Phellandrene was the dominant enantiomer in the samples from Utah (average 99.1%), but was the exclusive enantiomer in the samples from Idaho. (−)-cis-Sabinene hydrate (average 78.9%) and (−)-trans-sabinene hydrate (average 78.3%) were the major enantiomers in the Idaho samples but were not detected in the samples from Utah. (−)-Terpinen-4-ol was the major enantiomer in all samples and ranged from 65.8% to 68.6%. (−)-α-Terpineol was the exclusive enantiomer in the samples from Utah, and although the major enantiomer in the Idaho samples, the concentration was significantly lower (average 74.1%). Thus, the enantiomeric distributions show significant differences between the Utah and the Idaho samples.
Conclusions
Eight essential oil samples of E. nauseosa subsp. nauseosa were collected from North Central Utah and 6 samples were collected from Southwestern Idaho. The essential oil compositions are qualitatively similar to those previously reported by Chao et al. 11 and Tabanca et al. 12 ; corroborating the results of these previous reports and suggesting generally consistent chemical profiles for this plant. Nevertheless, subtle quantitative differences between the Utah samples and the Idaho samples were observed. The enantiomeric distributions of monoterpenoids are reported here for the first time and do reveal interesting differences and similarities between the Utah and Idaho collections. In order to more fully delineate the volatile phytochemistry of E. nauseosa, additional research is needed to examine essential oil compositions from other geographical locations and different seasons in western North America to verify the trends observed.
Materials and Methods
Plant Material
Aerial parts of E. nauseosa subsp. nauseosa were collected from several plants growing in north-central Utah and southwestern Idaho (Table 6). The plants were identified by B. G. Platt and W. N. Setzer using published botanical descriptions5,6 and by comparison with samples from the New York Botanical Garden Virtual Herbarium (https://sweetgum.nybg.org/science/vh/, accessed on May 3, 2022). A voucher specimen (WNS-Enn-0049) has been deposited in the University of Alabama in Huntsville Herbarium. The fresh-frozen (−20 °C) plant materials were hydrodistilled using either a Clevenger apparatus (Utah samples) or a Likens-Nickerson apparatus (Idaho samples) to give the essential oils as colorless oils with a pungent aroma.
Collection Details for Ericameria nauseosa subsp. nauseosa.

Gas Chromatography
The essential oils of E. nauseosa subsp. nauseosa were analyzed by gas chromatographic techniques, including gas chromatography-mass spectrometry (GC-MS), gas chromatography-flame ionization detection (GC-FID), and chiral GC-MS as previously described. 13 Retention index (RI) values were determined with respect to a homologous series of n-alkanes on a ZB-5 ms column using the linear equation of van den Dool and Kratz. 14 The essential oil components were identified by comparison of the mass spectral fragmentation patterns and by comparison of RI values available in the Adams, 15 Mondello, 16 NIST20, 17 and our own in-house database. 18 The identification of enantiomers was determined by comparison of retention times with authentic samples obtained from Sigma-Aldrich (Milwaukee, WI, USA).
Statistical Analysis
The HCA, using Pearson correlation to measure similarity, and the unweighted pair group method with arithmetic average (UPGMA) for cluster definition, was used to analyze the similarity of the oil samples based on the distribution of the 27 components with the highest concentrations (average > 0.5%: β-phellandrene, β-pinene, limonene, (Z)-β-ocimene, sabinene, (E)-β-ocimene, myrcene, 1,3,8-p-menthatriene, α-cadinol, δ-cadinene, γ-curcumene, (E)-β-caryophyllene, germacrene D, terpinen-4-ol, γ-terpinene, τ-muurolol, geranyl acetate, τ-cadinol, β-eudesmol, α-terpinene, ar-curcumene, γ-cadinene, cosmene, citronellyl acetate, α-pinene, α-muurolene, and α-oplopenone). The PCA was utilized to verify the interrelation in the essential oil major components (see above). A Pearson correlation analysis was carried out to determine the phytochemical relationships with the collection parameters (elevation, latitude, longitude, and collection date). The HCA, PCA, and Pearson correlation analyses were performed using XLSTAT v. 2018.1.1.62926 (Addinsoft). Statistical significance was determined by two-sample t-test (p < 0.05) using Minitab® 18 (Minitab Inc., State College).
Footnotes
Acknowledgments
Declaration of Conflicting Interests
The author(s) declared no potential conflicts of interest with respect to the research, authorship, and/or publication of this article.
Funding
The author(s) received no financial support for the research, authorship, and/or publication of this article.
Ethical Approval
Ethical approval is not applicable for this article.
Statement of Human and Animal Rights
This article does not contain any studies with human or animal subjects.
Statement of Informed Consent
There are no human subjects in this article and informed consent is not applicable.